AMD deep dive for 10/16

Less than two weeks remain until AMD earnings and it continues to trade in a channel. What's next for AMD? 🎃

Happy Monday! We're less than two weeks away from AMD's earnings on 10/31. 🎃
I wrote a lot about AMD's chart in Charts & Coffee yesterday, so go back and read that if you haven't already. Today's post covers AMD's options flow, gamma exposure, vanna exposure, and some additional data.
All investments come with significant risks, including the loss of all capital. Please do your own research before investing, and never risk more than you are willing to lose. I hold no certifications or registrations with any financial entity.
Let's get into the data! 🔎
Options flow
Friday's flow was mixed and AMD ended the day leaning slightly bearish. On a five day scale, AMD tilts towards the bullish side by about $3M in net flows. Although I would have thought this gap was pretty small a year ago, AMD has been stuck in a channel lately and this gap certainly means more now than it did then.
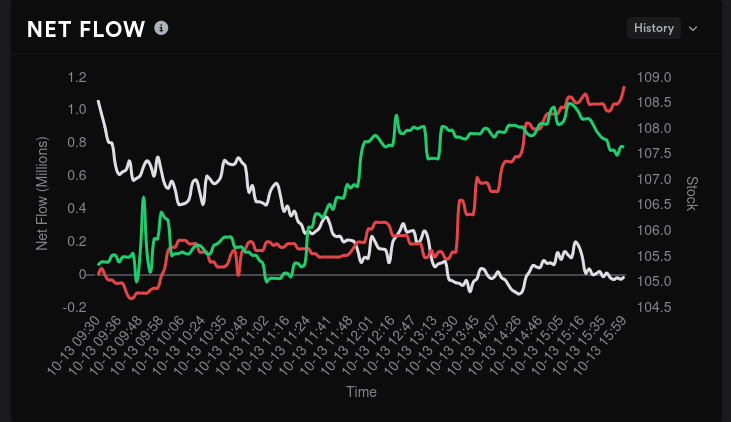
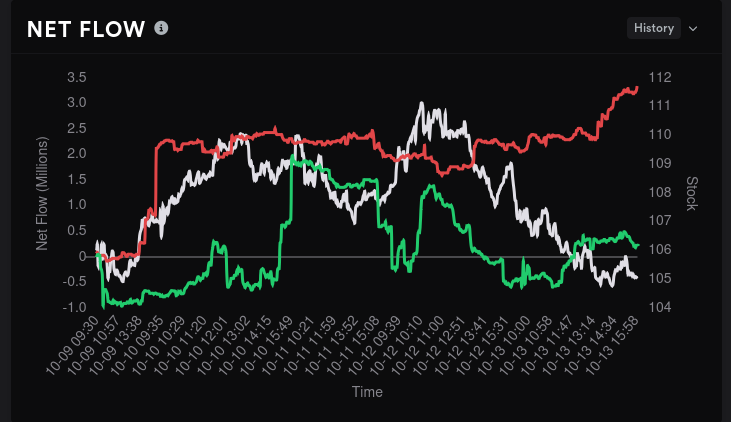
AMD options flow for one and five days
AMD's options volume was relatively high last week and the open interest on calls surpassed the open interest on puts. Puts became more expensive last week, so this leads me to think we're seeing a decent amount of sold calls and long puts on AMD now.
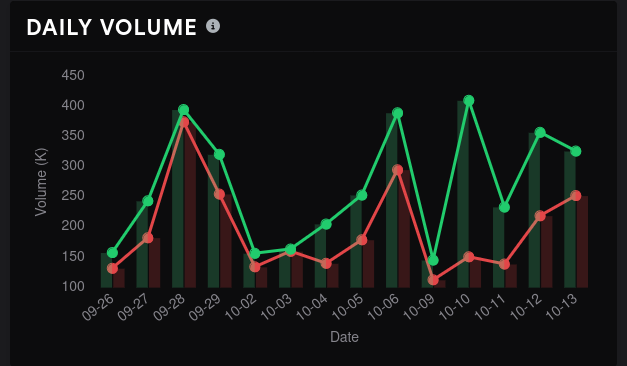
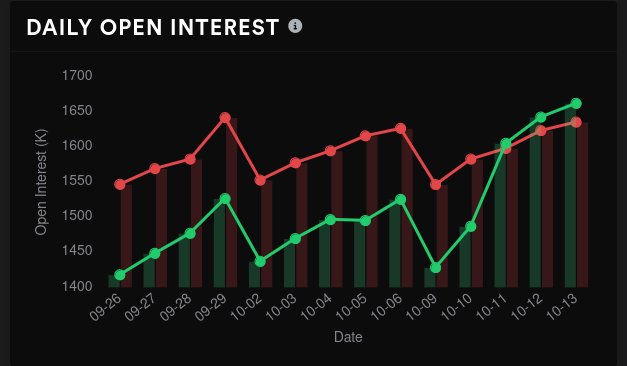
AMD options volume and open interest
So far, AMD looks like it's tilting slightly bearish going into the OPEX this week and that's in line with my expectation.
Vanna
AMD's overall vanna picture is quite positive if you look at the extreme left and right side of the graph. This suggests that a drop in implied volatility (IV) would apply bullish price pressure to AMD.
However, positive vanna runs out past $115, and the line at $115 isn't too strong by itself. $110 is the largest by far and we saw that working well as a magnet for price last week.
One more thing to note is that $105 disappeared and $100 turned negative. This means the trading channel for AMD is widening going into earnings. We now have a $90 to $115 range.
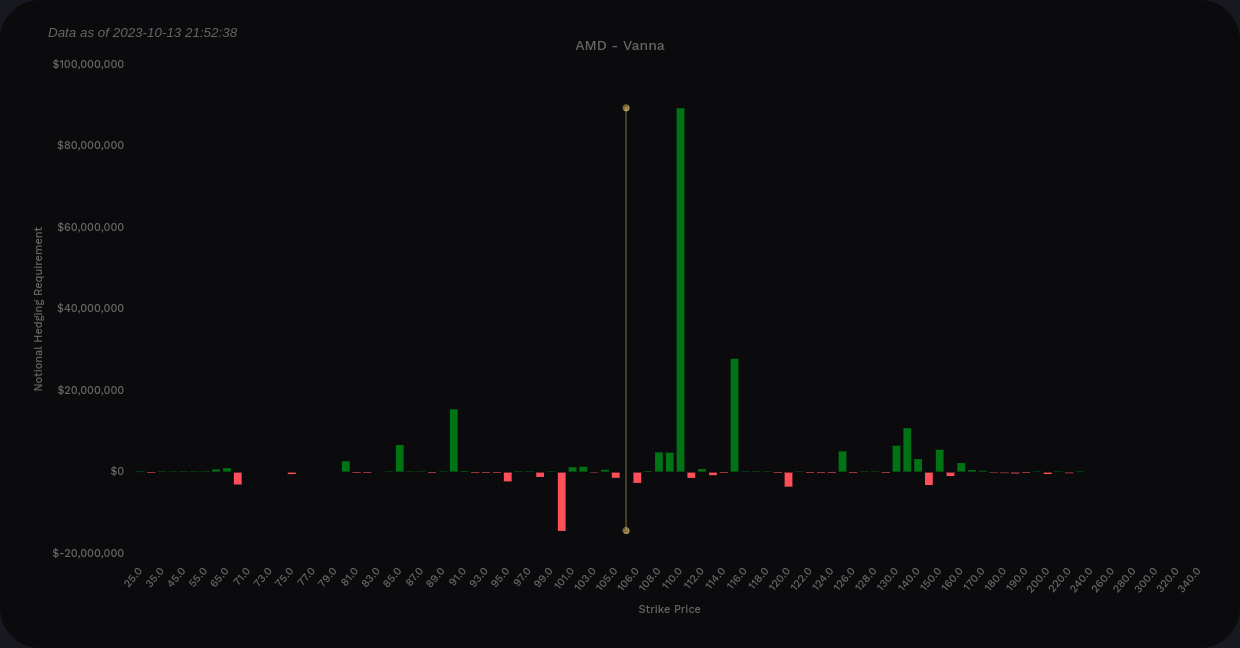
AMD aggregate vanna from Volland
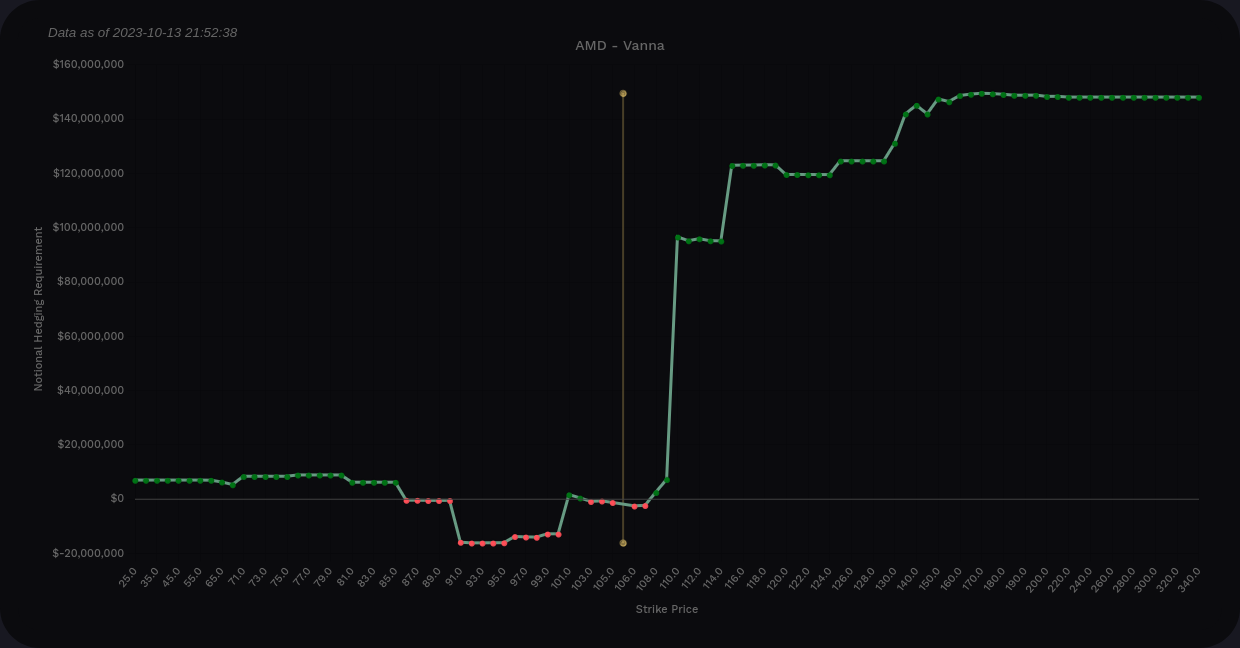
If we include only 10/20 and 10/27 to avoid getting earnings data mixed in, we see a trading range from about $100-$110. Note that price is almost right on top of the $105 negative vanna line and that means that vanna has almost no effect there. If price moves to $106, that $105 line flips positive and could provide a small amount of bullish pressure.

At this point, overall flow is pointing bearish and vanna suggests we're in a $100-$110 range prior to earnings. After earnings, we could open up to moves from $90-$115.
Gamma exposure
Our biggest area of negative GEX sits around $108-$110 and that's right inside the equilibrium zone from the chart. $105 shows up as resistance here, just as it did in the vanna chart.

11/17 is the biggest GEX expiration and what do we have? Here's a trading range from $95 to $115. I do like seeing that big $125 level there but that seems out of reach based on my charts from yesterday and the vanna levels above.
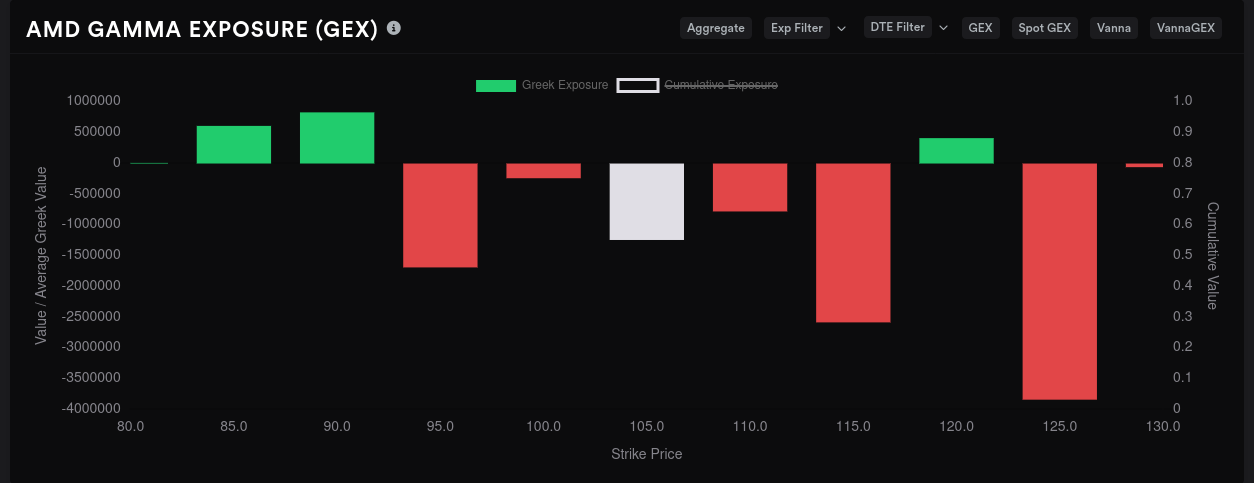
Volland also offers delta-adjusted gamma, which is a gamma chart that shows what dealers need to do at certain strikes. Red here means dealers will sell shares to hedge and green means they will buy shares to hedge.
We see big resistance to upward price movement at $110 and $105. $115 also shows up as a top end resistance level here and that matches the vanna data we saw earlier. A small amount of buying shows up around $100 and $105, but these levels are likely too small to have an impact.

Whale trades
Traders that trade lots of contracts at once with serious money can sometimes give hints as to where the market is going. These are tricky to interpret because they could be hedges.
For example, someone might be shorting AMD and buying lots of $115 calls so they don't get blown up if AMD skyrockets after earnings. People with long AMD shares might pick up lots of $100 puts to protect themselves in case of a steep decline.
Some traders are going aggressively bearish on $110 and holding. $100 is also sinking.
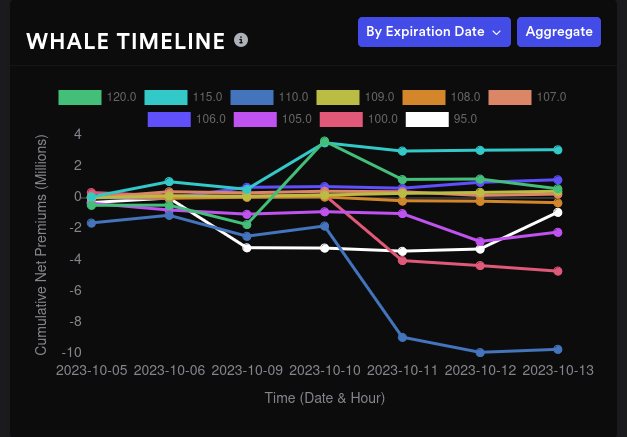
10/20 shows a jump in bullishness for $95 but a bearish turn for $100.
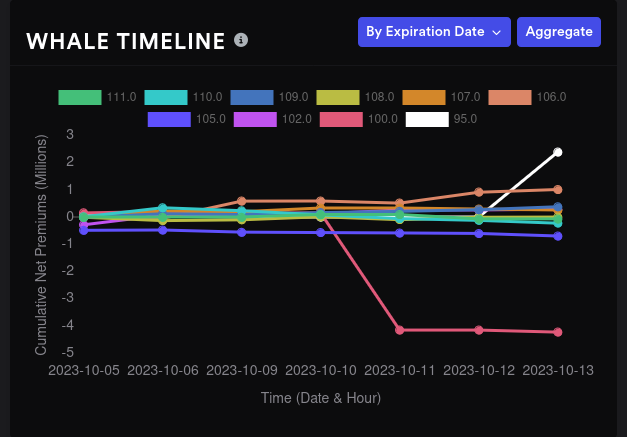
The curve of the $110 in the 11/17 chart matches almost exactly to the one in the aggregate chart. This is a big earnings bet that AMD will move lower than $110. It could also be a hedge for someone's long AMD shares.

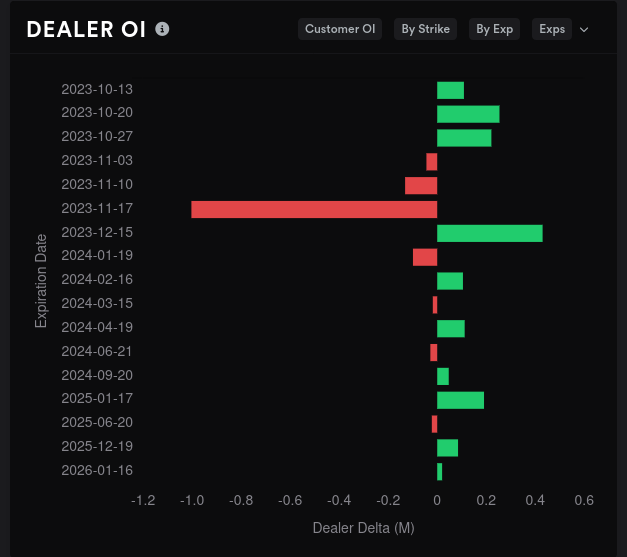
Dealer positioning
Bear in mind that dealers, or market makers, do not want a bias in the market. Their ability to remain neutral is critical and different platforms to various calculations to see what orders might be picked up by dealers.
The weekly chart below shows dealer deltas along the bottom. Red lines indicate that dealers are sitting on more short contracts and customers in the market are on the long side of options trades. Green lines show dealers with more long trades and customers going short.
The current look shows dealers and customers almost in balance with dealer deltas slightly short. This means customers are likely long here. The momentum over 15 days looks like customers are getting slightly more bullish on AMD.

Based on where dealers sit in the trades, estimates can be made about which expiration dates are bullish or bearish. Remember that this chart is from the dealer perspective, so you need to flip the colors for customer sentiment. Most expiration dates are bearish here except for 11/17.
Thesis
AMD once again shows up with some mixed data this week. There's plenty of evidence showing that AMD is likely stuck in this $95-$110 range until earnings. Both ends open up a bit from $90-$125 after earnings.
Earnings are inherently dangerous binary events that sometimes have totally illogical responses from traders. AMD could post great results and fall to $90. They could also post the worst results in a year and fly to $125. Be careful trading across these events!
I've decided to throw my hat in for earnings and I've sold a few puts at $95 and $100 for 11/17. I still have some poorly sold $104 calls for 10/20 that are still quite red. If I can hop out of those this week for a small profit, I'll likely do that.
I really like the $80-$90 zone for selling more puts on AMD. There's a big order block below the current price level and it's halfway between equilibrium and the discount zone.
On the top end, I've been burned many times by AMD rallies that blew through my covered calls like a knife through butter. I would consider selling some covered calls in the $125-$130 area since it's above equilibrium and it's two order blocks deep above the current price. My cost basis for AMD is in the lower $90's, so getting assigned up there wouldn't be bad at all.
Good luck to everyone out there! 🍀
Feel free to send me some feedback about these posts. My Mastodon and Telegram links are at the top right.
Discussion