AMD end of the week recap

Let's look back at AMD's week as we head into a holiday week. It's been a wild ride. Could we see AMD hold $120 and grind higher?

What? Where did this post come from at the end of the day? Well, this week was a busy one for me and I couldn't make time for some analysis posts.
Don't fret! I'll try to make it up to you with a look back at AMD's moves this week and where it might be going next week.
All investments come with significant risks, including the loss of all capital. Please do your own research before investing, and never risk more than you are willing to lose. I hold no certifications or registrations with any financial entity.
Let's get to it.
Performance
No matter how you slice it, AMD has some excellent returns this year:

86% year to date is quite good, but the stock took a pretty good hit throughout 2022. Our quarterly, monthly and weekly highs are all lined up around $122.
Vanna
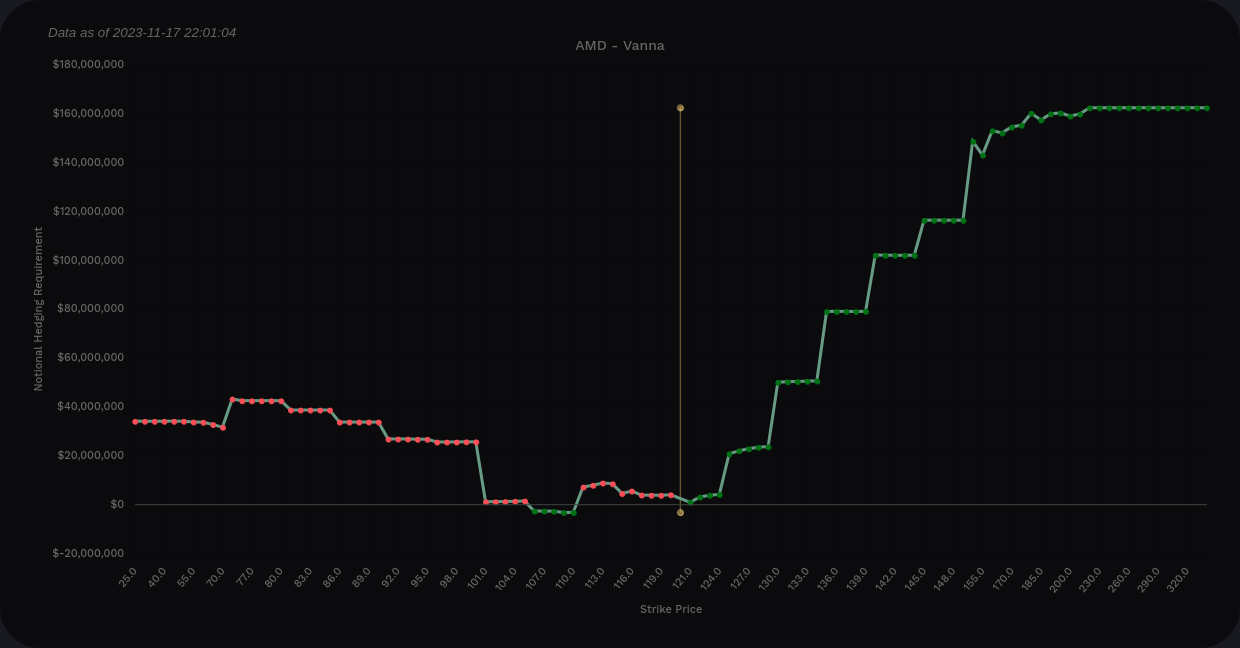
Let's take a look at the vanna for AMD across all expiration dates first. Be aware that these might slide around a bit after today's OPEX.
The curve looks excellent with tons of positive vanna above price and some below price as well. We have strong positive vanna levels running all the way to the highest bar at $150. Wow. It's been a while since we've seen that!
Each of these positive bars can become a magnet for price if implied volatility (IV) remains low or heads lower. However, this is an ugly vanna chart if we somehow get an IV spike over the next few weeks. We might get some support at $110 and $100, but it's dicey below that area.
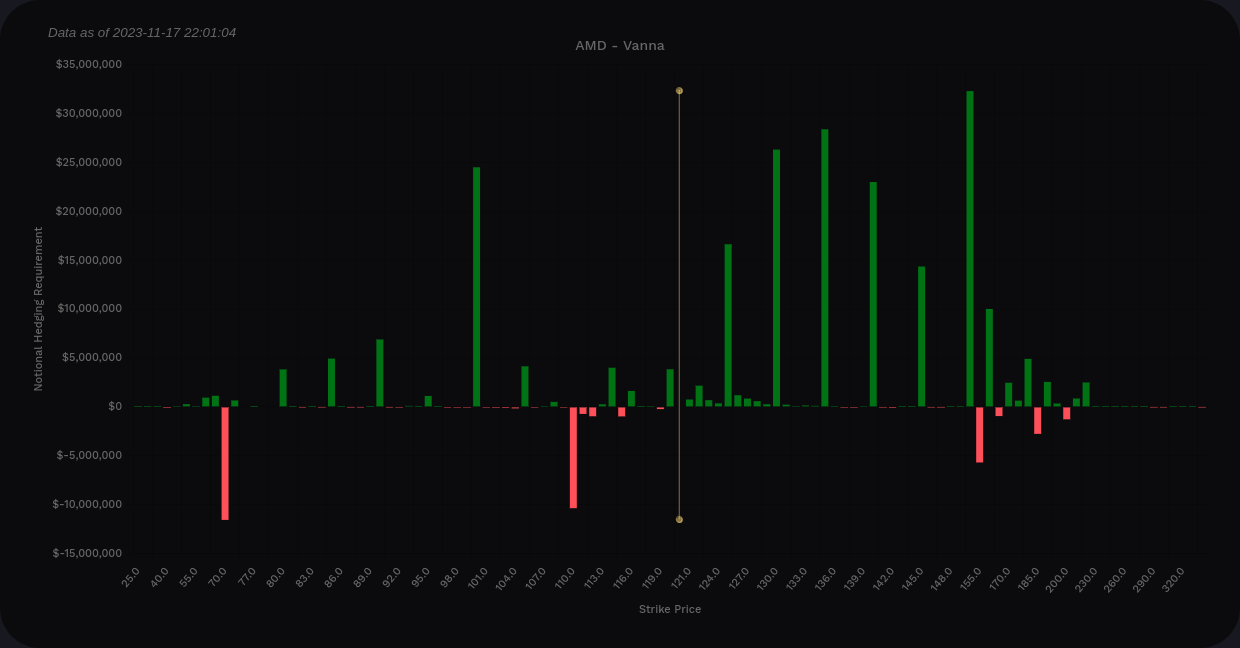
AMD vanna across all expiration dates
I'm doing most of my trades with 45 DTE in mind and that means I'm focused on 12/29 for now. If I cut down the vanna look to now through 12/29 only, here's what we end up with:
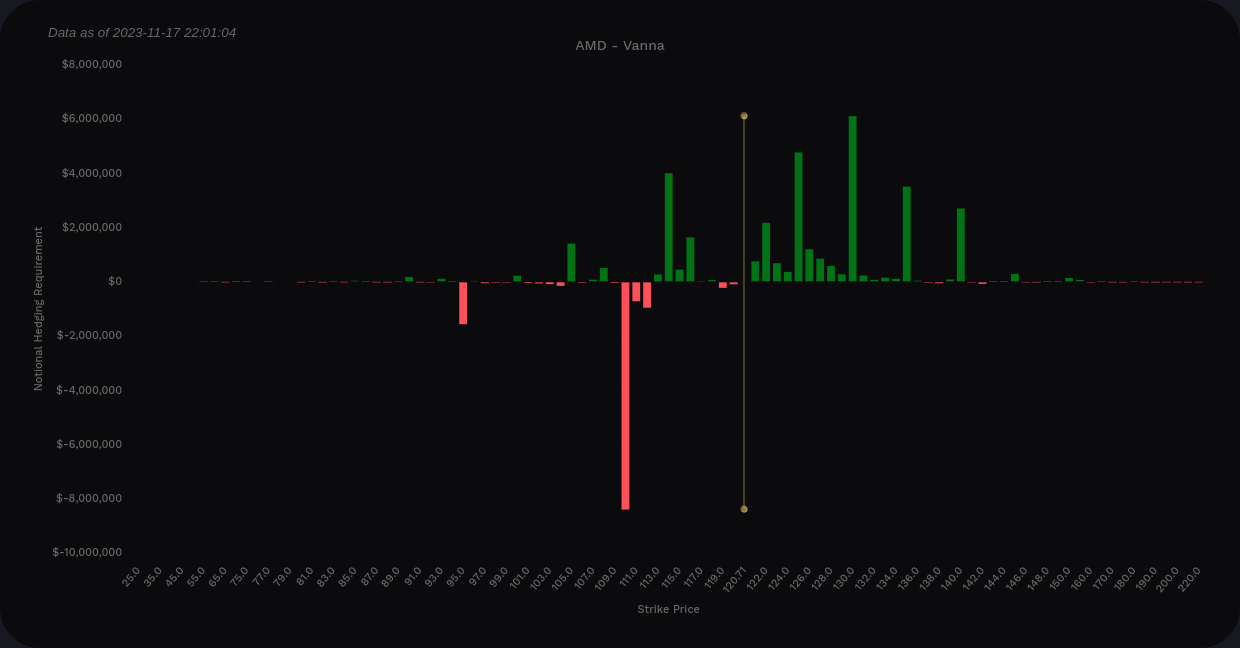
$130 is our tallest positive bar above price and a likely target if we can hold $120. There's some downside support at $114 but not much to help us below that level.
Gamma
Let's get a look at Volland's DAG (delta-adjusted gamma). DAG charts are helpful because the gamma above the current price is flipped. This means you can use a simpler method of "green means dealers buy and red means dealers sell" to interpret the chart.
$120 and $110 stand out as areas where price will find some support from dealers if it makes its way down there. However, we have some strong selling pressure above the current price at the big vanna levels that tapers off as we approach $150.
This leads me to think that breaking $125 will be difficult, but $130 gets a little easier. $135 is easier than that, and so on. The more levels that AMD can climb over and hold, the easier it is to continue moving up.
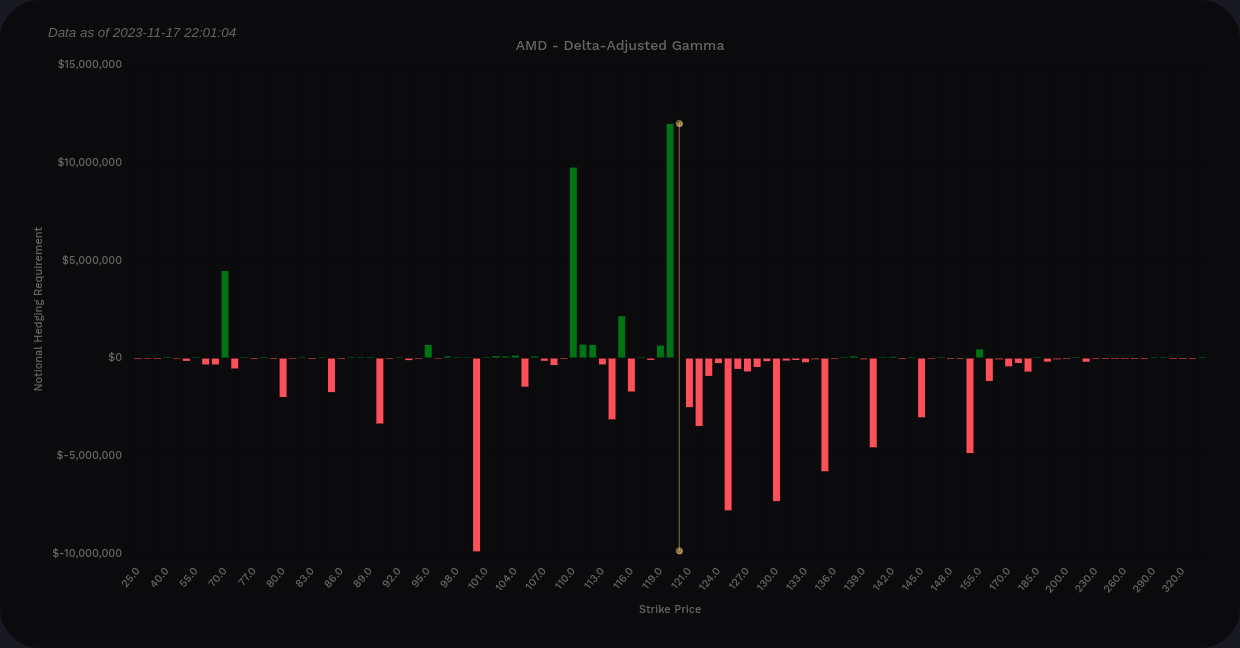
As for the downside, if we lose $100, it could get ugly. Dealers could end up accelerating the move down and there's not much gamma or vanna to slow down that momentum. That would require a 15-20% drop in AMD to reach those levels.
Institutional trades
I use Volume Leaders to get charts and alerts on big institutional trades when they happen. This tool doesn't tell you which way the traders are leaning. That's left up to you to infer based on everything else you can find. However, it does give you hints on when to go looking for that information.
The chart below has bubbles that are sized based on the size of the institutional trade. You can match them up with the yellow details block on the left. AMD had two top 100 trades this week (trades that are big enough to rank in the list of 100 biggest trades since AMD started trading):
- Tuesday was #52 with 2.91M shares at $119.88
- Thursday was #22 with 3.87M shares at $119.83

Again, we don't know directionality here. I could make a case either way.
Bull case. AMD has positive vanna above the current price and plenty of it. Both of these trades came in around the same price level where AMD has struggled many times. AMD traded up through these trades twice, too.
Bear case. AMD has struggled with $120 for a long time and now could be a good time for a trader to take profits and load up on the next pullback or correction. I could also add up a couple of these large trades and they equal the #22 trade, so perhaps an institution decided to take profits.
Perhaps the chart can tell us more?
Charts
Let's kick things off with a weekly chart first and then zoom into a daily.
🐂 We have two weeks in a row where our Heikin Ashi (HA) candles have no bottom wicks. If we get a third one of these next week, that's a sign of a strong rally.
🤷♂️ The green line on the Ichimoku cloud is in a weird spot because we want to see that above price to be bullish. Also, the red base line is above the blue conversion line. That's not ideal. These aren't bearish for the moment but they're worth watching.
🐂 The cloud is currently green and price is above the cloud.
🐂 The MACD is still above zero and the fast line is just about to cross over the slow line. The histogram turned green by a tiny amount.
🐂 On-balance volume suggests the volume is matching with this rally. If we see price go up and OBV begins to sag, we should be concerned.
🐂 The RSI channel is up a bit from the bottom and we have room to climb higher before we reach an overbought state.

So far, the weekly has mostly bullish data but the Ichimoku cloud is raising some questions about strength. How about the daily?
🤷♂️ The HA candles are a little spooky here. We had 10 straight days of HA candles with no bottom wicks. That's incredible. That also means everyone likely needs to catch their breath on this rally and we might consolidate for a while. After a couple of dojis, we caught another bullish HA candle today.
🐂 The Ichimoku cloud ticks almost all of the bullish boxes. Green line is above price, blue is above red, and price is well over the cloud. However, the cloud is red for the moment. I'm starting to see that change, but it's a good thing to watch.
🐂 MACD remains positive but the slow line is catching up to the fast one (the histogram is shrinking). AMD needs to get a move on to keep that fast line moving up.
🐂 On balance volume sagged a bit Wednesday and Thursday but recovered today. If it sags again while price moves up, I'll be more concerned.
😬 RSI shows us in overbought territory and we're also slammed into the top of the channel. These two days of indecision allowed the RSI to recover a little and that's a healthy market motion. I don't think of this as bearish, but I am watching OBV and the candles for a sign of a turn.

One of my favorite people is Chris Ciovacco (he has an awesome YouTube channel) because he finds ways to dig up more data about indexes and individual equities with useful comparisons. Let's get a look at some AMD comparisons here.
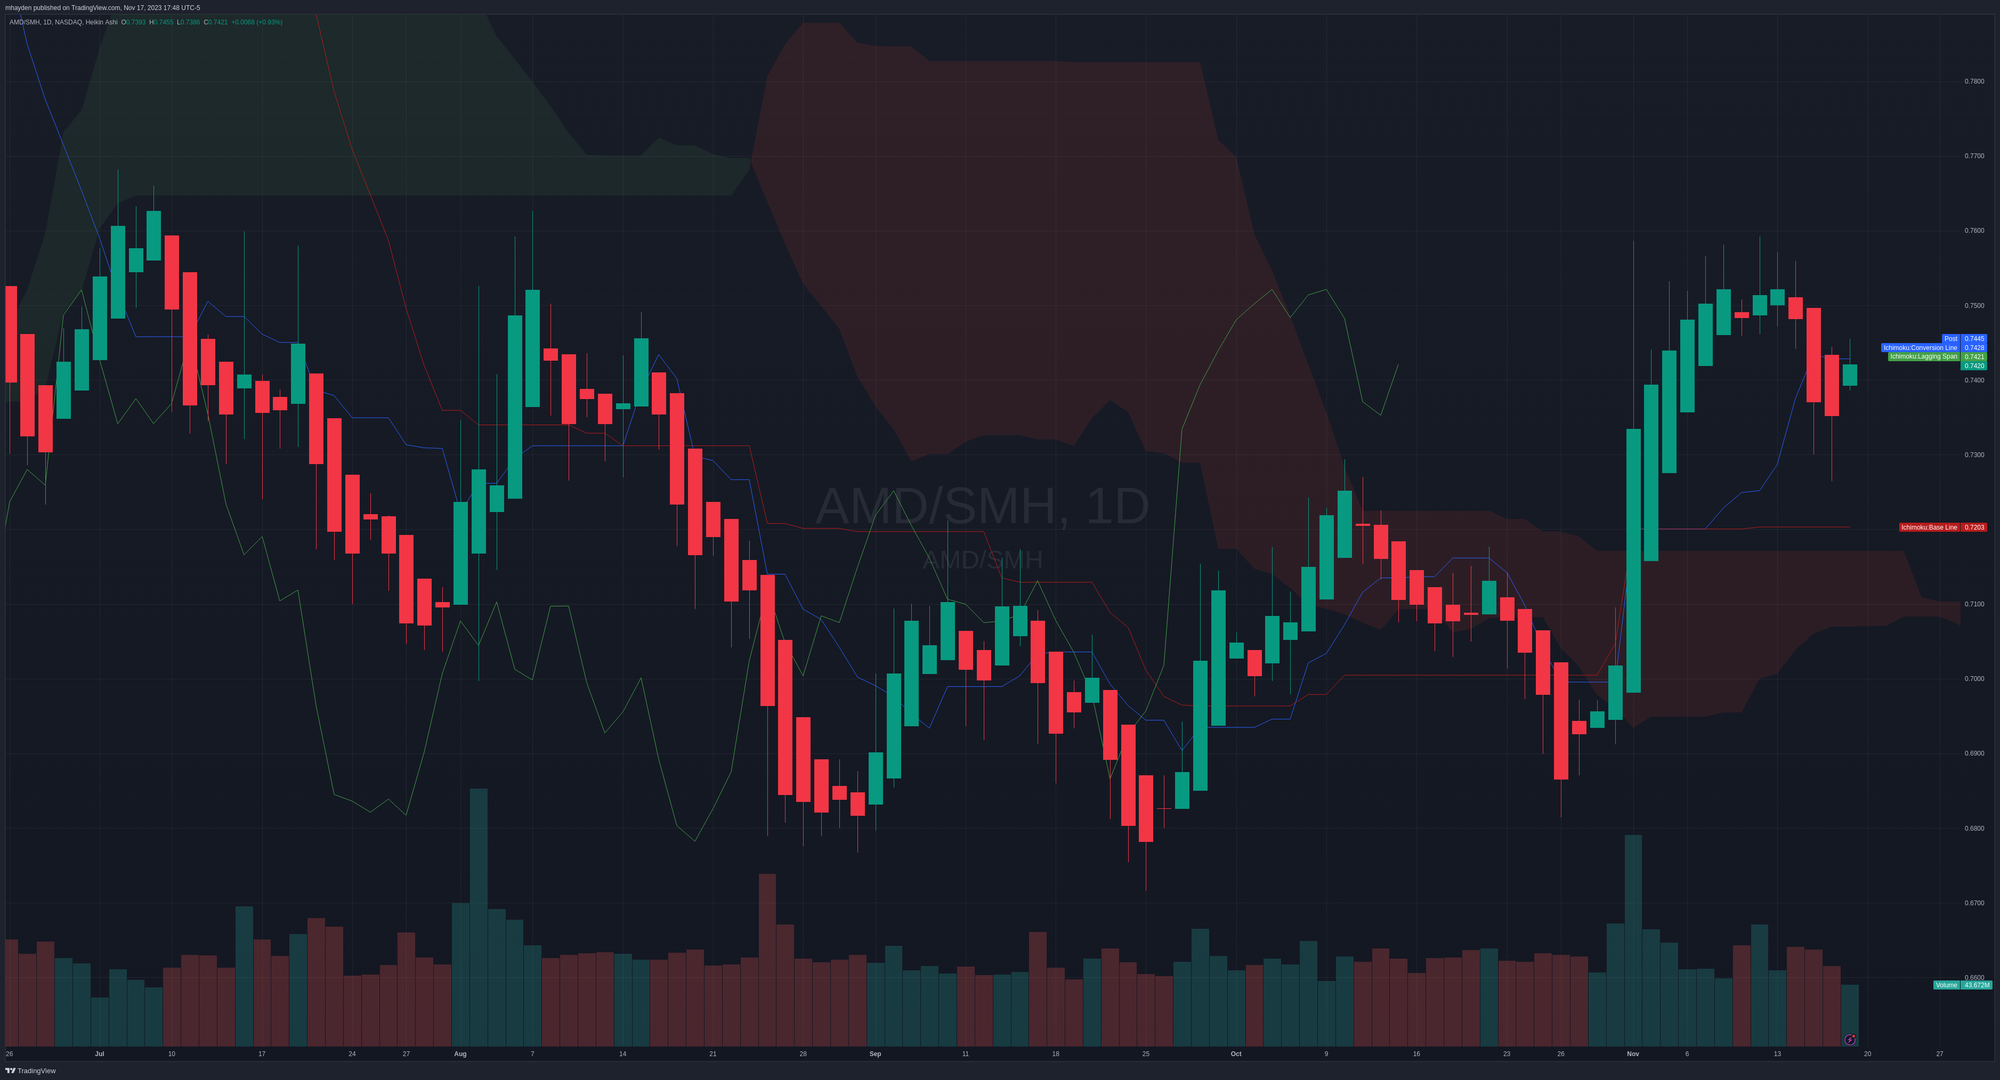
First up is AMD versus SMH, the semiconductor ETF. The little bit of indecision this week looks a bit more concerning here since AMD's relative performance dipped more relative to SMH's dip.
How about AMD versus NVDA? AMD lost a little ground to NVDA this week, but it was more of a slow slide than a drop.

AMD and INTC? INTC had one heck of a week and it gained back some ground on AMD.
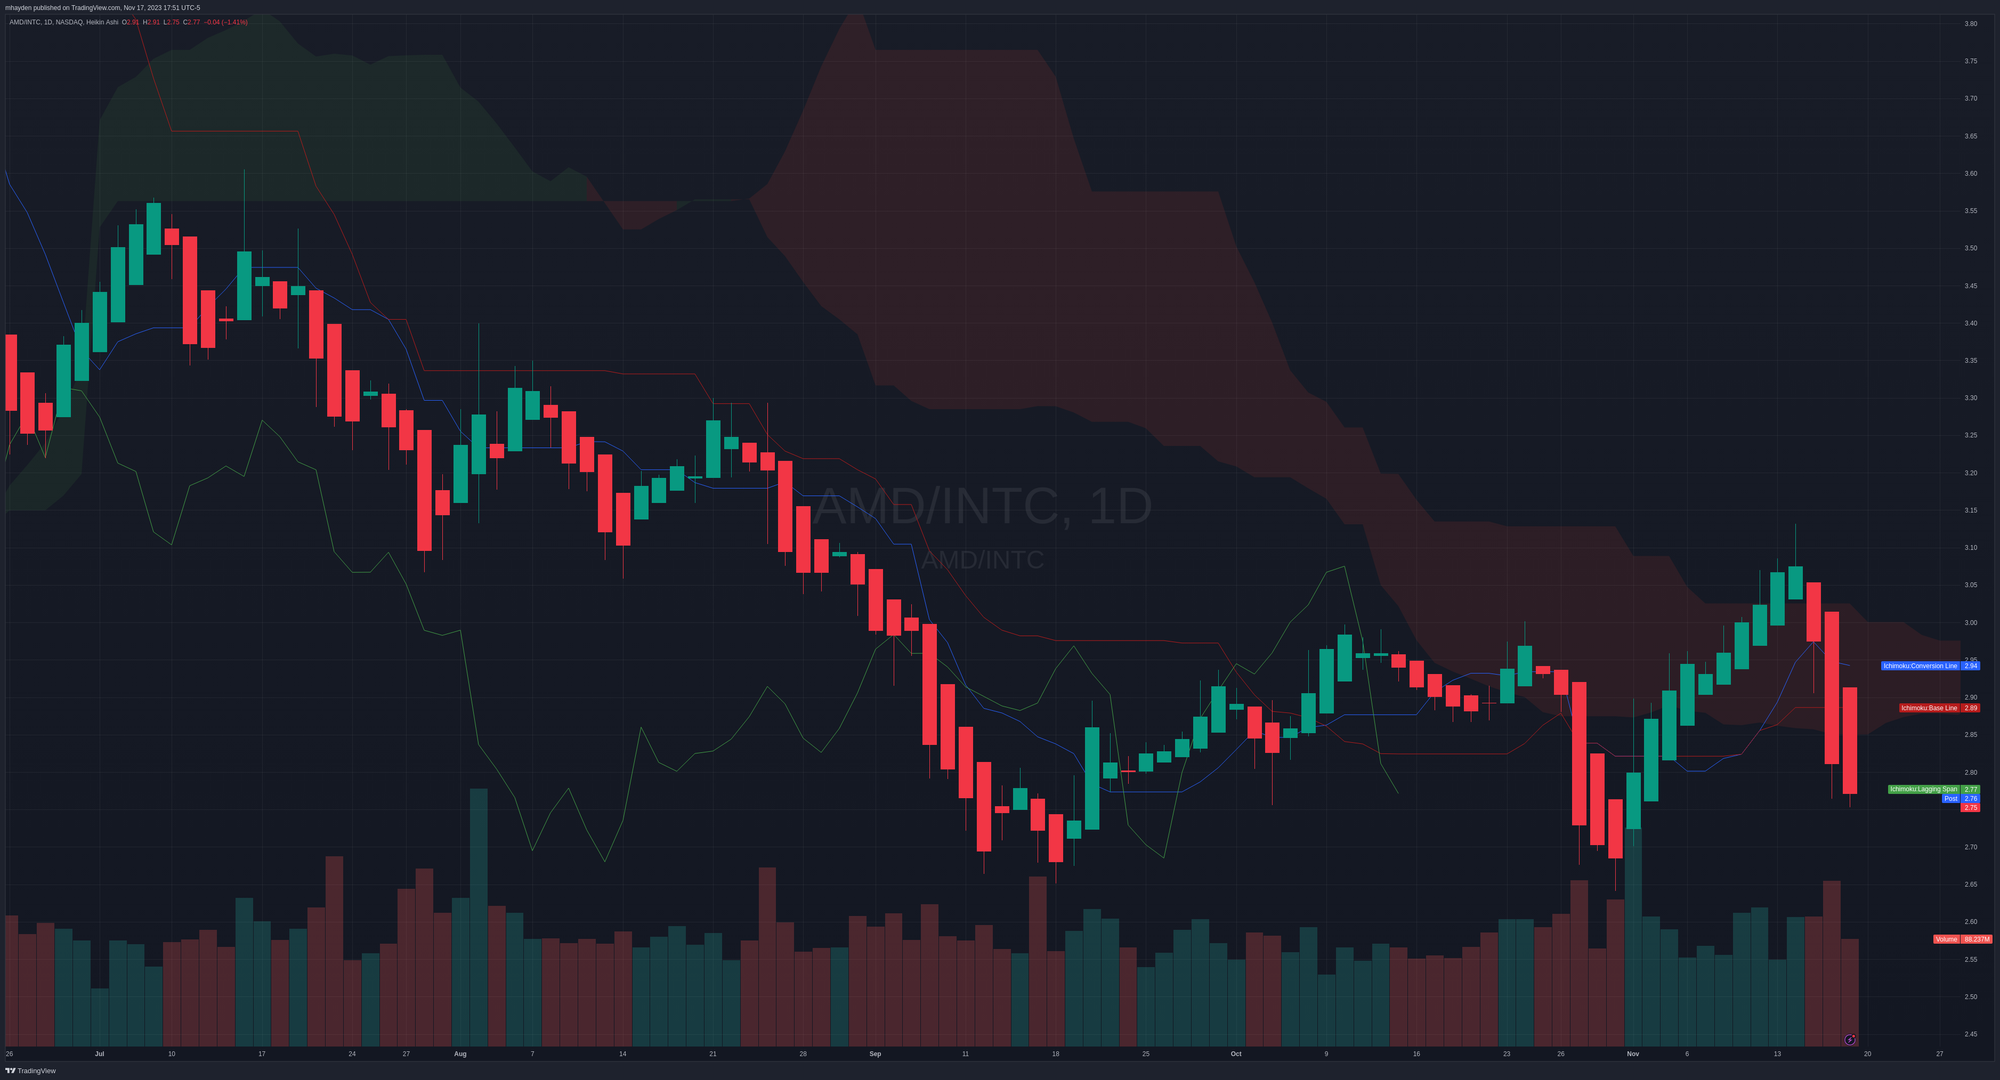
So the big takeaway from these comparisons is that AMD's rally gained ground on its competitors, but not as much on NVDA. Also, the rest of the semiconductor market kept moving ahead while AMD stumbled mid-week. If this becomes a longer trend, it could be a concern, but I'm not too worried yet.
Thesis
AMD's real test right now is holding $120. It has run up there and fallen back multiple times since the all time highs in the $160s. It sits just over $120 after hours today and that's certainly a good sign. Next week has the possibility of a low volume week and that could be good for AMD as it needs to consolidate for a potential move higher.
If we did retrace some, I'm trading the $110 level as a potential support level. I sold some puts in the $107-$110 range for 12/29 as it's the closest expiry to 45 DTE right now. My long shares are covered with calls from $110-$120 through 12/15 and I'd be glad to long in my long stock profits going into Christmas. 👏
I'm doubtful about AMD making it past $130 before 12/15, so I've sold two calls at $135 for 12/15.
I hope you have a great weekend. 🌴
Happy Thanksgiving to everyone in the USA this week. I'm incredibly thankful for all of the people who have taught me valuable lessons about finance and investing over the past three years. The market has taught me plenty of lessons as well. 🤭 🦃 🫂
Discussion