Post-holidays AMD analysis for January 2
Will AMD keep its holiday rally going or are we looking to retest some older levels?

I'm back after a long holiday break! Although I was still making trades through the holidays, I took a break from making posts. Look for a post soon about lessons learned in 2023. 😉
All investments come with significant risks, including the loss of all capital. Please do your own research before investing, and never risk more than you are willing to lose. I hold no certifications or registrations with any financial entity.
Let's dig into AMD's latest data today and make some predictions about where it might be going. Most of my profits came from AMD last year and I'm looking to see if I can do a repeat in 2024. 💪
Vanna
AMD's vanna leans slightly negative on the aggregate right now, which gives it a slight bearish tilt.
The curve shows plenty of positive gamma ahead of the current price, especially at $150. Weak positive vanna lines run all the way up to $220 here but I'd like to see those rise before I bet on a run higher than $150.
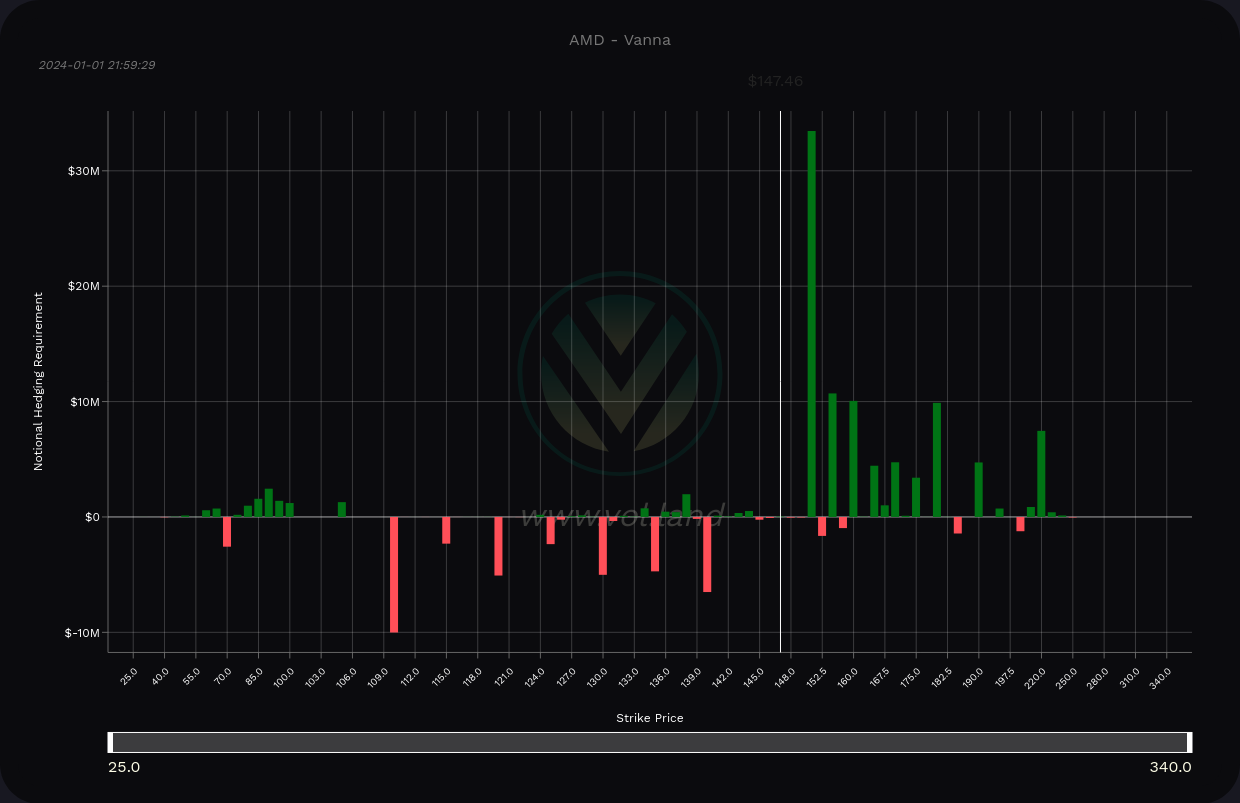
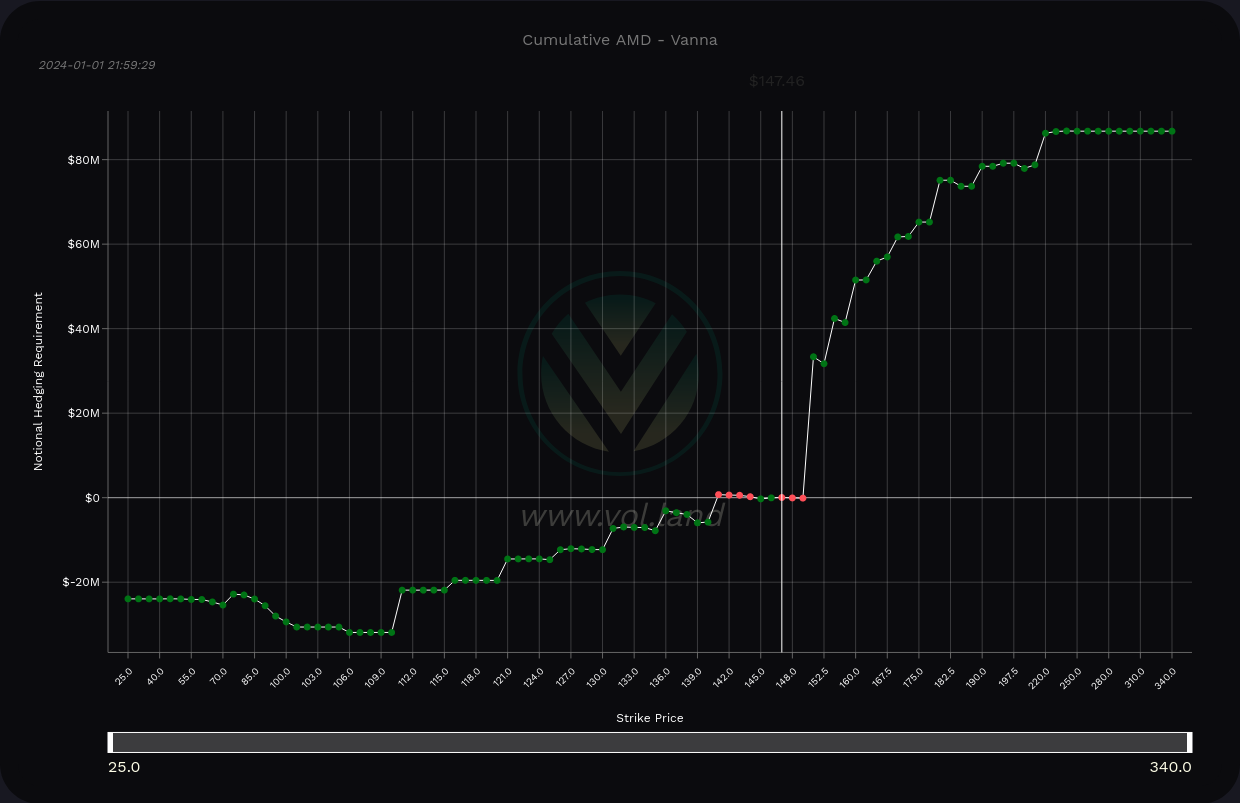
AMD vanna across all expiration dates
To the downside, we have light negative vanna which may repel price. This starts around $140 and runs down to $110 on $5 increments. $110 is the largest of those lines.
Most of my trades are focused on 30-60 DTE and the February OPEX sits right in the middle of that range. Let's get a look at AMD's vanna through 2/16 only:
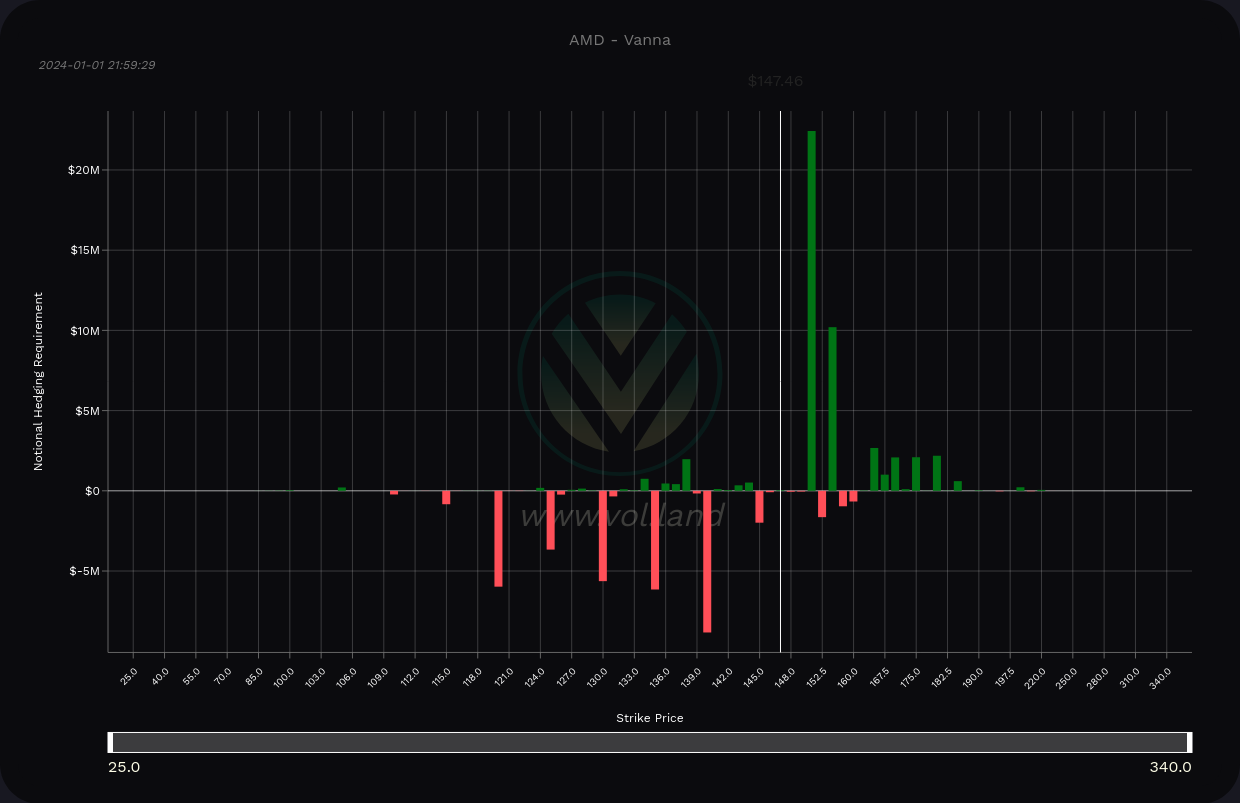
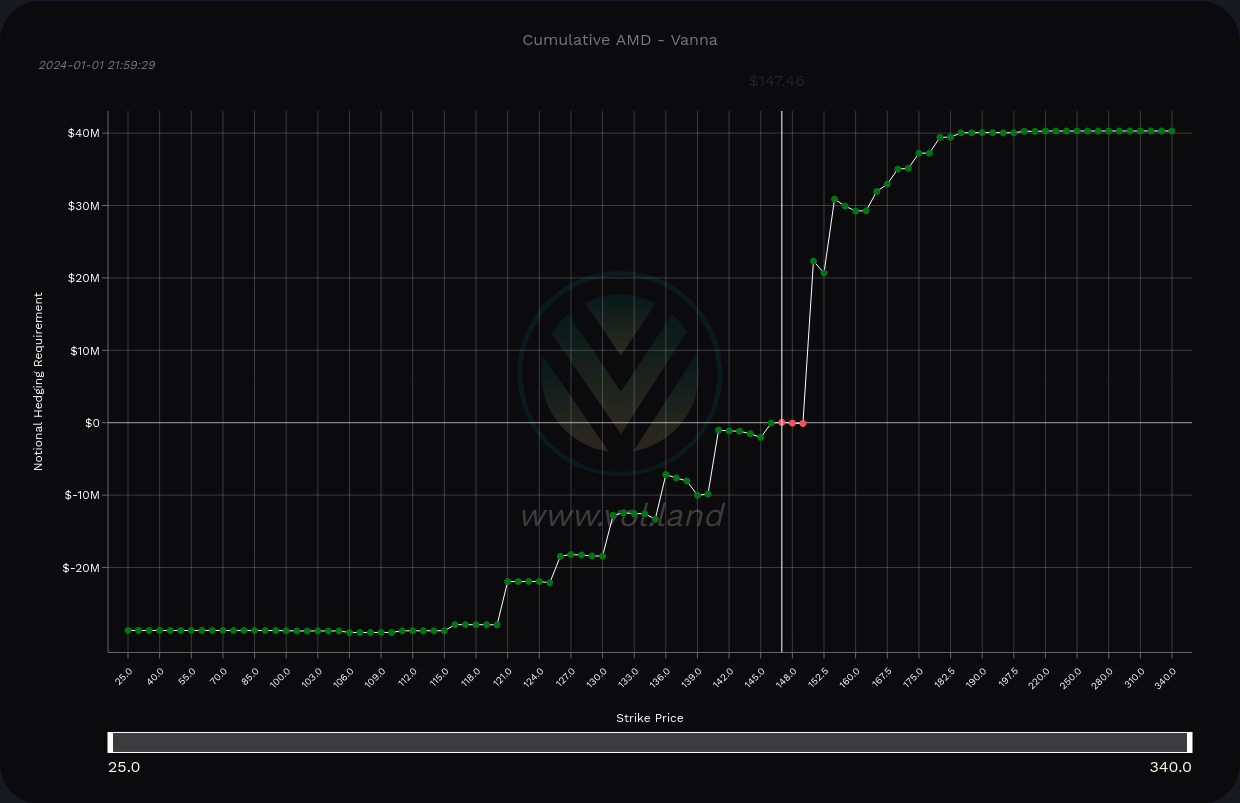
AMD vanna through 2/16 only
This looks less bullish than the overall picture, but it's still leaning bullish. $150 shows up as a big target with $155 being about half that size. The downside has negative vanna levels down to $120 on $5 increments and most of these look like short calls.
Institutional trades
VolumeLeaders shows that institutions are nibbling on AMD stock and have been since the October lows. As a reminder, this tool does not show directionality of trades, but it does show the relative size of those trades. For example, the most recent trade is the 40th biggest of AMD's trades since it began trading.

As I look at lots of tickers on VolumeLeaders, I notice a pattern of institutions nibbling on a stock as it keeps trading through levels. Eventually, they make a big trade (such as the December #4 trade above) that precedes a reversal.
However, even after some big trades in AMD, institutions keep making trades. They could be taking profits or they could be adding more to their position.
Charts
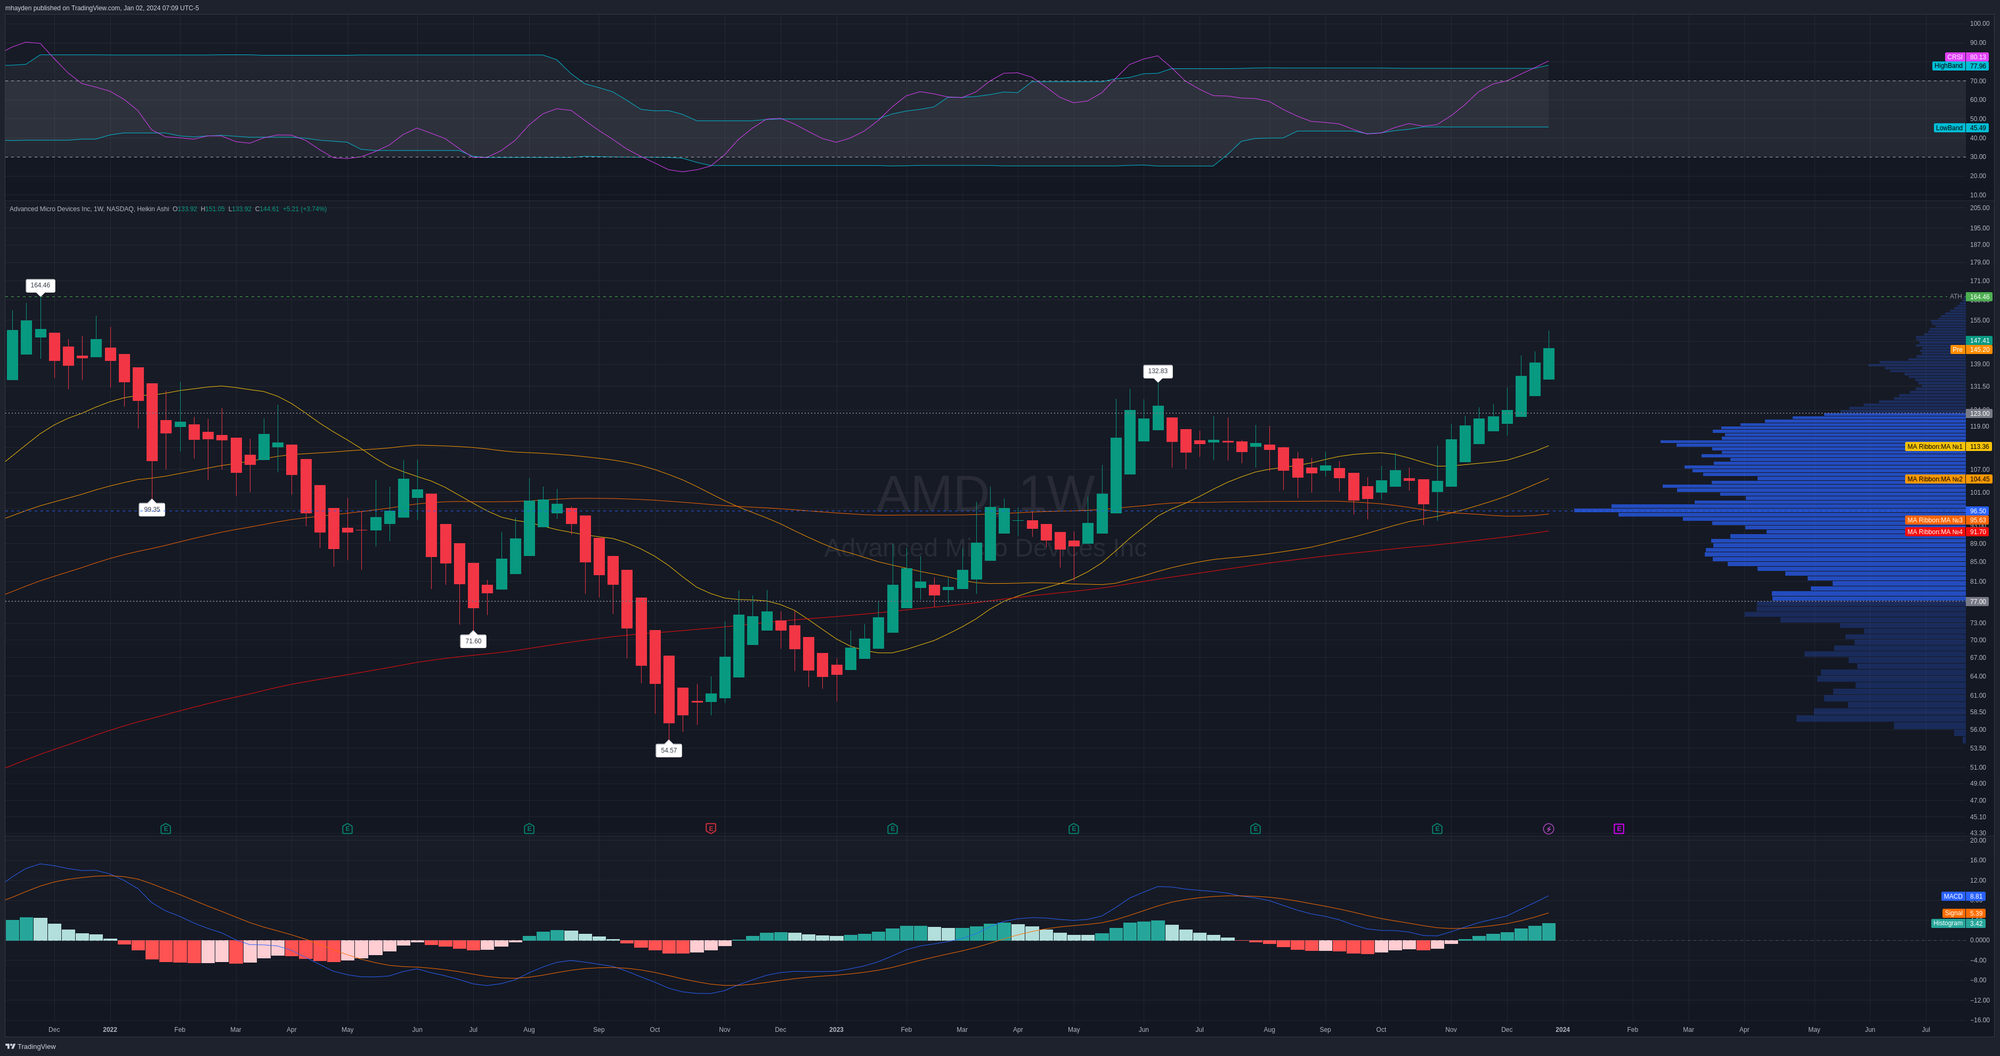
Let's start with AMD's weekly chart and run top to bottom:
- The channel RSI indicator shows that we're fairly overbought on the weekly time frame and we've broken out of the top end of the channel. AMD does this occasionally and it can hang out well above 80% RSI for a while.
- Of the last 8 Heikin Ashi (HA) candles, 7 of them are bullish with no bottom wicks. That's a sign of a strong, sustained rally.
- Moving averages are now properly stacked from top to bottom (20, 50, 100, and 200 weeks). This is a bullish sign, especially as the 200 week moving average has been positive throughout 2023.
- $96.50 is the biggest volume level since the all time high and 70% of the volume appears between $123 and $77. We're running over that range right now and $138-$139 is our highest nearby volume level.
- The weekly MACD has a rising histogram and both lines are over zero. This is a classic bullish setup.
Thesis
AMD had one heck of a 2023 with gains of over 120%:

As I said before, I made plenty of profits selling puts on AMD throughout the year. My covered calls weren't great, but they helped me lock in some profits.
AMD now sits within $20 of its all time high at $164.46 and it's perched well above most familiar volume levels. Long story short: we're in uncharted territory.
Vanna suggests we could pull higher to $150 and beyond, but that looks doubtful by February's OPEX. The vanna lines above $150 are relatively small and haven't been growing lately.
However, vanna only tells half the story. Institutions are actively making large trades in AMD and its chart shows real strength via multiple indicators. AMD's next big test is $150. If it can break that level and sustain it, we could see another run, possibly to an all-time high. However, increasing volatility will not be friendly to AMD's price.
I've used my ThinkOrSwim scanner to find the best return on risk trades for AMD lately and I have a few trades on the board:
- 2x 2/2 $132p
- 2x 2/16 $130p
- 1x 2/16 $165c
- 100 shares @ $137.88
Good luck to all of you this year. I hope your 2024 the best year yet for you and your family. 🍀


Discussion