AMD options analysis for 9/18

AMD's price pressure cooker has the lid on tight through earnings. A breakout certainly would be nice, but trading a range can be fun, too. 😉

Happy Monday! 🌄 If you missed my latest installment of Charts and Coffee yesterday, head over there and read up on my thoughts about AMD's weekly chart. Options analysis is quite useful, but it can become more powerful when you compare it with the price action on the chart.
Here's a short recap: AMD looks trapped between some big VWAP levels coming up from the January 2023 pivot and down from the recent high in June. It needs to pick one of these to break out of as it's been stuck in a really indecisive pattern for 13 weeks. The overall recent trend is a slow drift downwards, but now AMD finds itself directly in the center of two big VWAP lines that are coming closer together.
All investments come with significant risks, including the loss of all capital. Please do your own research before investing, and never risk more than you are willing to lose. I hold no certifications or registrations with any financial entity.
Let's get underway!
Options flow
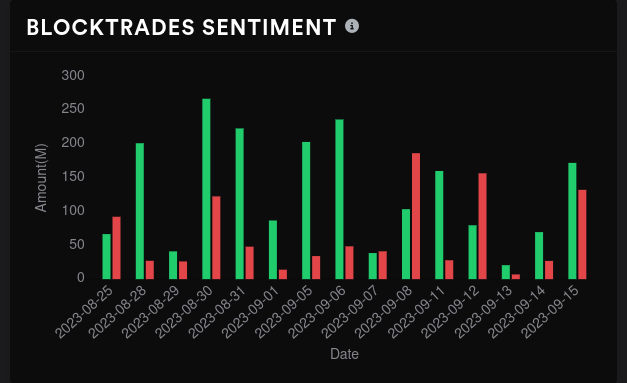
This is usually my first stop because I like to know the general momentum of options traders right now. Bear in mind that Friday was a quadruple witching quarterly options expiration and wild stuff usually happens on those days.
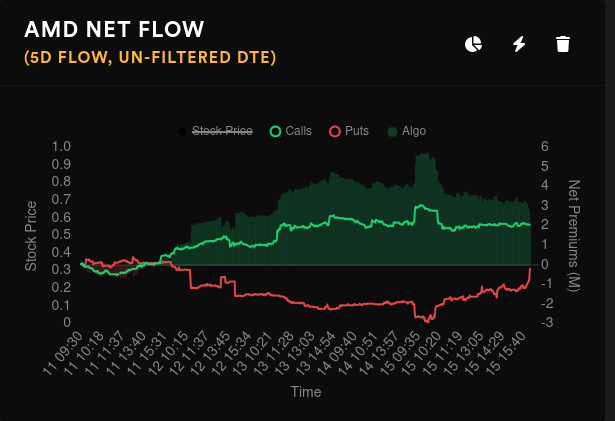
Friday's flow went into a bearish split fairly early and held there for most of the day. The five day flow still looks bullish, but the gap between the lines is fairly small. I much prefer to trade in those situations where the gaps between these lines are at least 5-10M but we're around 2M right now.
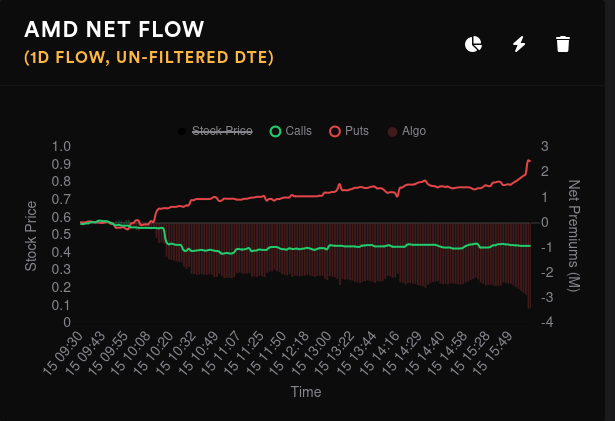
Friday's options volume and open interest for AMD increased drastically, but that's to be expected on quarterly expirations. Much of Friday's volume came from selling of calls and these look like mostly new sales. Most of these sold calls expired on Friday (0 DTE trades).
Friday saw only one block of calls bought above the asking price and those were at $165 for 2024-06-21. There were some smaller blocks of long puts but they're not large enough to be concerned about. Some sold put sweeps showed up for 9/22 at $102.
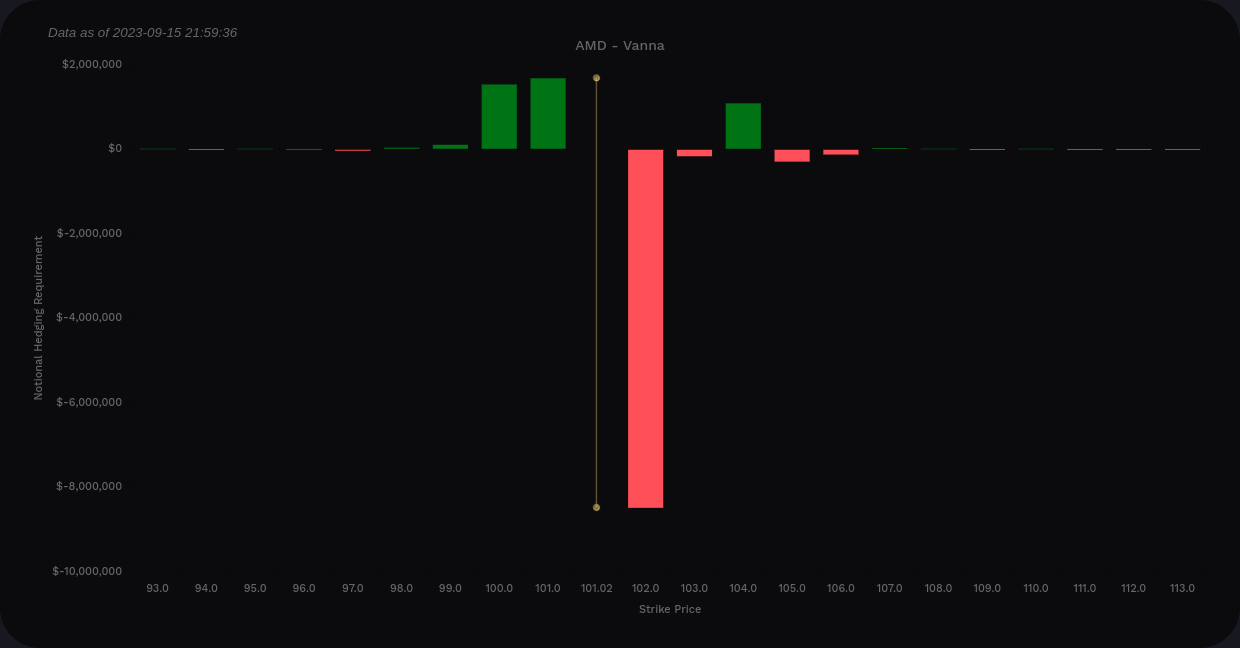
Vanna
AMD's aggregate vanna is positive, but there's a spot of negative gamma just above the current price at $105. The biggest magnet for price is clearly $110. Below the current price, we have some small positive lines at $100 and $90, but I wouldn't count on those to help us that much if we head to the downside this week.
If IV contracts this week, $110 could be a magnet for price. However, we would need to get a boost over $105 to make it there.
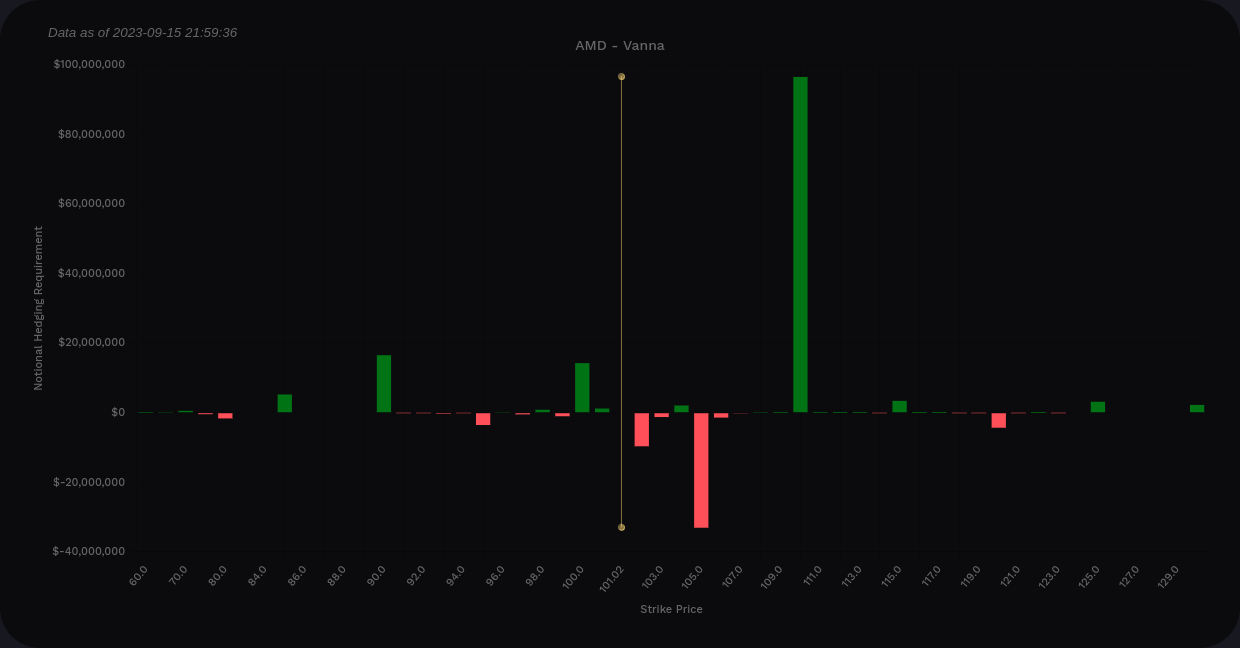
9/22's vanna is mostly negative (by around 2x). $102 will hinder upward price movement this week.
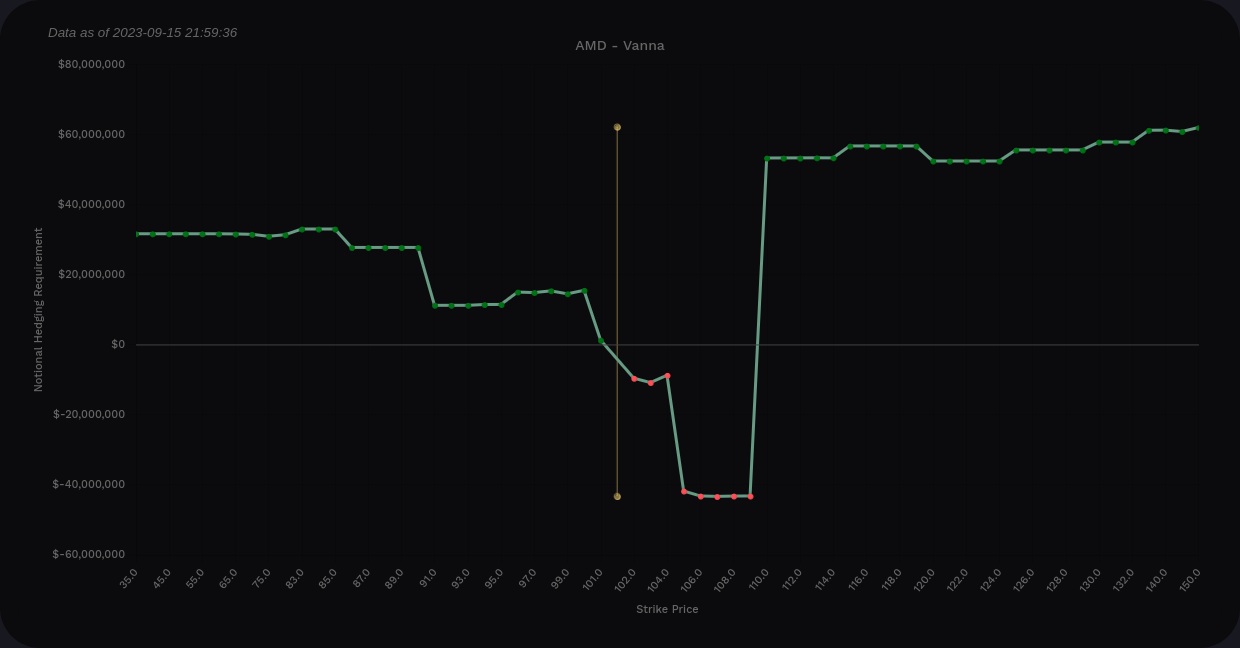
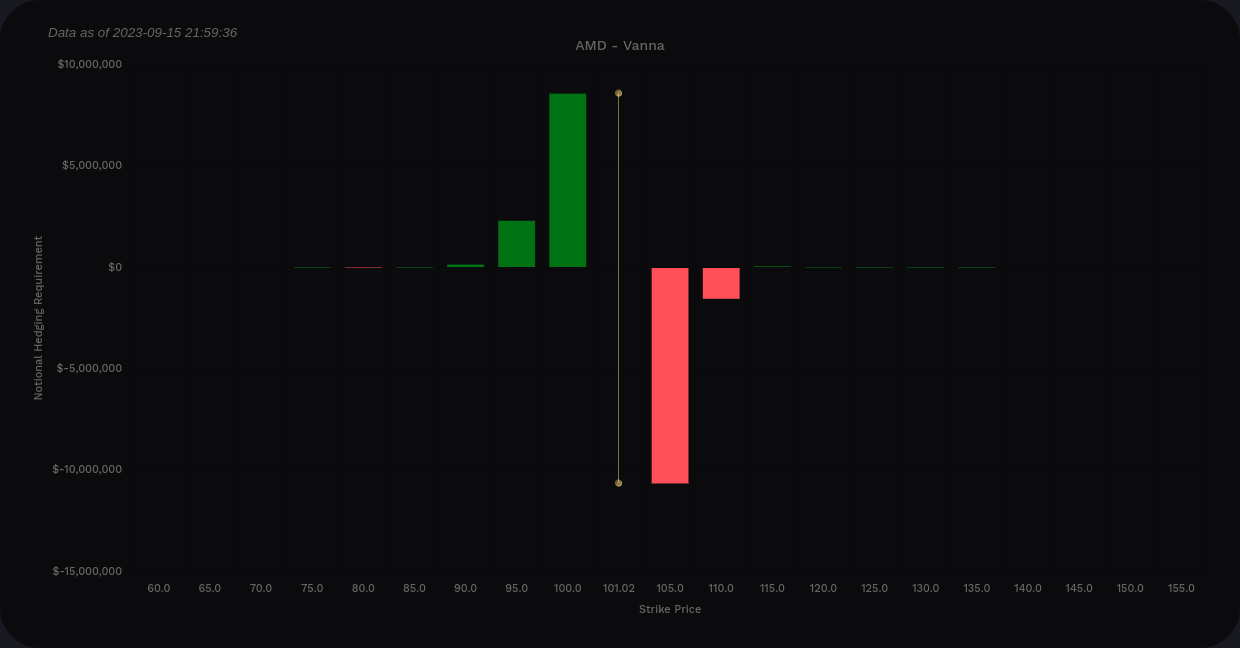
10/20 gives me a feeling that we're pinned into a tight range for a bit longer:
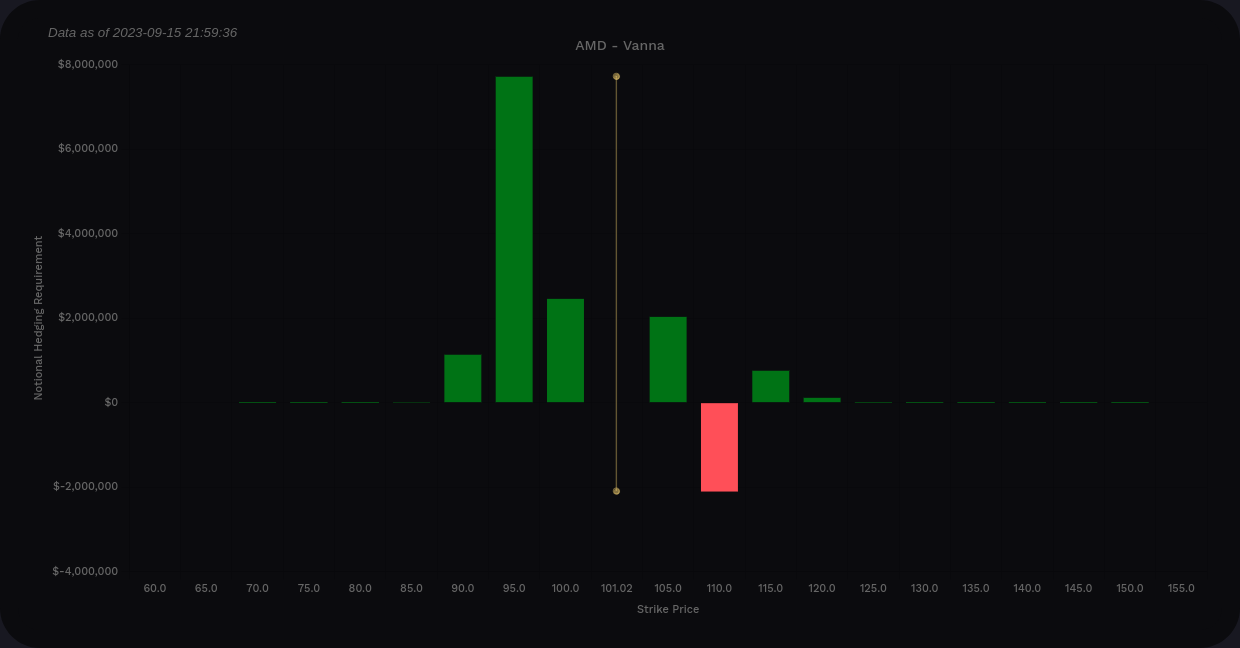
But then we're back to positive vanna for 11/17. I'd like to see more positive vanna above the current price, but this is generally bullish. Remember that AMD has earnings on 10/31! 🎃
Gamma exposure
AMD's GEX seems to be piled up into 9/22, 9/29 and 11/17. I'll check GEX charts for those expiration dates.

AMD's GEX for 9/22 still shows $110 as the price target with a big resistance level at $107.

Resistance levels take over the chart for 9/29. That's a ton of positive gamma. Wow. $115 is the price target here with $106 as a secondary target. The biggest resistance zone seems to be around $99-$102. That matches up with what I was seeing on the weekly charts.

AMD's 11/17 GEX falls after earnings and it looks like resistance fades away here. $125 is a fairly clear magnet for price, but this is still quite far out.

Other options data
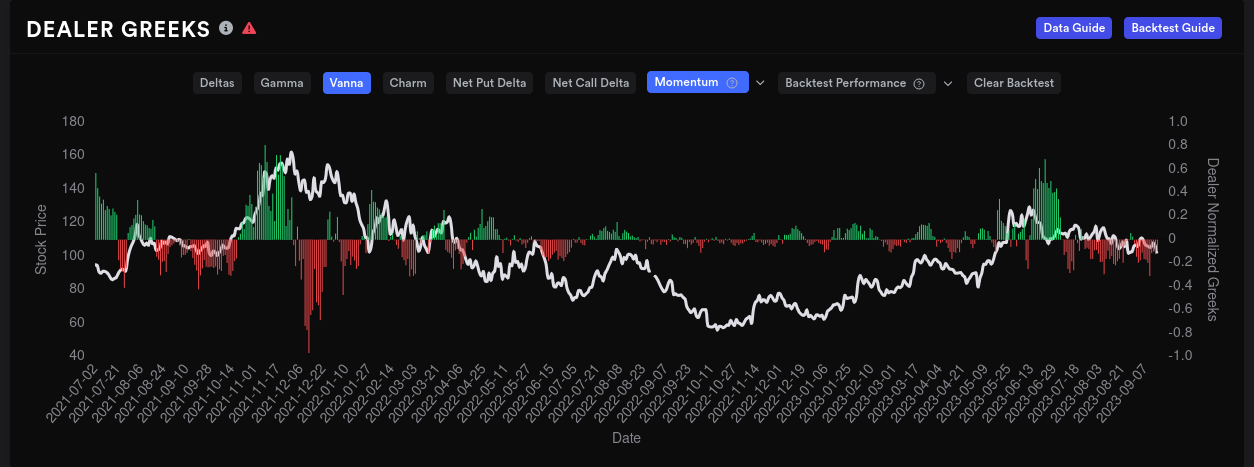
Dealers are still net short on AMD over a 15 day momentum and that suggests customers are long. Remember, this is a look at dealers, so you must reverse everything to get to customer positioning. Red on this chart means customers are likely net long while green means customers are likely net short.

Vanna buildup is the opposite. Red is bearish on this chart and green is bullish. We've been mostly red for a while now, but it's quite light.
Whales
What are the big money options traders doing? Well, on aggregate, they've gone bananas for $100. It went bullish up to about 7M in premiums over last week. $110 is also beginning to lift off. However, some bearish bets on $105 are also showing up here.

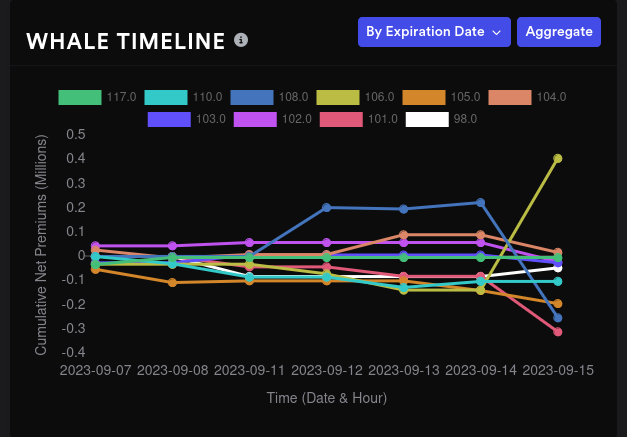
When are these bets showing up? 9/22 isn't clear, but 9/29 suggests that $106 is the most bearish strike. Premiums jumped for that strike on Friday:
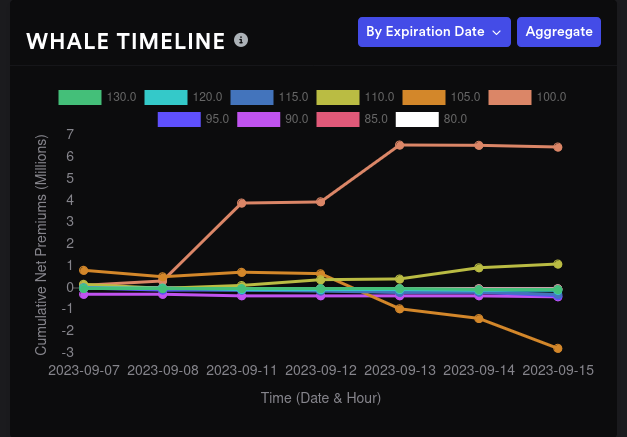
10/20 shows a bullish move for $100 as $105 drifts bearish:
Finally, 11/17 shows a strong move up for $110.

Dark pools
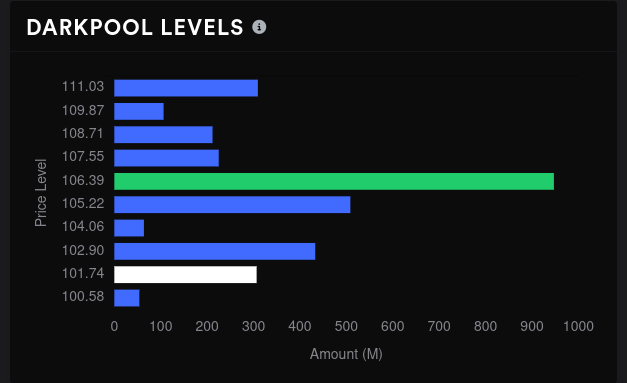
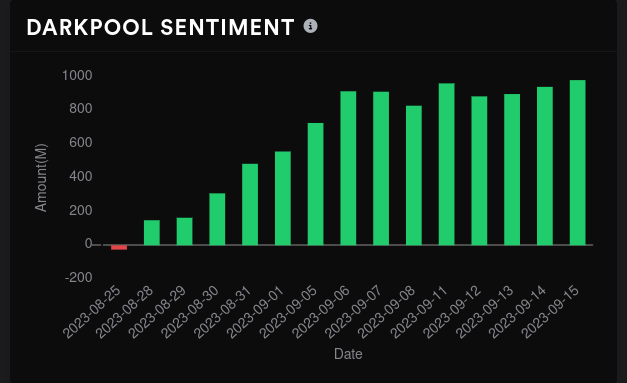
If you remember from Charts and Coffee yesterday, AMD's point of control for almost every time frame since late 2022 is $110. That's where the heaviest volume appeared on the chart.
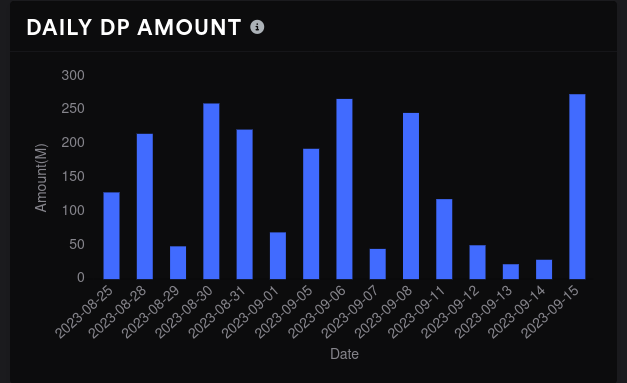
Friday saw massive dark pool volume for AMD that was net bullish. AMD's sentiment remains very bullish with the largest volume level around $106. Traders might be looking at this as a resistance zone since there are bearish moves at $105/$106 in upcoming expiration dates.
Volume is fairly light below $101 and we have support from some moving averages and a VWAP line there. Perhaps we will see price attract back to $106?
Thesis
AMD continues to bounce around in a zone where VWAPs are coming together to squeeze price. Options traders are making bets in both directions but they are keeping the strikes very tight. Breathing room seems to open up to $125 for 11/17 after earnings but there seems to be a lid on it until then:

This $100-$102 enticed me to sell some short-dated puts. I'd really like to see us make a run to $110 and I'll likely sell some shorter-dated covered calls around $110-$112 at that point. Tight ranges can make for fun trading, but just keep in mind that when a breakout does occur, it can be violent in either direction.
My cost basis for AMD is around $86 right now, so I have the freedom to sell covered calls aggressively if needed. AMD tends to burn me pretty badly when I do that, so I'll wait on that for now. I have short puts at $102/$104 for 9/22 and a $100 short put for 10/20.
Thanks for reading and good luck with your trades today! 🍀
Discussion