AMD options and stock analysis for September 7

Today's focus is AMD. 9/15 and 11/17 look to be critical expiration dates and AMD has earnings on October 31. 🎃

I'll be digging into AMD's stock and options data today since it's one of my largest holdings right now. It seems a little easier to do a report on a single ticker each day because I can get more focus on it and shorten the length of these posts. 😉
All investments come with significant risks, including the loss of all capital. Please do your own research before investing, and never risk more than you are willing to lose. I hold no certifications or registrations with any financial entity.
Let's go! 🚀
Vanna
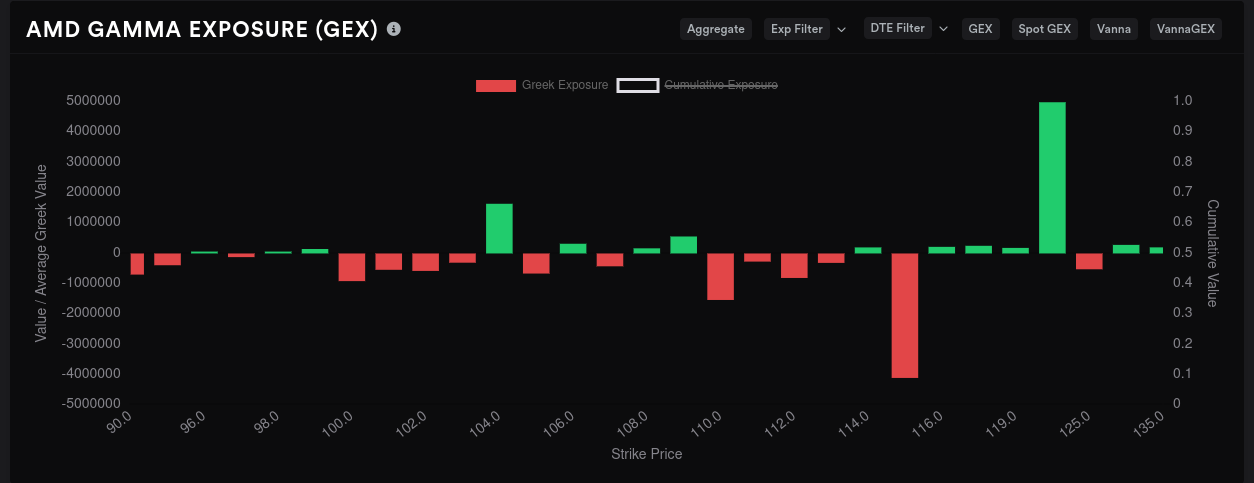
First up is the aggregate look at vanna across all expiration dates using data from Volland:
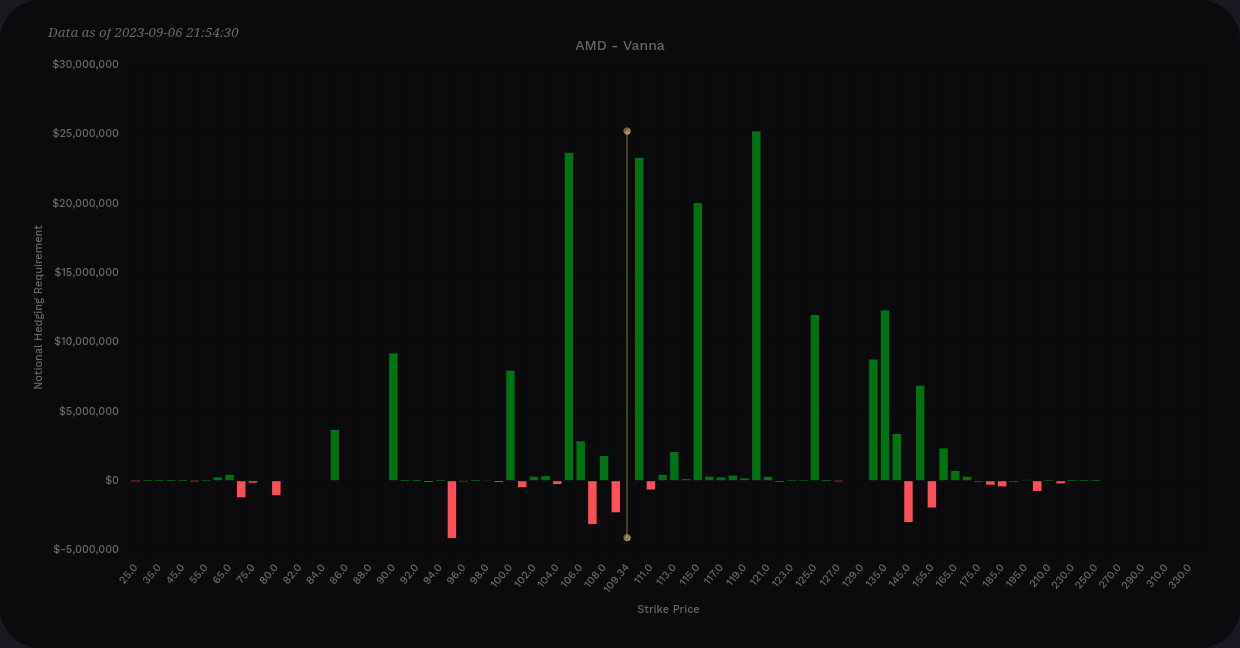
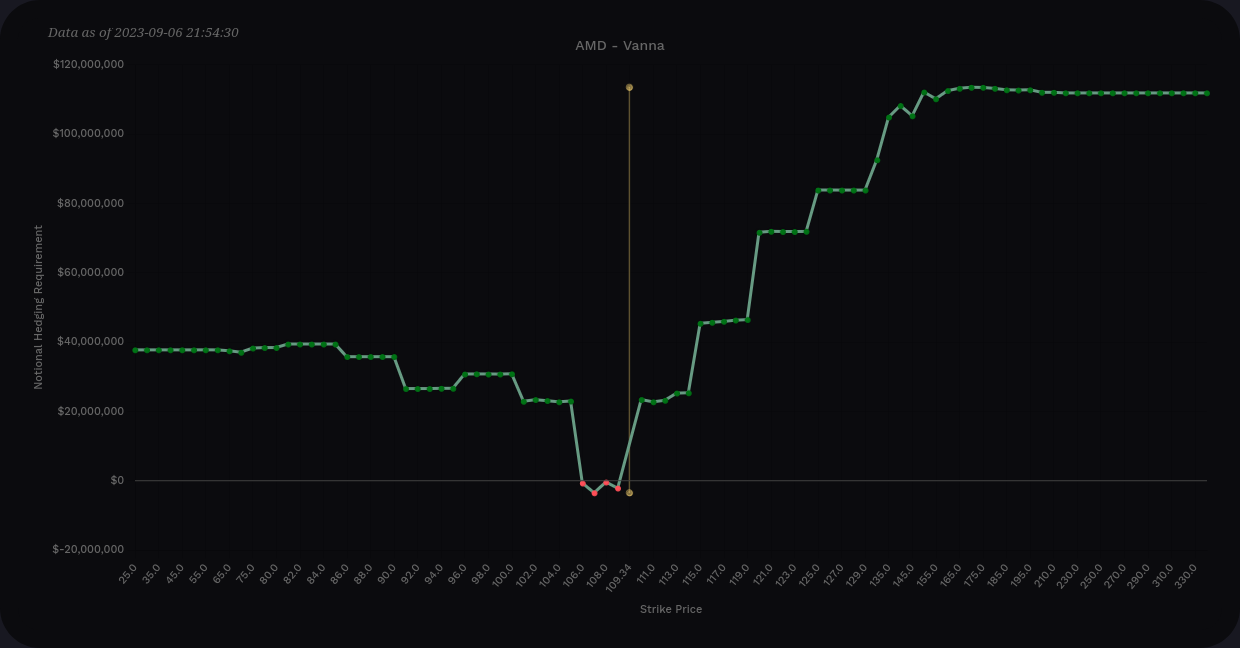
The curve shows that vanna is almost all positive across the board. That's bullish in an environment where IV is contracting or remaining steady. We also have more positive vanna above price which suggests we have some strikes where vanna could pull price higher.
The largest vanna bars run from $105 to $120 with some smaller bars creeping in at $125, $130, and $135.
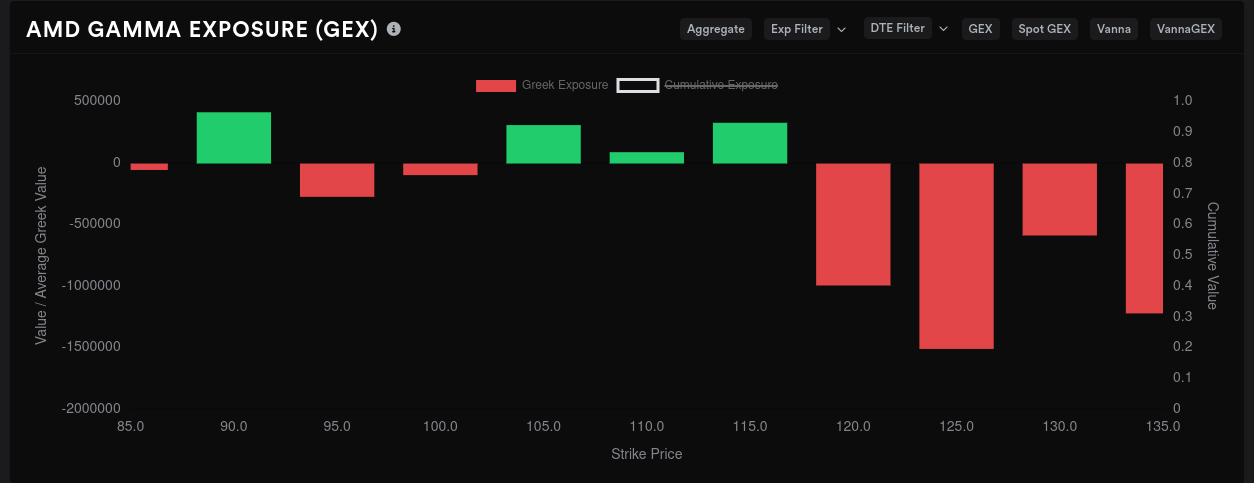
I'm trading AMD mainly through 10/20 right now, so let's get a look at AMD"s vanna through that expiration only:
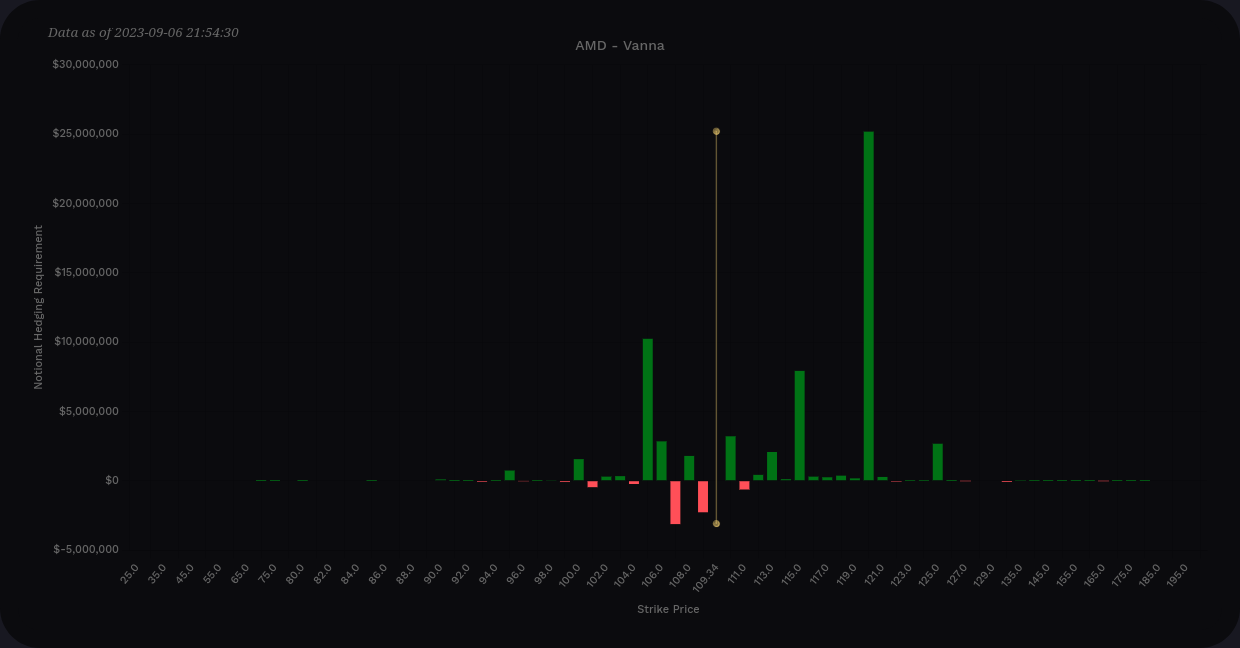
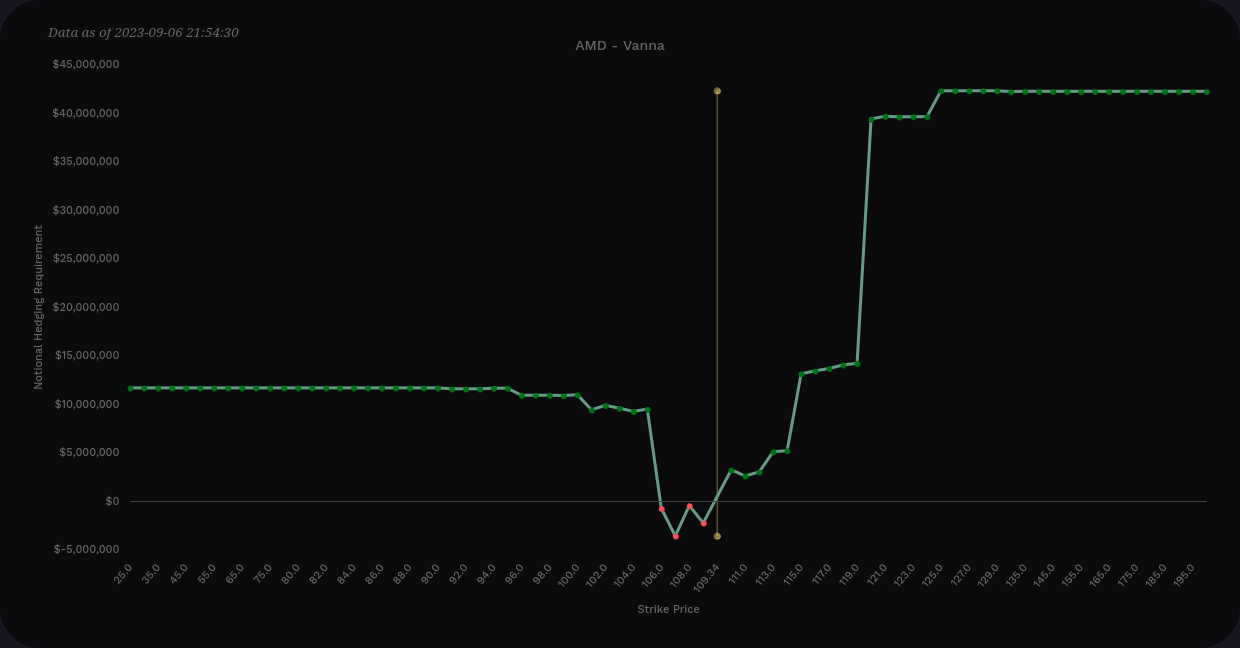
The curve shows almost all positive vanna across the board and our biggest vanna level by far is $120. There's very little below $105.
- If IV contracts, I'd expect AMD to be pulled towards $120. This would likely top out around $117-$118 since vanna effects would weaken there (vanna is strongest from 0.15-0.35 delta) and AMD has liquidity problems there.
- If IV expands, $105 is a possibility. However, this chart doesn't really tell us much about what will happen if AMD falls through $105 and keeps going.
With this data so far, I'm thinking that AMD has a $105-$120 range to play with at least through 10/20.
Options flow
AMD bounced around a lot yesterday, but bulls had a very slight edge by the end of the day. (Be sure to examine the y-axis in each of these charts!) On the five day, the bullish trend is much more pronounced with the lines growing apart.
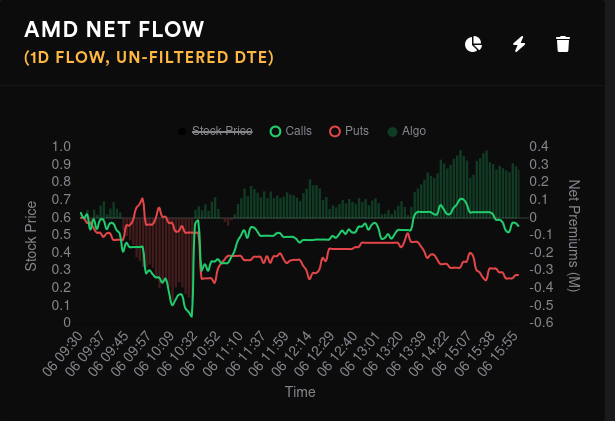
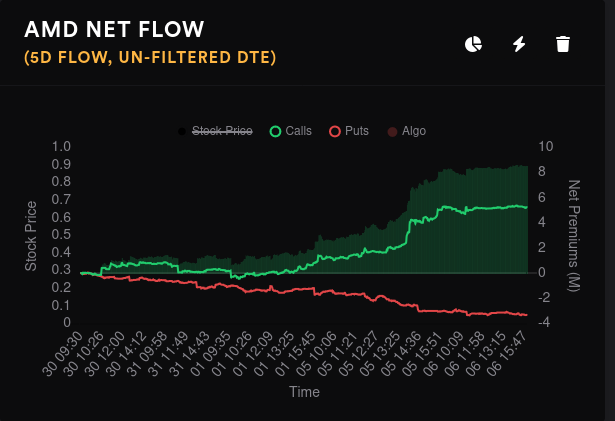
Options premiums are increasing for AMD, especially after 9/5. Volume fell off sharply yesterday and that might explain our very choppy daily flow chart. Open interest increased, however.
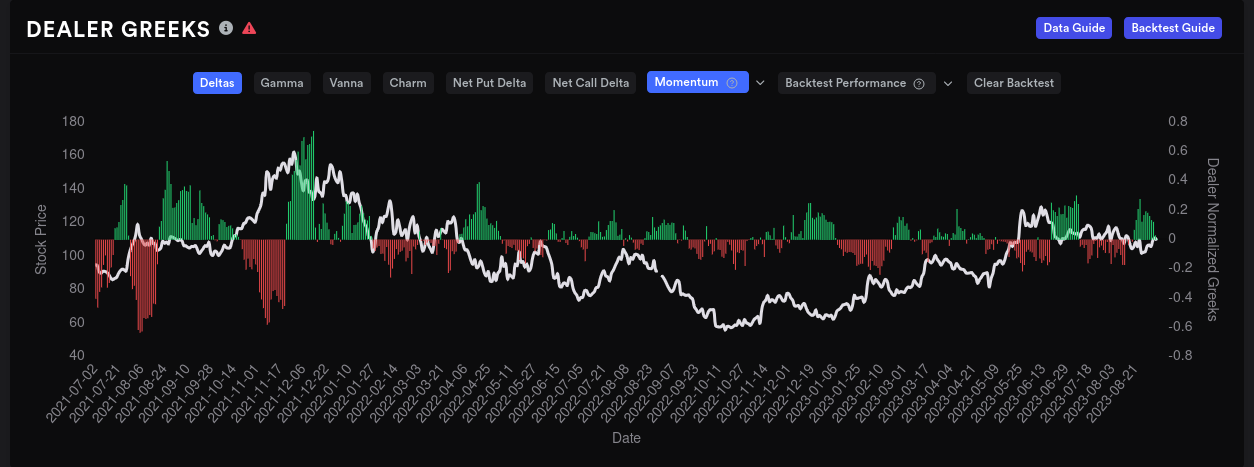
Dealers were quite long on AMD for several days and that suggests market participants were short. That has turned around and dealers momentum has returned to the middle line. If momentum for dealers shifts short, this has proven to be a bullish sign for AMD in the past.
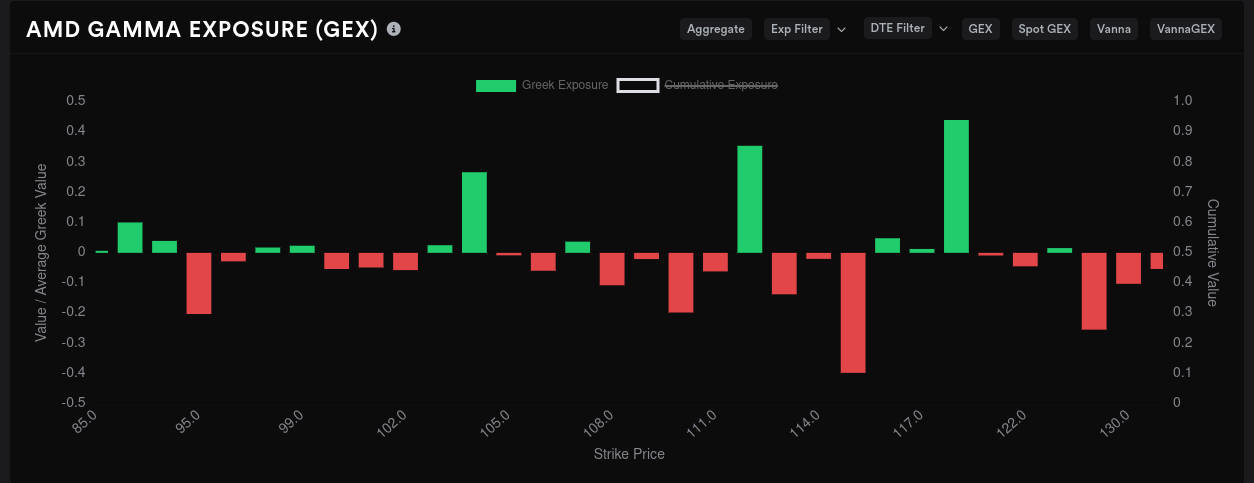
Gamma exposure
GEX for AMD seems to be packed heavily into 9/15 and 11/17. There's not much GEX to speak of for 10/20.
How do I read the GEX chart?
GEX can give us another picture of where price might be going. Green bars here highlight positive gamma exposure, which usually repels price action. Bear in mind that it repels in both directions. If price crosses a positive gamma line from below to above, that can give price a little boost higher.
Negative GEX is represented by red bars, and concentrated levels of negative GEX often act like magnets for price. If you see a lot of shorter red bars packed tightly together, that whole range can be a magnet for price. My eyes usually gravitate towards the longest red bars since this is a hint at where price is likely headed by a particular expiration date.
A look at the aggregate GEX is the best way to start. The first thing I notice here is that $115 is still quite large and that's likely our biggest magnet for price. We have resistance showing up most strongly at $120, but there's a decent amount at $112 and $104. I'm glad to see that $95 has reduced a bit.
Since we know 9/15 and 11/17 are our biggest GEX expirations, let's check both of those. First up is 9/15.
Boy, this chart doesn't leave much to the imagination! $120 is a clear "do not pass" line and $115 is a clear price magnet. Notice that some of the aggregate GEX resistance levels totally disappear on this chart.
The only worrisome thing is that there's not a lot of downside protection here if we do begin moving down. Vanna stopped around $105 and GEX seems to stop around $104.
With 9/15 out of the way, let's look at the pre-Thanksgiving 11/17 expiration. 🦃
What in the world is this?! The biggest price magnet seems to be $125, but the $120-$135 region is tightly packed with negative gamma. This was not what I expected. However, this expiration is a bit far out and it's difficult to predict out this far. There is plenty of news that will show up in between.
I ran back to volland to get a look at now through 11/17 just in case, but the chart looks identical to the ones I posted in the first section. Bullish to $120, but tapers off after that. I'm eager to see if vanna shifts to match GEX.
Other options data
What are whales (big options traders) doing?
- 9/15: Someone was fairly bearish on $110 for a while, but they backed out of that position. $104 is getting the most bullish attention.
- 10/20: The big bullish bet on $95 remains on the board. It's up about $17M in net premiums since 8/29. 🤯
- 11/17: There are modest bullish movements on $120, $125, and $135. Someone did go slightly bearish on the $115.
So whales on 11/17 seems to be making bullish bets on higher prices.
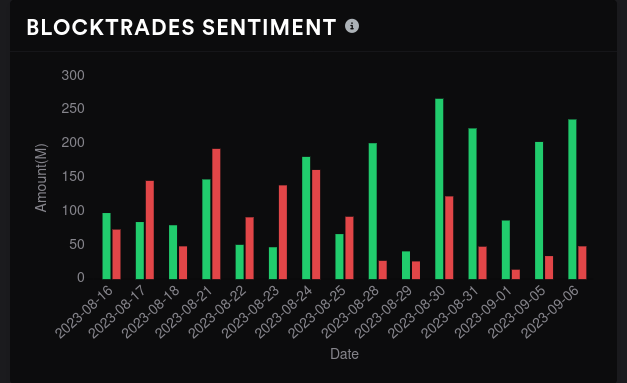
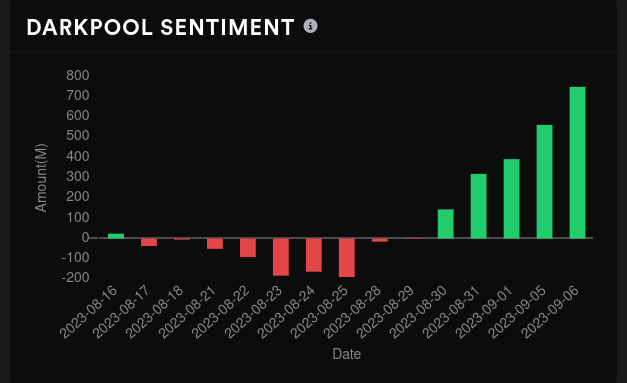
Dark pools
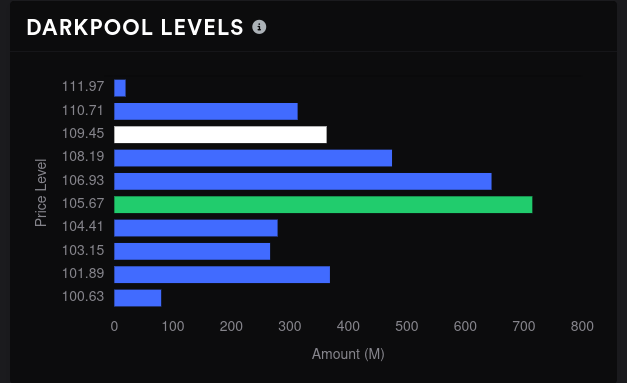
Can dark pool data correlate some of this data? Let's check!
AMD's heaviest volume sits around $105-$106, but it's building decent levels from $102-$111. That's good to see because this happened prior to the May 5th rally, too. A strong base built up and we had support to move higher.
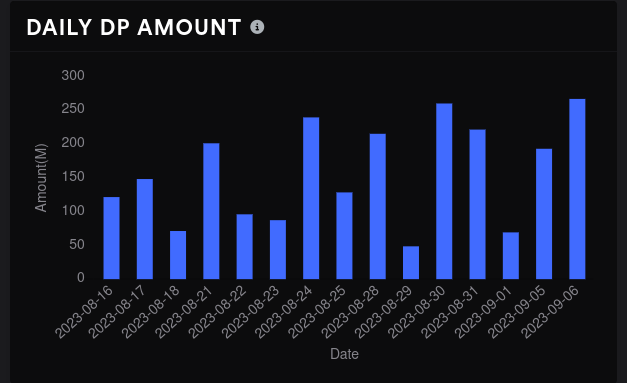
Sentiment continues to turn more bullish with bullish traders winning over bearish ones seven days in a row! 🤯 Volume was the highest yesterday that we've seen since 8/16 and that confirms the bullish trend for me.
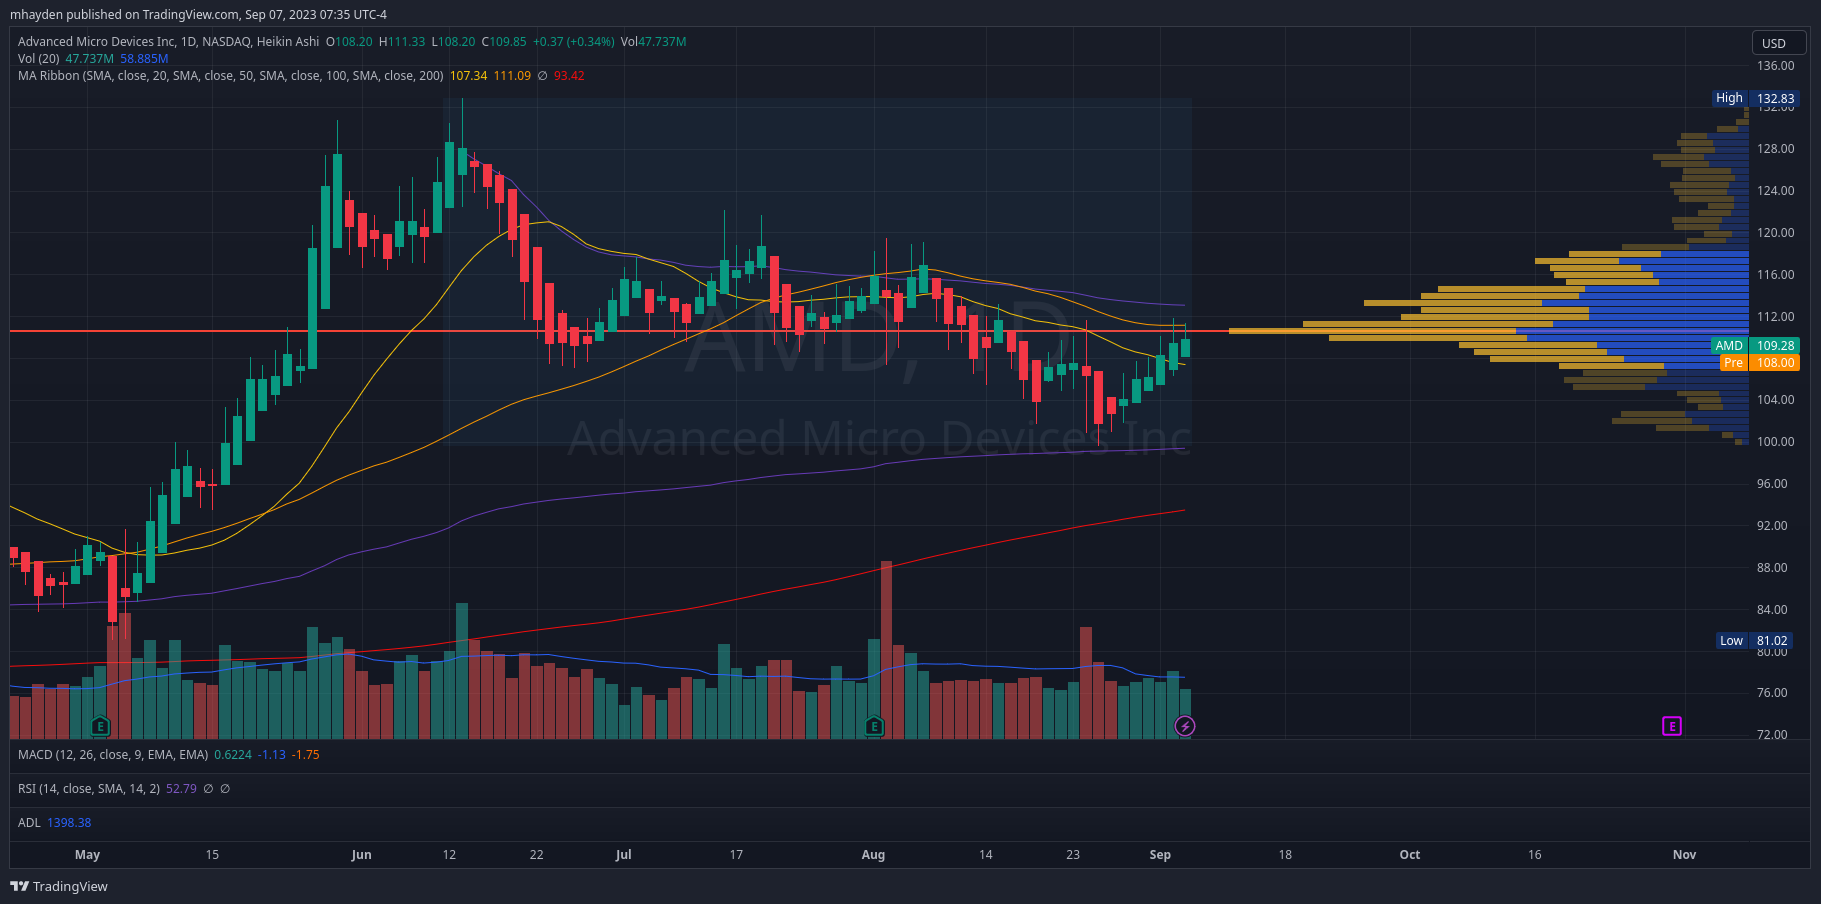
Chart
AMD's daily chart has been consolidating for a while. We have some important levels to note here:
- Volume by price suggests that the point of control is around $110.50 since the most recent high in June.
- AMD is trapped between two critical VWAP lines. One comes up from the January pivot and the other comes down from the most recent high. These sit around $100 and $113. (Isn't that interesting? That's what GEX suggests as boundaries, too.)
- The 200MA is rapidly approaching from about $93.
- The 20/50MA lines had a death cross in July, but AMD crossed the 20MA this week and is knocking on the door of the 50MA line two days in a row.
- We almost had five bullish HA candles in a row. Tuesday's candle had some doubts.
Thesis
AMD has that look of something is about to happen written all over it. Based on what I've seen earlier, a breakout to the upside seems most likely. However, there's plenty of evidence that we're hemmed into a $105-$120 range, at least through 10/20. We have some room to run somewhere between 10/20 and 11/17, but AMD's earnings are in that area, too.
I figured it would take AMD some more time to begin lifting off, so I sold quite a few covered calls from $108-$114 for 9/15. Those might cut it close for 9/15, but my cost basis is in the $90's. If I get assigned, then I know I locked in a bunch of profit. 😉
I also hopped into a short $100p/$120c strangle for 10/20 yesterday. If I'm confident in AMD's boundaries through 10/20, why not trade them?
Another word of caution I'll give is that overall market indexes are looking a bit bearish for now. I did a deep dive into SPX/SPY yesterday that you might enjoy reading. Remember: even the hottest stocks will often take a hit when the overall market is moving down. Don't fight the overall flow of the market.
All of my trades are kept up to date on Theta Gang along with detailed trade notes. Good luck to everyone out there today. 🍀
Discussion