AMD stock and options analysis for November 7

It's been a week since AMD's earnings rally, but it stalled out since then. Is it taking a breather or looking to retrace? 🤔

Happy Tuesday! ⛅ I'll take a look at AMD today after about a week since earnings and an absolutely monstrous day on November 1st.
All investments come with significant risks, including the loss of all capital. Please do your own research before investing, and never risk more than you are willing to lose. I hold no certifications or registrations with any financial entity.
Let's get into the data! 🔎
Chart
Usually I do the chart last, but sometimes it's fun to do things in reverse, especially when you are looking for correlations. 😉
AMD's daily chart shows the huge rally on 11/1 right after earnings followed by some speed bumps. Could this be disagreement among traders on the valuation? Could this be a breather before a move higher? Is AMD just following the overall market trend which stalled out yesterday? These are the questions we need to answer.
First off, LuxAlgo has marked AMD's recent candles in a bullish pattern and AMD blasted through a 1D order block from $108-$112. Ideally, if AMD were about to go higher, I'd like to see the zone of that order block tested once more as it was yesterday. Also, I want to see AMD fill that fair value gap that appeared around $113. (My FVG detection is set to 15m intervals because I only want to see the strongest fair value gaps.)

We're in the premium half of the trading zone, but we have room to move up to the next order block around $115.50. Past there, it's the premium zone around $128 with an order block.
If we do move down, we have an order block around $97.50 that could provide support. There's also the equilibrium zone there followed by the COVID VWAP lines. If AMD loses $90, look out below. Our next order blocks from November 2022 are hanging out around $60. 🤯
The oscillator shows that money flow is still bearish, but moving to the bullish side. The oscillator wave is firmly in the bullish half but its momentum is definitely weakening. If the wave makes a lower high here, we could see a bearish divergence from the peak around 10/12. That would be a bearish sign.
Institutional trading
I'm still learning my way around Volume Leaders and it's a really interesting tool. It keeps tabs on very large trades happening on lit exchanges or in dark pools. The most important thing to remember here is that it does not show directionality of trades. All you know is where the trade was made, when it was made, and how large it was. It's up to you to think about what the institutions might be doing there based on other data.
Here's a look at the last seven days from Volume Leaders:
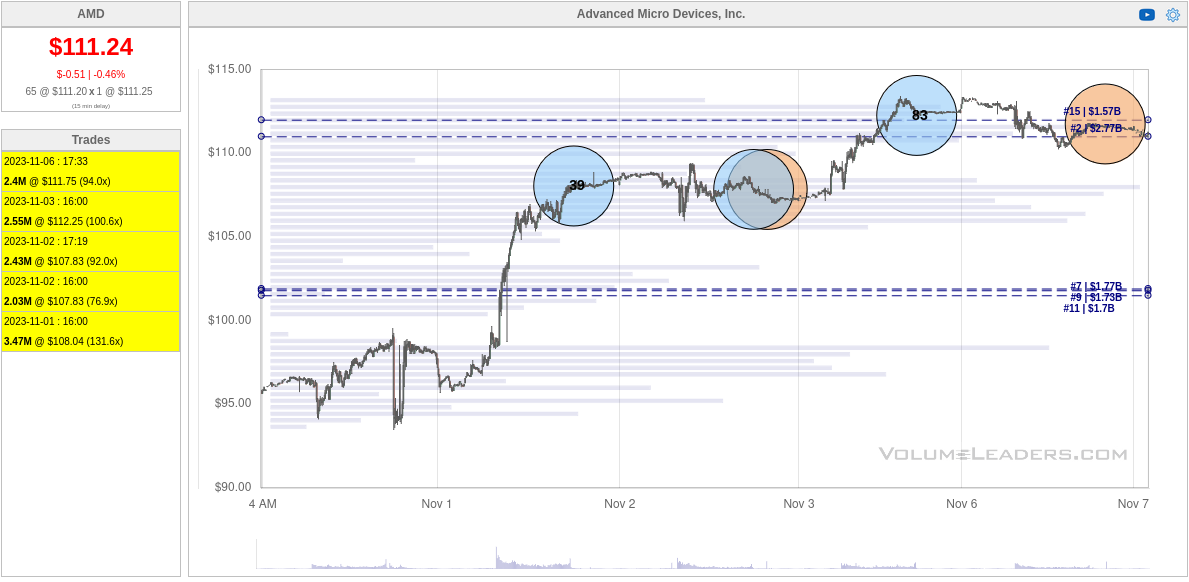
The first one I notice is the blue circle with "39" in it right after the post-earnings rally on 11/1. That's the 39th biggest trade in AMD's history. The question here is: is that institution betting on the rally to continue, are they taking profits, or are they opening a short position. The chart does not tell us that.
The 83rd biggest trade appeared at $112.25 on Friday. A big dark pool trade of $2.4M shares showed up yesterday afternoon at AMD's #2 volume level. These are all very interesting.
Zooming out to 90 days might give more clues:
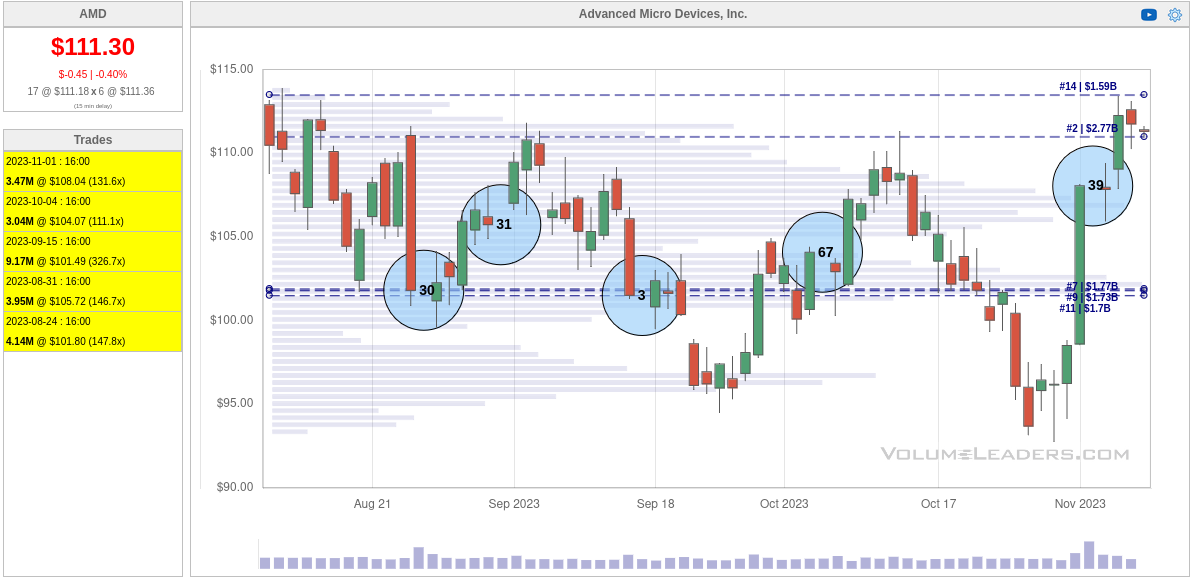
Notice that AMD has outrun some of the highest levels of volume here and #39 on the far right shows up at a very interesting time after the rally on Nov 1. My initial thought here is that an institution is taking profits or starting a short position (or both).
How about another way to look at semiconductors? Perhaps we check SOXL, the 3x bullish ETF:

Yikes. Price is above any meaningful level here and institutions keep hitting it. 👀
How about SMH?
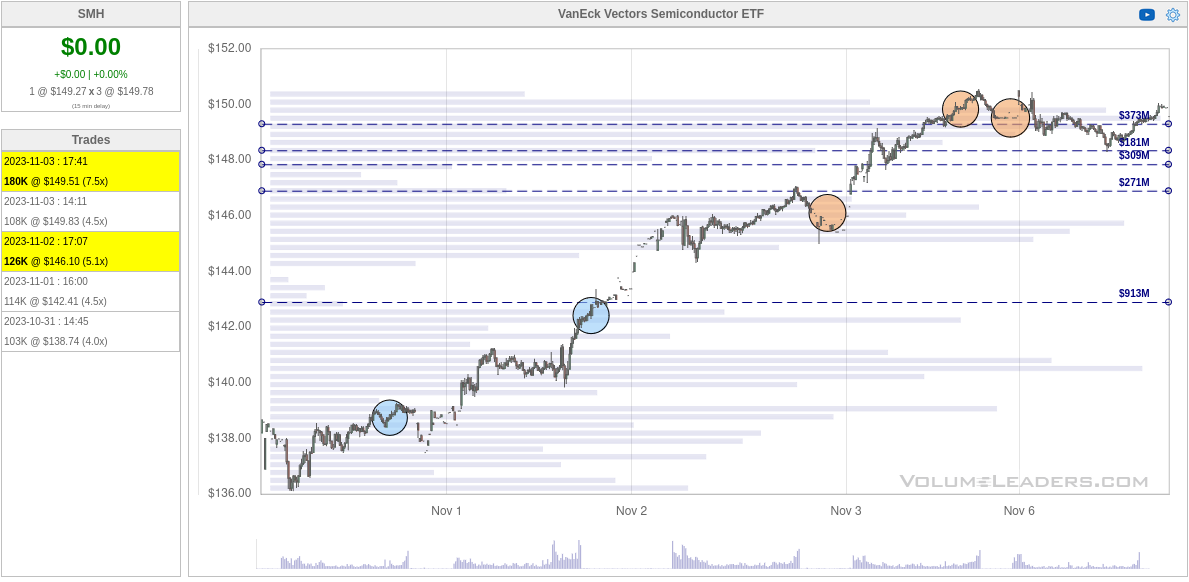
Again, prices are at the tops here, but on a meaningful level this time. If you were an institution and saw this, would you be deploying capital for long trades or shorts? I'm worried these are shorts.
Vanna
Vanna might give us some clues on where AMD may go if implied volatility (IV) drops further.
Let's start off with some aggregate charts from Volland. The curve shows AMD's vanna as almost entirely positive and with most of the positive vanna above the current price. This is extremely bullish if IV drops. However, if IV increases for some reason, AMD would likely head lower, possibly near $100.
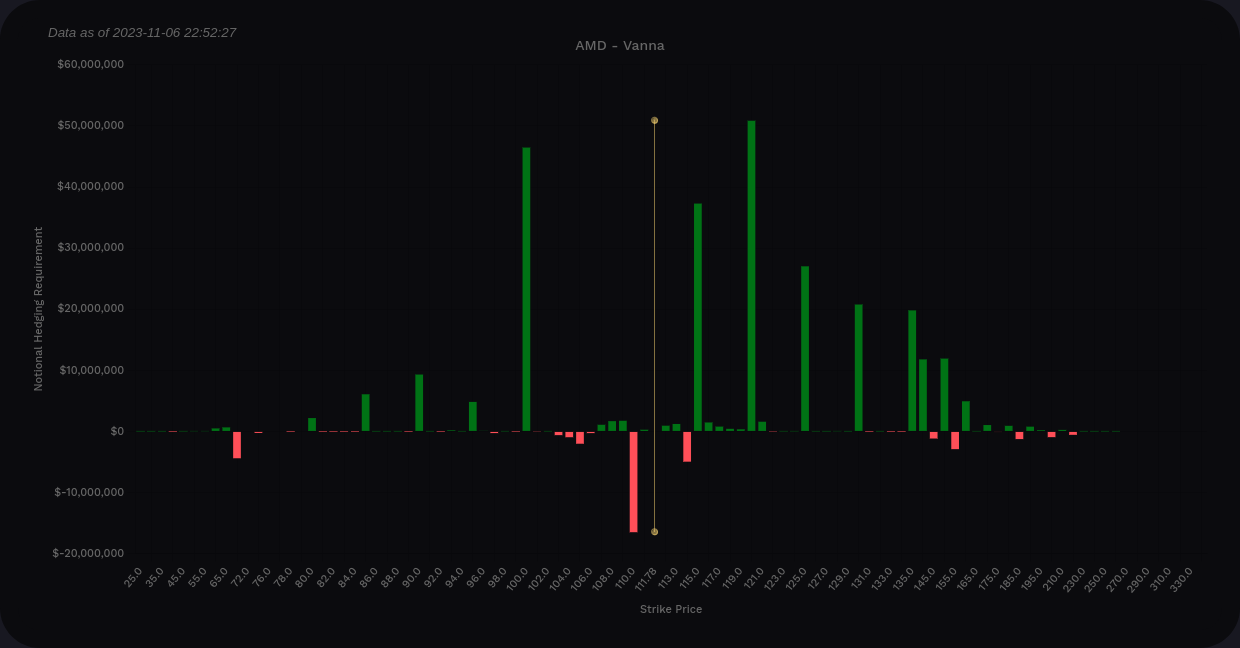
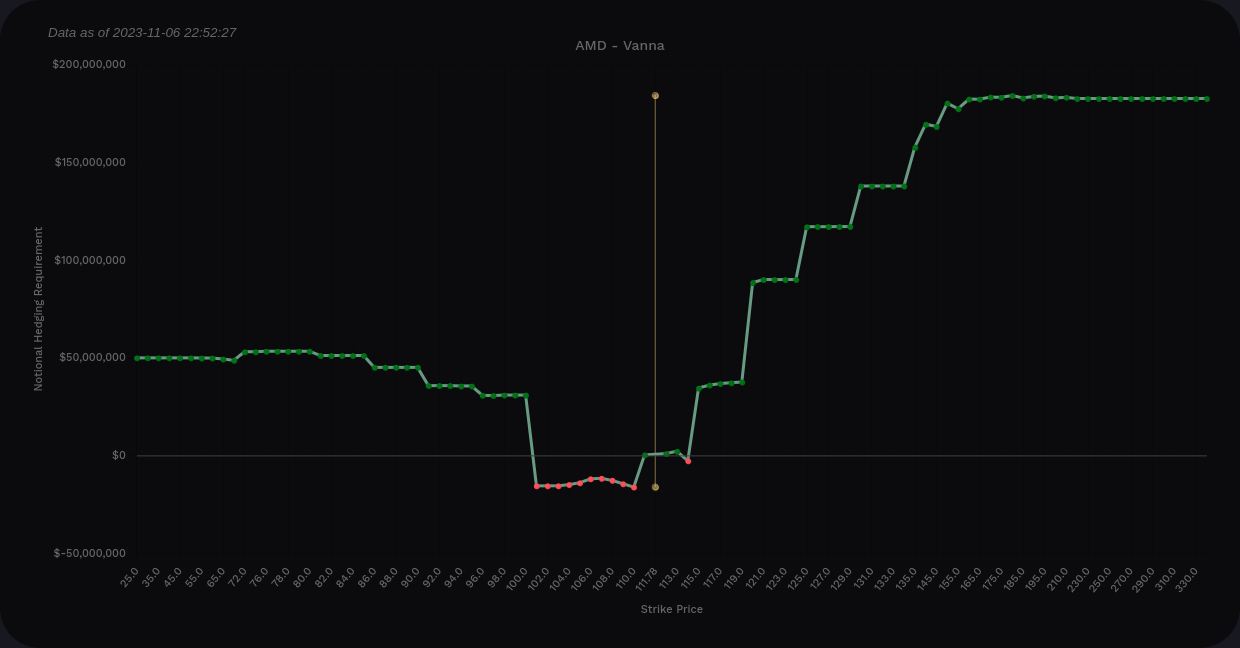
AMD aggregate vanna from Volland
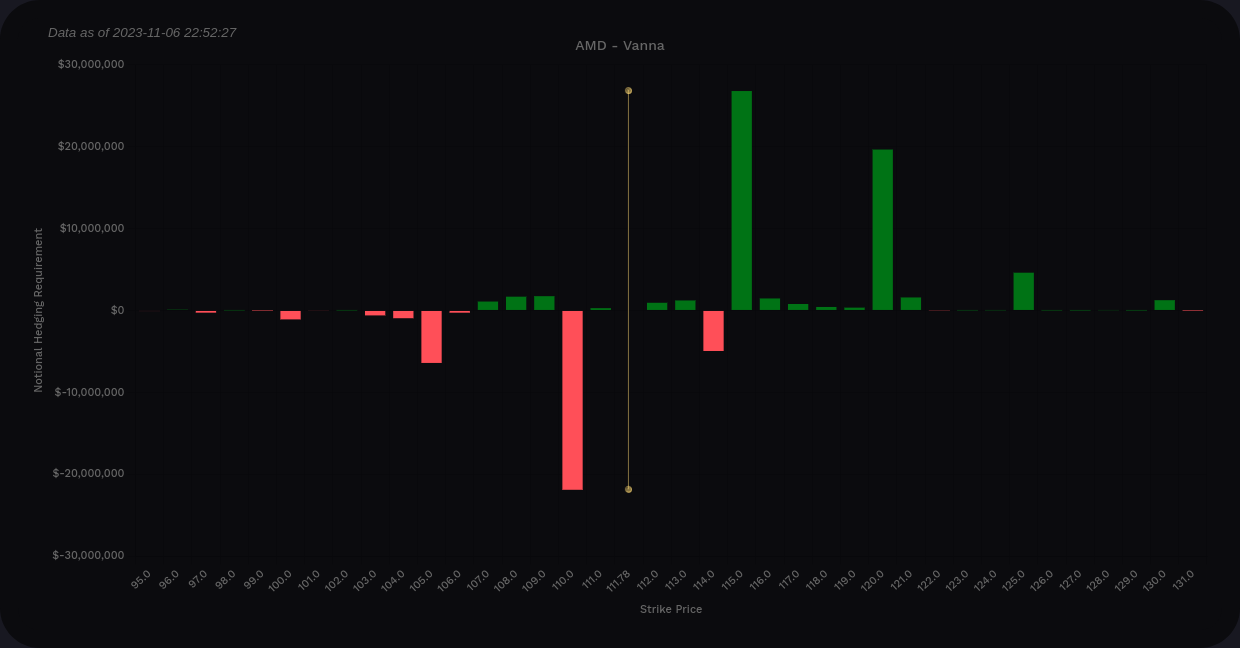
So you might be thinking: just how much upside is left? I like to look for outlier bars on the chart and $120 is definitely the biggest one here. In fact, AMD has solidly positive vanna from $115-$135 on the $5 intervals. There's almost no negative vanna to get in the way, either.
Most of my trades are running through 12/15, so do we see the same bullishness if we limit our vanna scope to those expiration dates?
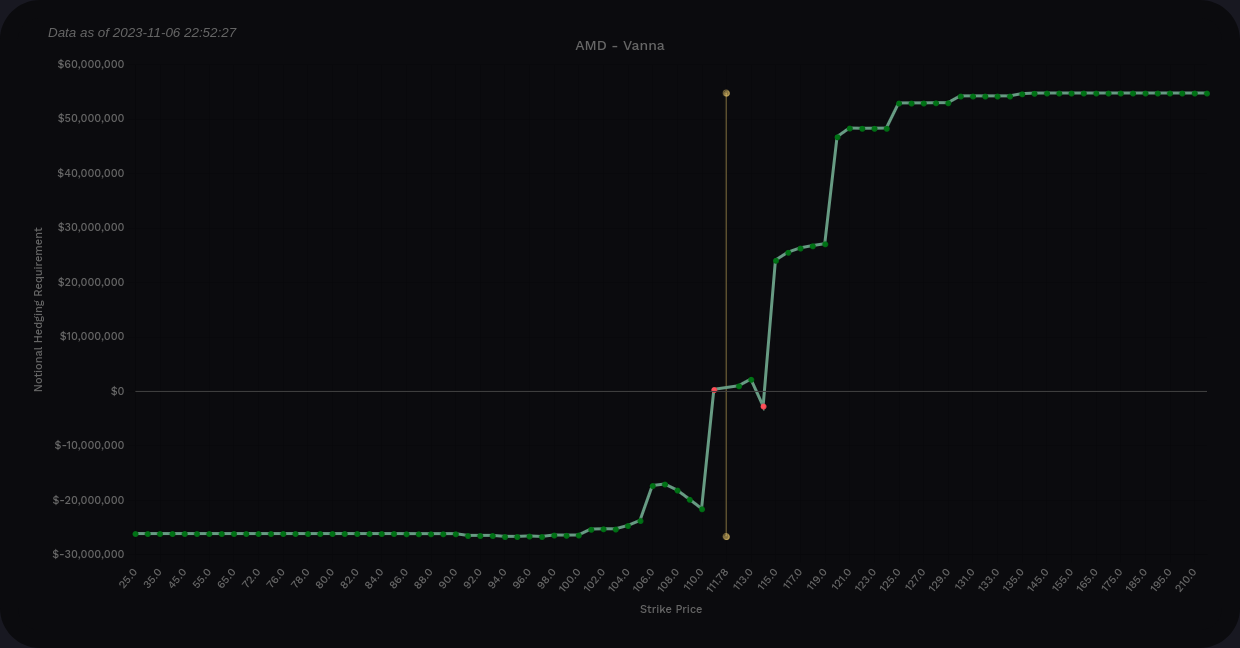
AMD vanna through 12/15 only
AMD is still bullish here with plenty of positive vanna, but the ratio of positive to negative vanna is lower. I read this as "still bullish, but a little less so." $115 stands out as the biggest magnet for price, but $120 is decently-sized, too. Note that there's nothing substantial here past $120.
Gamma
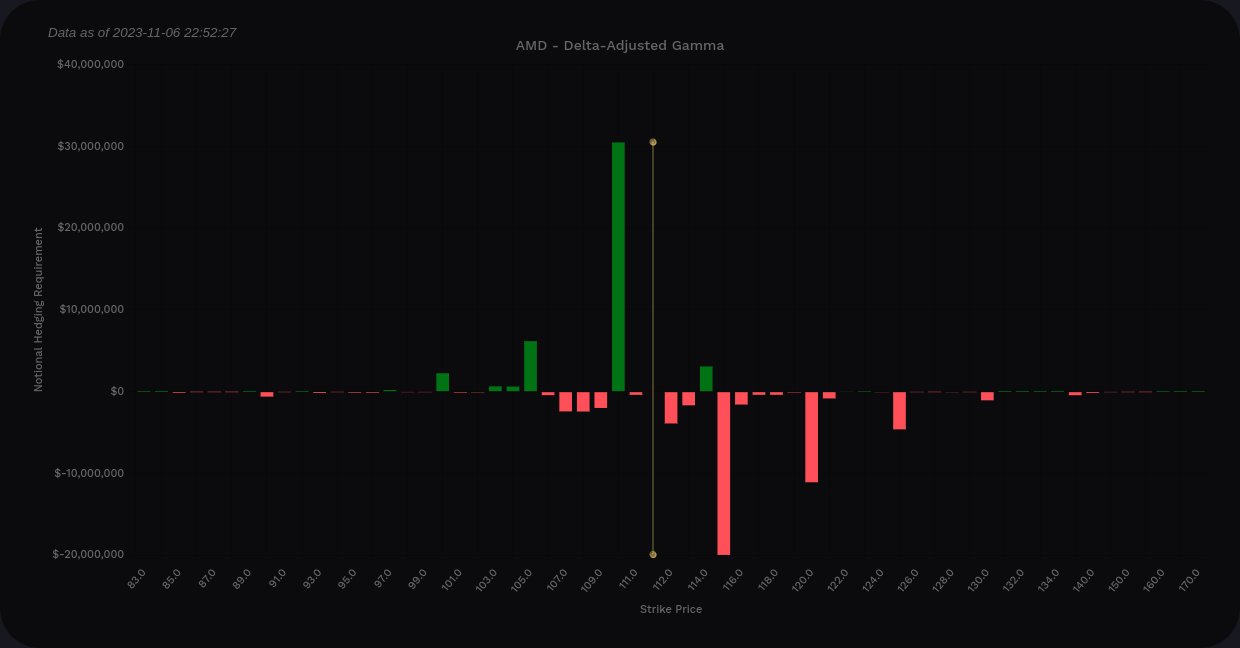
I'll use Volland's delta-adjusted gamma (DAG) since it's easier. It flips the gamma above the price you can examine everything with the same colors regardless of where price sits.
Again, $115 seems like the strongest magnet for price, followed by $120. $110 should repel downward movement a bit, but if we push past $110, we might end up around $100. This matches up with vanna levels from earlier in the post.
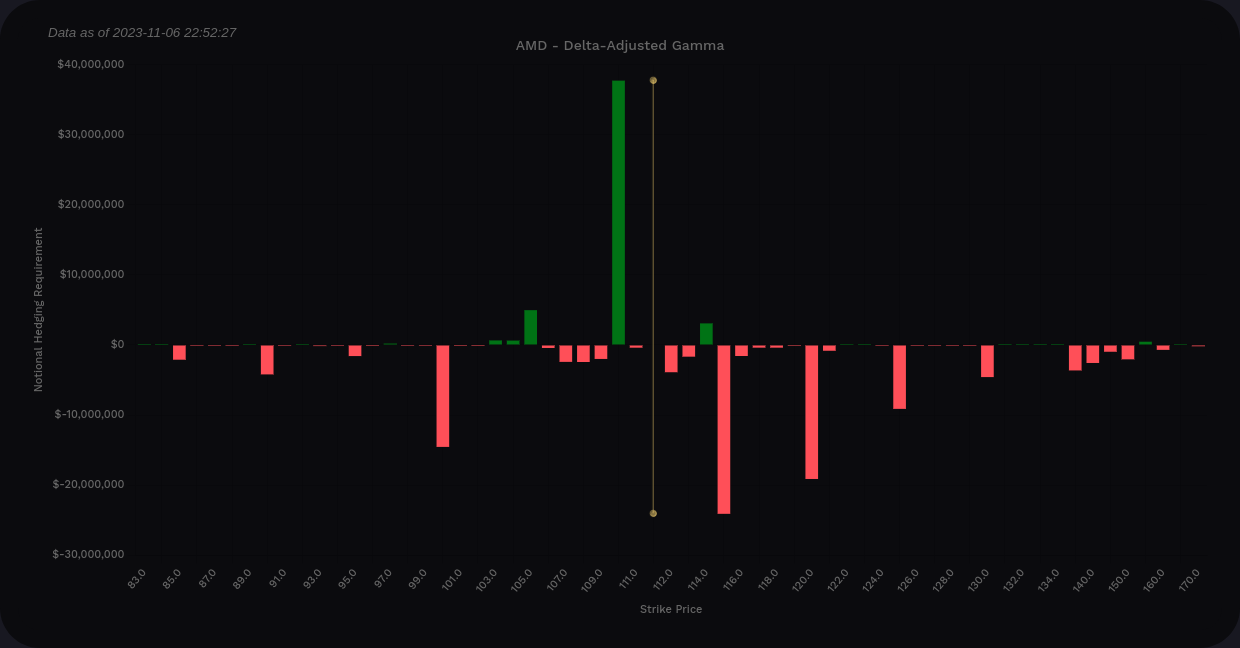
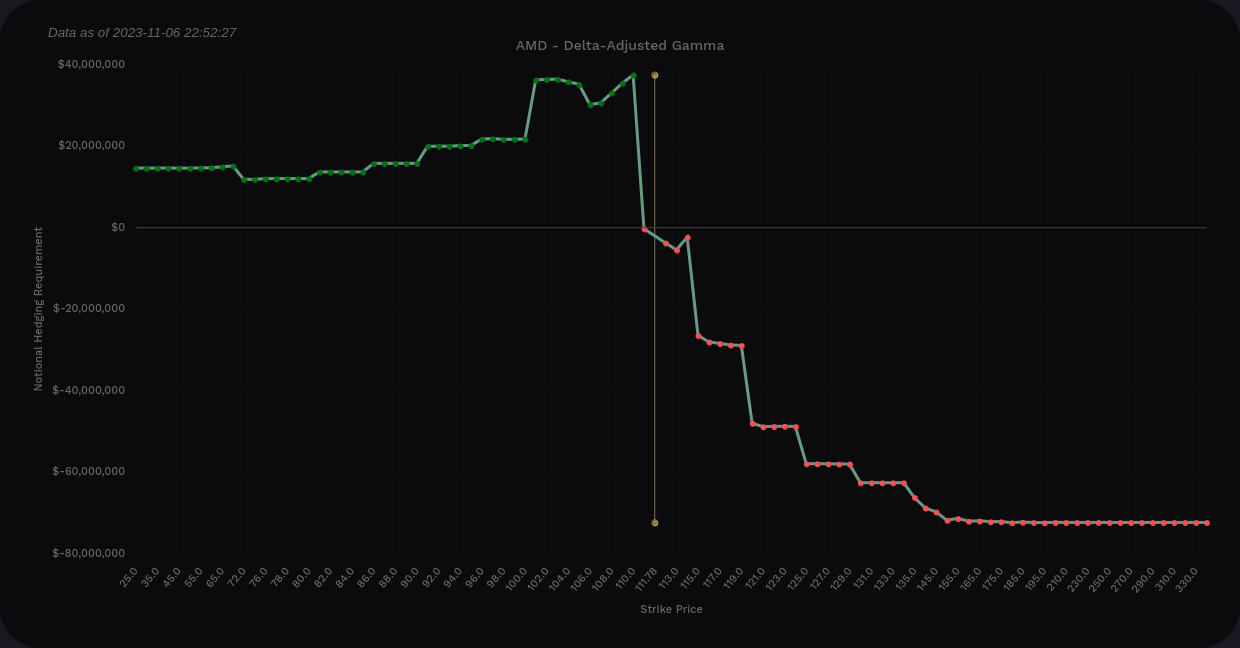
AMD DAG on aggregate
I'm focused heavily on 12/15, so let's look at that data as well. $100 shows up as potential support here with $115 as a magnet. $120 definitely looks weaker through 12/15.
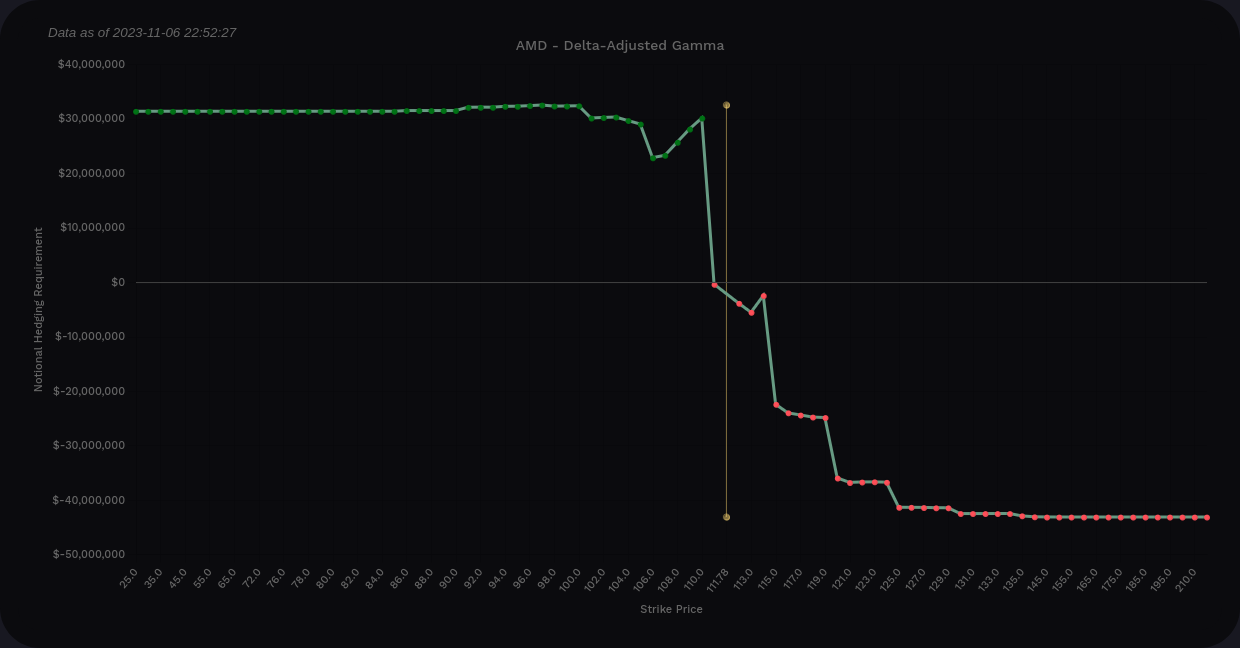
AMD DAG through 12/15 only
Thesis
AMD seems to really enjoy trading in a range recently and it looks like we could have a $100-$115 range here through December which might open up to $100-$120 after 12/15. However, all of this really needs an environment where implied volatility is coming down. Remember that positive vanna with increasing IV is a recipe for bearish price action in most cases.
I still can't figure out what institutions might be doing in AMD right now. Some of the biggest trades I keep seeing on Volume Leaders often coincide with market downturns, not rallies. Institutions seem to nibble at rallies but then join downturns in big chunks.
I'm sitting on far too many AMD shares right now and I've covered them at $110, $115, and $120 through 12/15. I would be glad to get assigned on any of these since my cost basis is around $90. I was in a $95/$125 12/15 short strangle as well, but I closed that for a profit yesterday.
I would be curious to put on another short strangle, perhaps for $100/$125 or $100/$120, on 12/15, but I'll decide once I see how AMD moves today.
Discussion