AMZN stock and options analysis for December 7

AMZN looks "primed" for a move down to support, but those levels look quite strong.

Happy Thursday! I returned from AWS re:Invent in Las Vegas last week and it was a crazy show. I don't think I've ever seen so many people in one place.
AMZN certainly has some interesting price action lately so I figured it might be worthwhile to give it a look this morning.
All investments come with significant risks, including the loss of all capital. Please do your own research before investing, and never risk more than you are willing to lose. I hold no certifications or registrations with any financial entity.
Time for data! 🤓
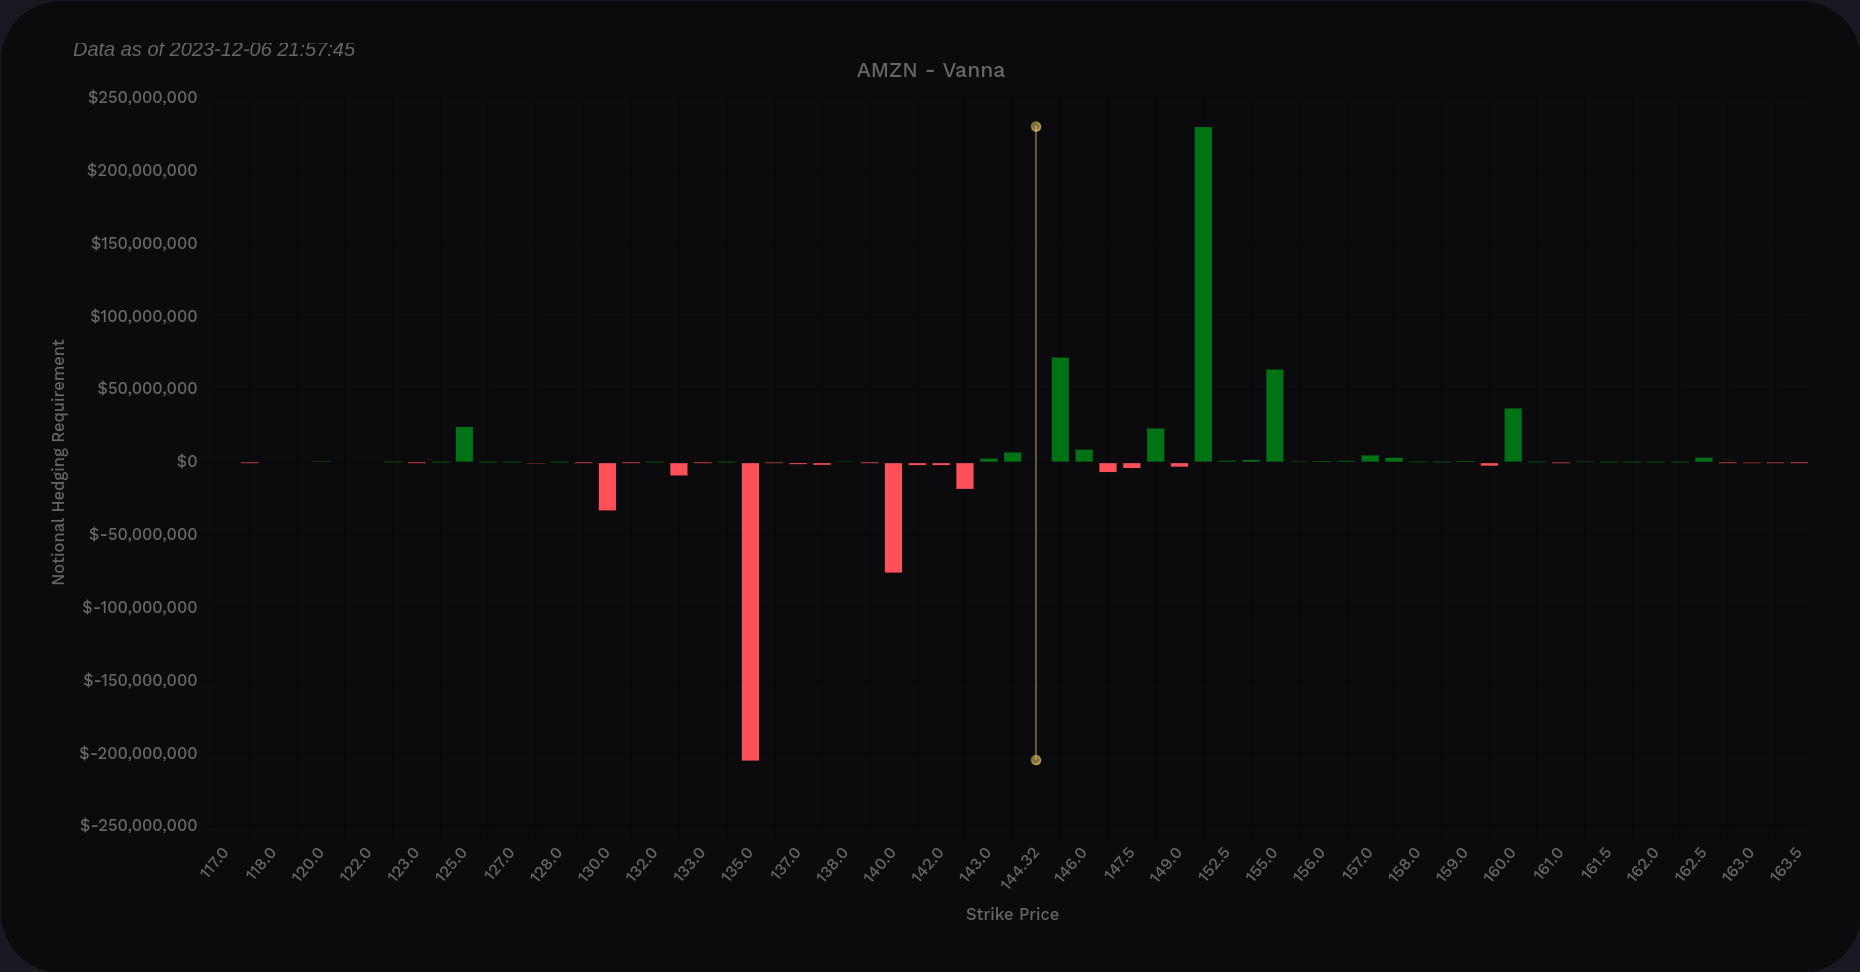
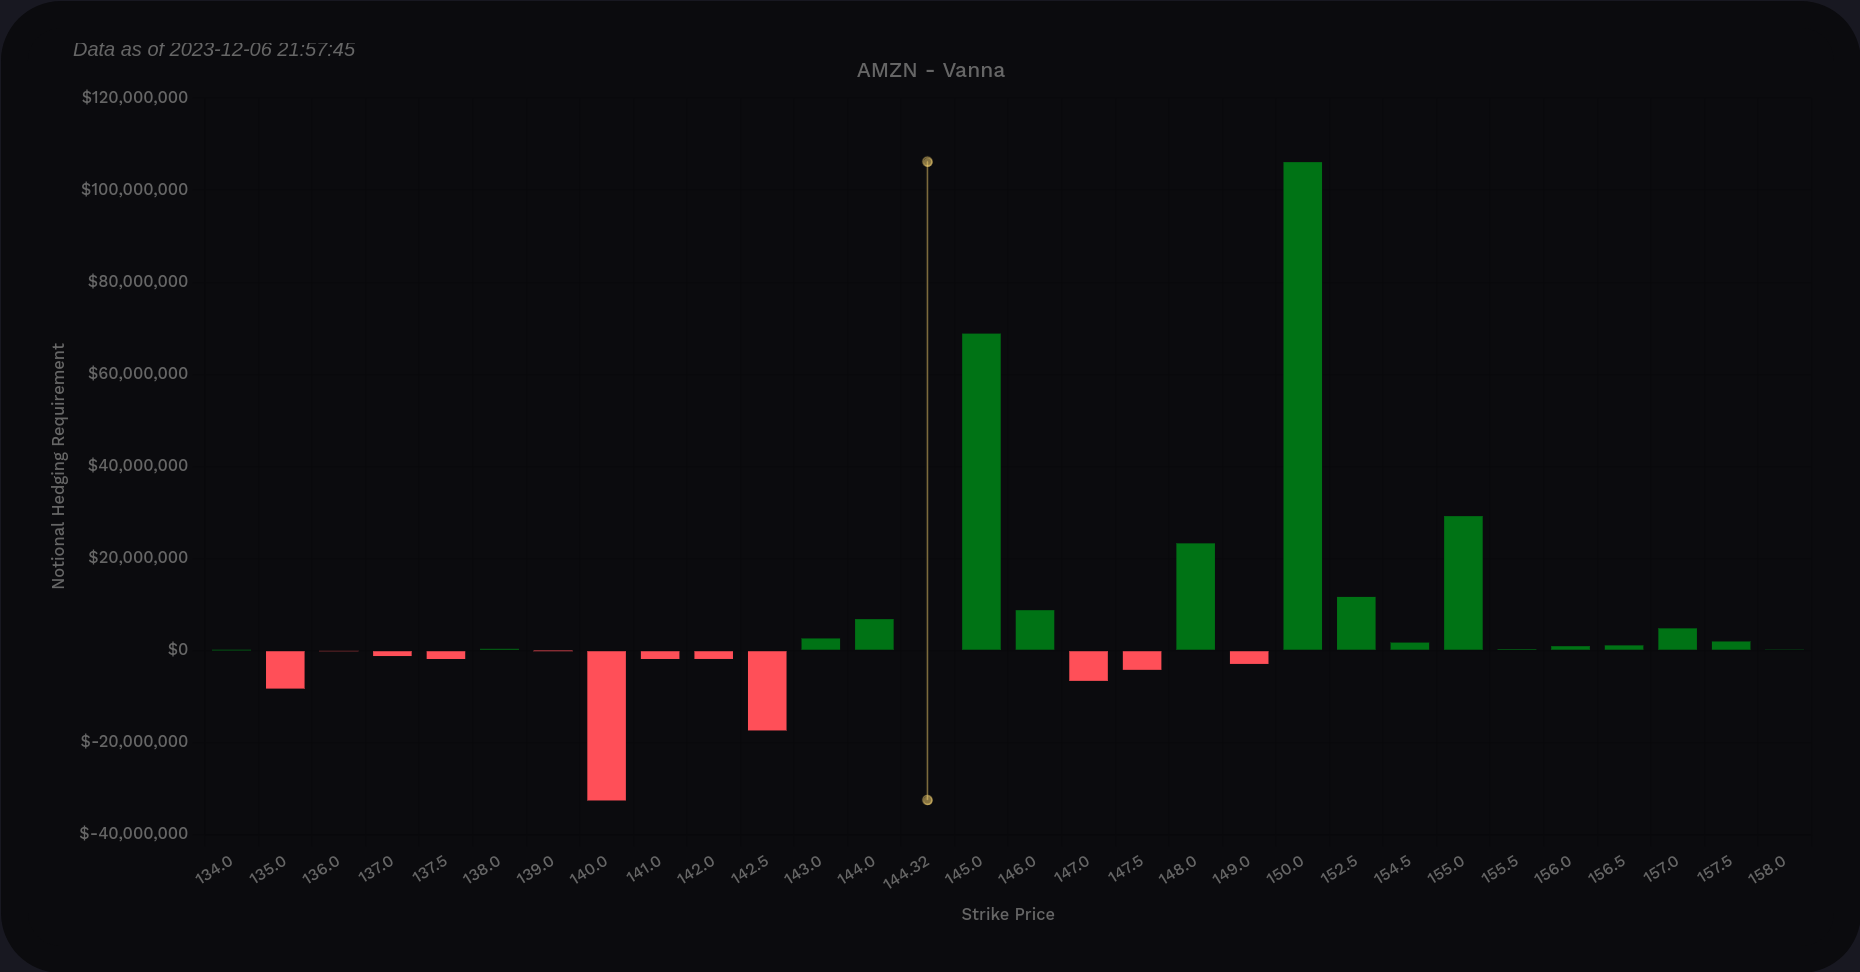
Vanna
AMZN's vanna curve certainly looks bullish above price with a very steep positive move around $150. That could be a likely target for price if it moves up on reduced IV. We're sitting so close to the positive vanna at $145 that is likely has no effect right now.
On the downside, we pick up negative vanna strongly at $135. There's a small amount of vanna around $140 as well. Keep these levels in mind because it would be nice to correlate these as areas of potential support.
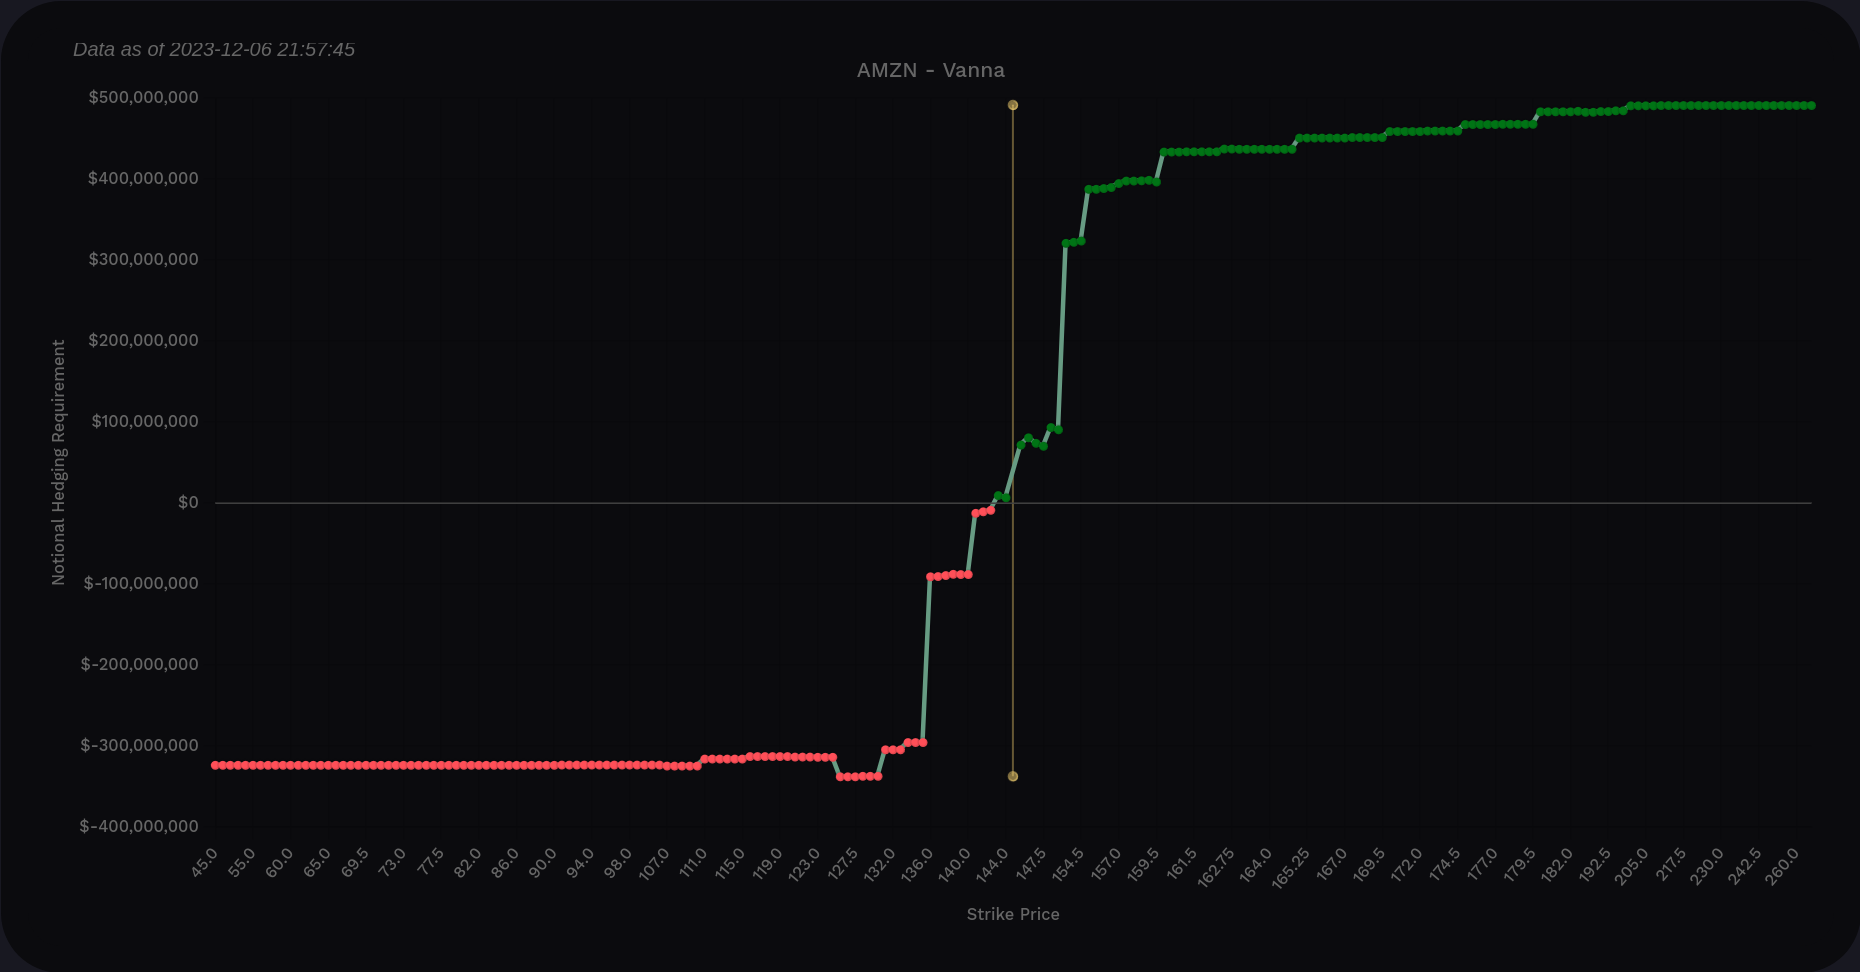
AMZN vanna across all expiration dates
Many of my trades are through 1/19 so let's take a look at AMZN vanna through that date:
Interesting. The $150 is much shorter here and the $135 shrank as well. Perhaps the larger moves are expected after January's OPEX.
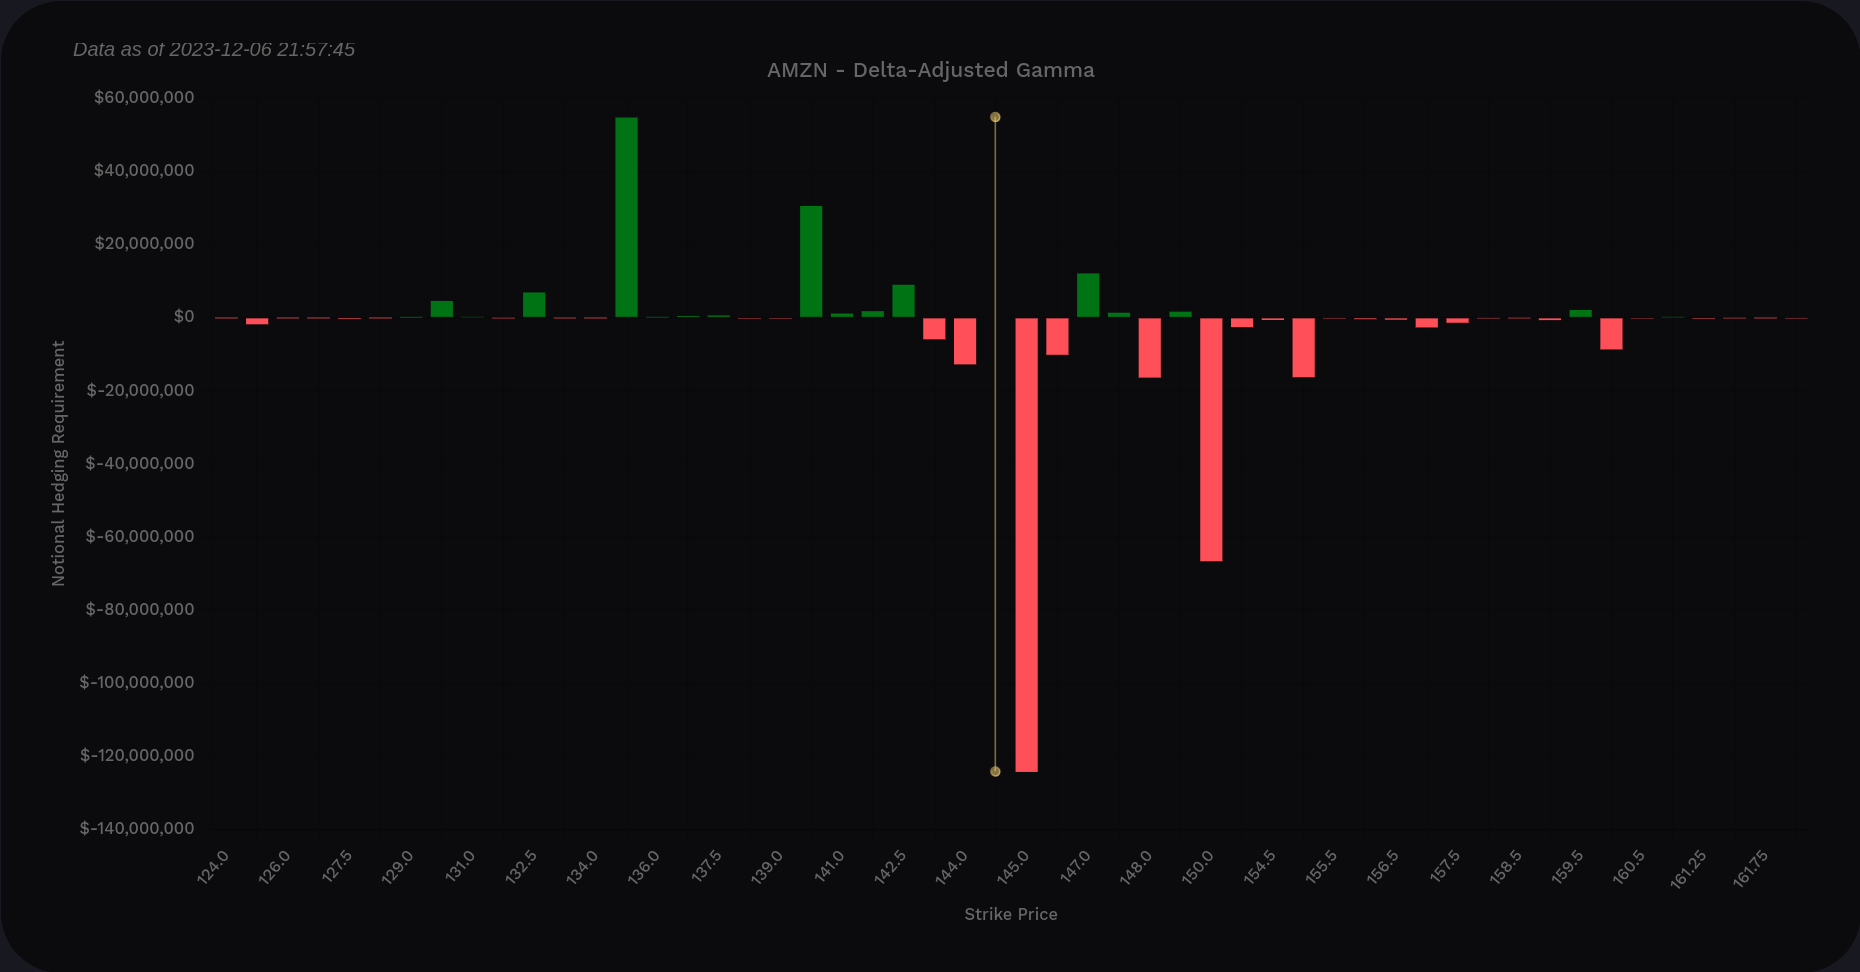
Gamma
Volland's delta-adjusted gamma (DAG) suggests we have some strong localized selling pressure right at $145 and it might be difficult to move off this level. We pick up support at $135 and $140 again.
Institutional trades
Volume Leaders gives hints about where big money traders are placing their bets but it doesn't tell us the nature of their bet. It's up to us to infer if they were going long, going short, or simply taking profits on an existing trade.
If we examine the biggest trades since just before AMZN's big gap in August, we can see that our biggest institutional level is around $130. It's also clear that institutions were very interested in the ride down from $145 to $135 in September that eventually pushed AMZN to $120.
You might notice that institutions made some "smaller" trades which ranked in the 40s and 50s but then a #4 rank trade came in after. This is a pattern I've seen a lot where institutions make small bets and then when they feel like the trend is in place, they send the rest in a big flurry.
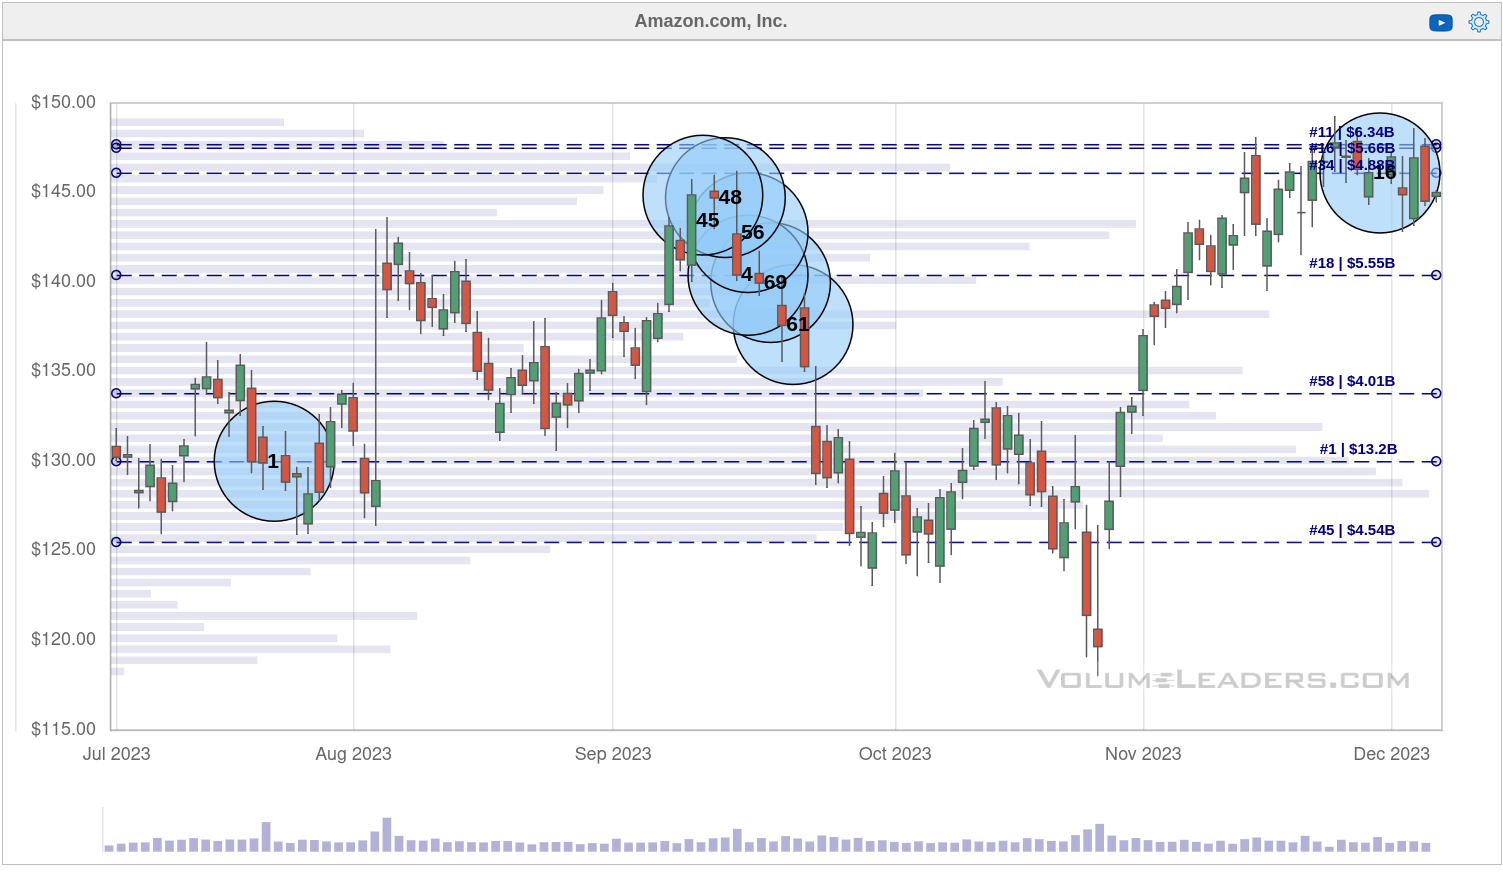
So what's happening recently? AMZN is at the highs where institutions seemed to go short earlier in the year. We have a trade ranked at #16 at $146.09 followed by some volatility afterwards.
This lines up fairly well with our vanna chart which suggested we don't have much vanna to help with price action when we begin to approach $150. Our gamma data also suggested dealers would apply selling pressure at $145. All that's left to examine here is the chart.
Chart
Going into this, we're thinking that $135 is special on the downside and $145-$150 could be a resistance level. What does the chart say?
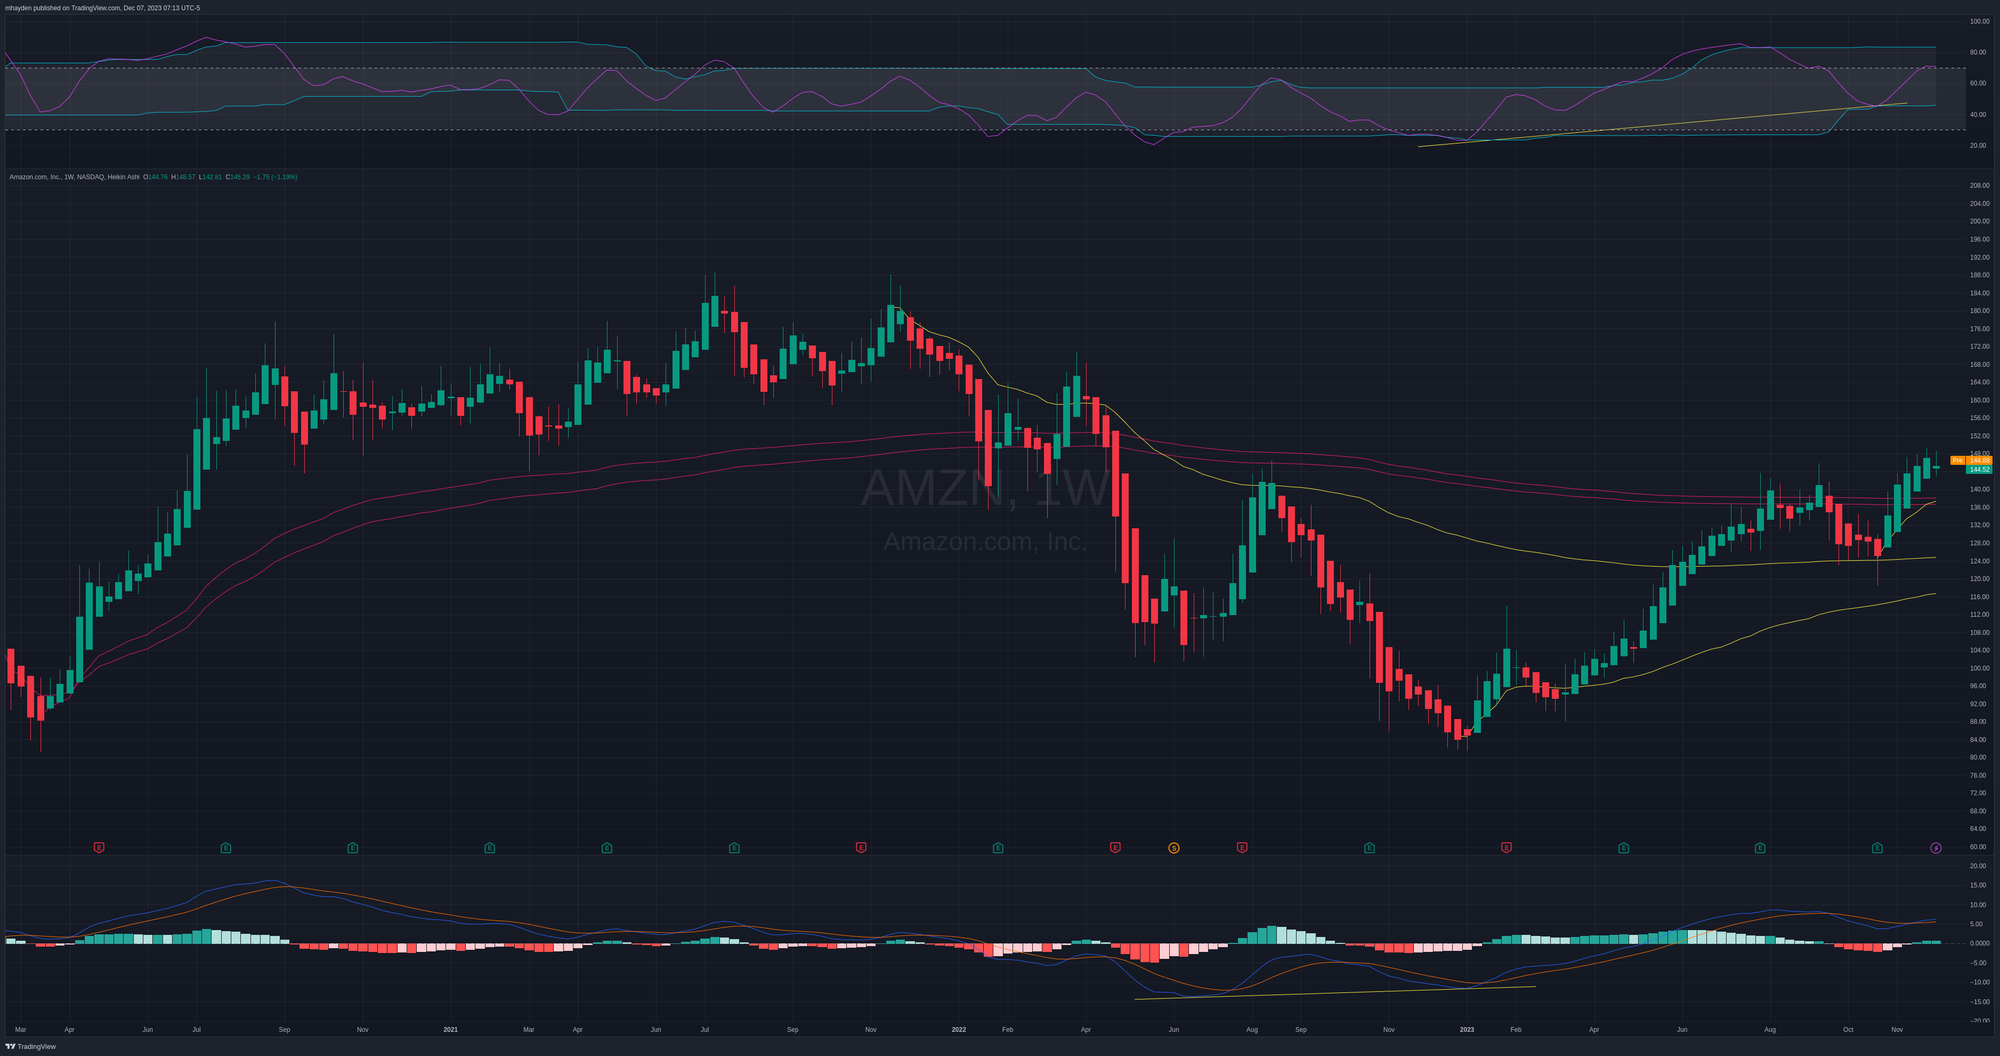
A weekly view of AMZN since the pandemic started shows some bullish confirmation on the RSI that began back in early 2023. We also had some bullish divergence from the MACD in late 2022 that suggested 2023's chart would look a little different.
The COVID VWAP lines sit between $135 and $140. The VWAP from the most recent October low sits right in between them. Previous VWAP lines from tops and bottoms come in at $125 and below, but those feel a bit out of play right now.
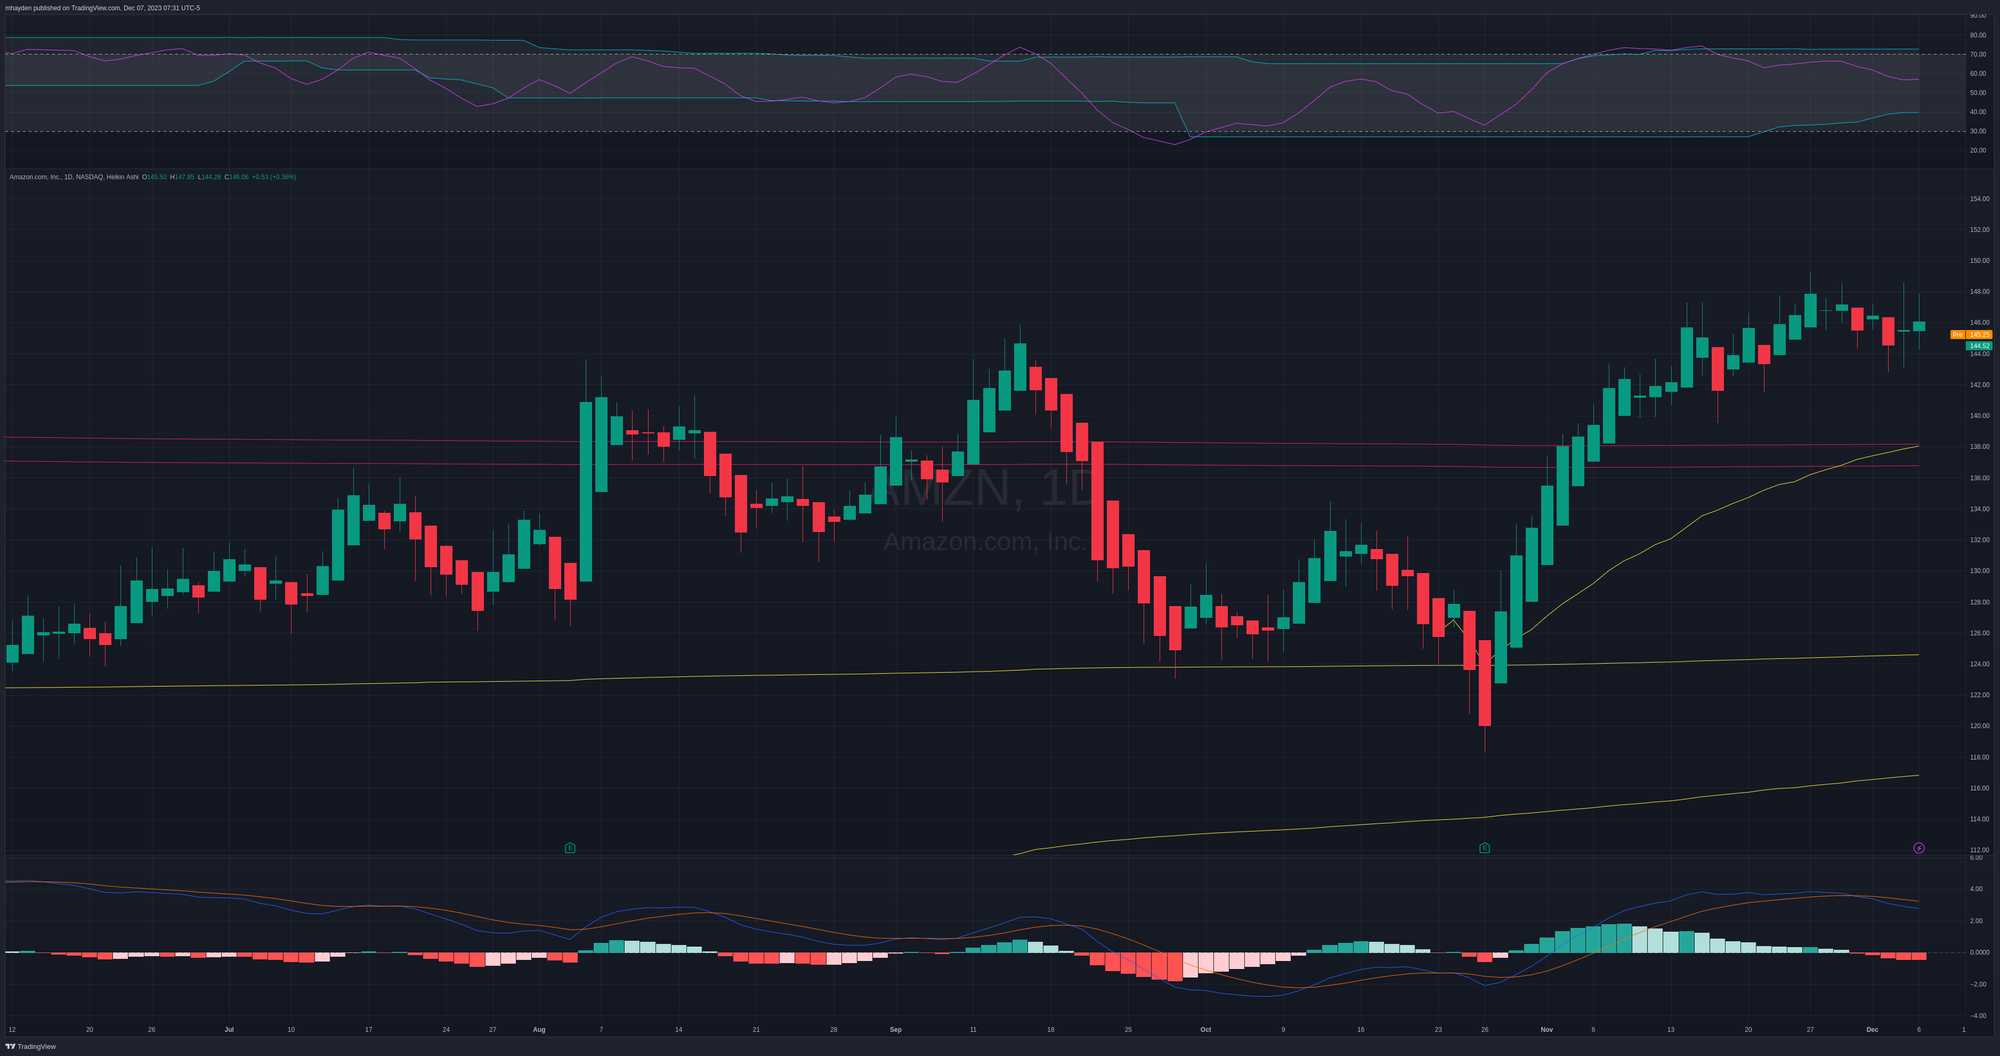
Coming down to the daily time frame shows a recent bullish divergence in the RSI and MACD indicators right before this monster move in November. I missed those!
Vanna, gamma, and VWAP support all lines up around $135. This is the type of confirmation I look for across multiple data sets.
Thesis
AMZN dipped below its COVID VWAPs much more aggressively than the other tickers I track. So yes, it's recent move is a monster move, but it's in a relatively weaker position than many other stocks. We have some bullish divergence in the RSI and MACD which has proven to work out well for AMZN in the past.
$145 does feel like a top for the moment and it's very clear that $135-$140 is a big support level. Losing that might mean a drip back towards the $120s, possibly $125.
I have two AMZN trades on the board. The first one is a short straddle at $145 for 12/15. It was a short strangle for a while until I had to roll up the puts aggressively during the huge move up. I'm still sitting on this one for now as AMZN seems to bounce around $145.
My other trade is a short $132.50 put for 1/19. I like this one because it's just below the COVID VWAPs and it lines up well with vanna/gamma data. AMZN's IV isn't great right now but it's a fairly conservative trade.
Good luck to everyone today! 🍀
Discussion