Analysis for August 7

Happy Monday! Let's take a look at AMD and TSLA again to where they might be going. 📈

If you missed yesterday's Charts and Coffee, run back there and take a look! I'm keeping this Sunday tradition as it makes for a much less stressful week. ☕
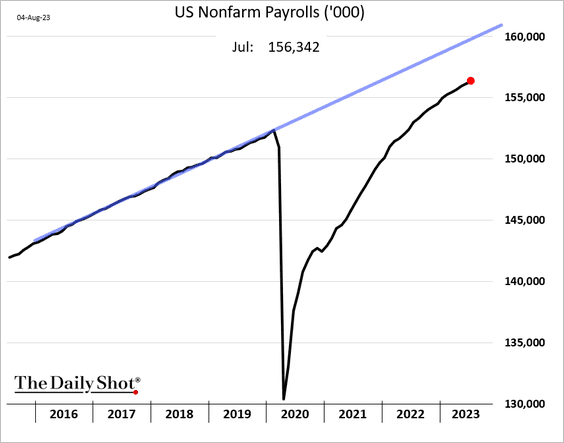
Payroll numbers came in last week and there's a drop in job growth once more. We're still below our trend set before COVID started:
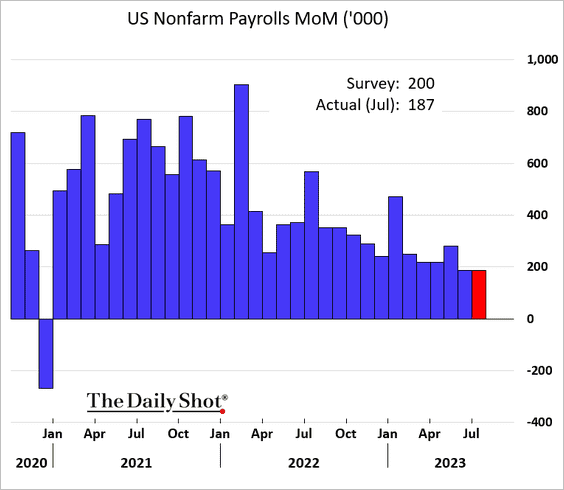
Many who watch the market closely are enjoying these numbers since they suggest more interest rate hikes might not be necessary. Sure, we have very low unemployment right now, but an unchecked increase there could cause problems. Hourly workers are receiving less hours per week:

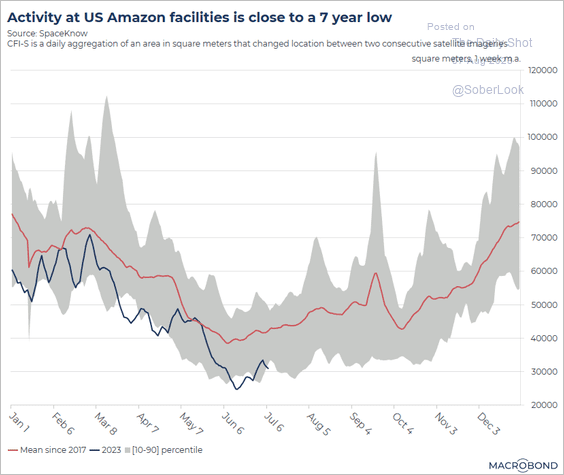
Auto repossessions are up sharply, new housing starts are low, housing costs remain high, and student loan forbearance is ending soon. This could tighten the budgets of many families and some argue this has already started:
Lots of mixed data here. On the macroeconomic front, I'm feeling very cautious right now. But while we're on this topic:
All investments come with significant risks, including the loss of all capital. Please do your own research before investing, and never risk more than you are willing to lose. I hold no certifications or registrations with any financial entity.
Let's dig into AMD and TSLA.
AMD
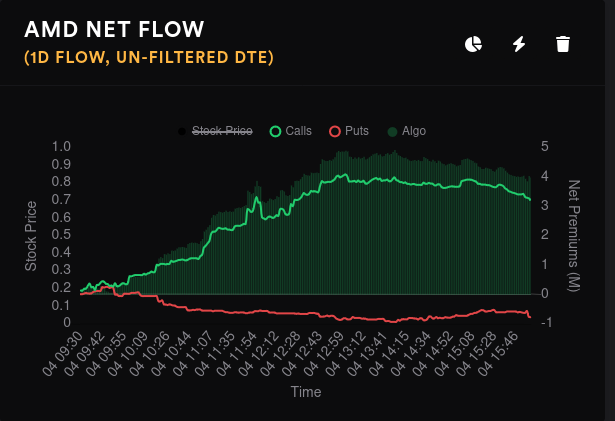
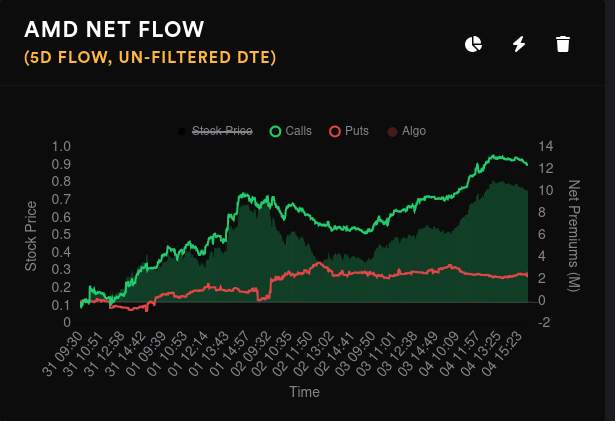
AMD and SPY had almost identical net options flow for Friday. There was plenty of bullishness up front as we rocketed up to $117 but then it tapered off as the afternoon went on. We still managed to finish the day above $115, though!
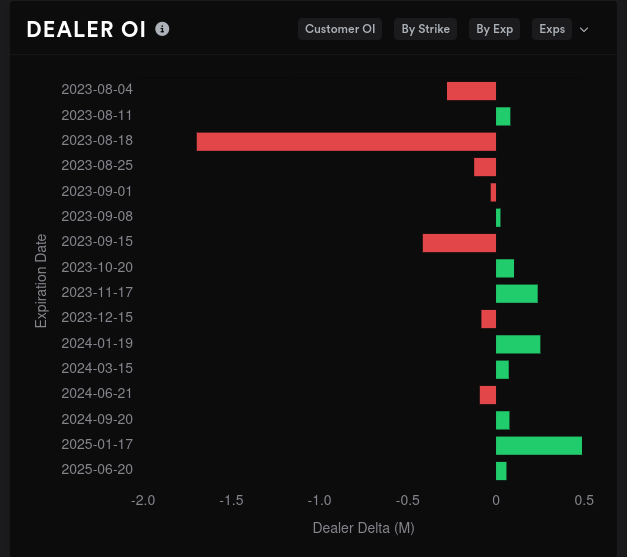
On a 15-day momentum, dealers are still short AMD and that suggests that customers in the market are still bullish on aggregate. 8/18 looks like AMD's most bullish upcoming expiry, followed by 9/15. Other expiration dates look undecided but they lean bearish. We have some positive vanna on 8/18 but it turns bearish for 9/15. Vanna starts working against us heavily in January.
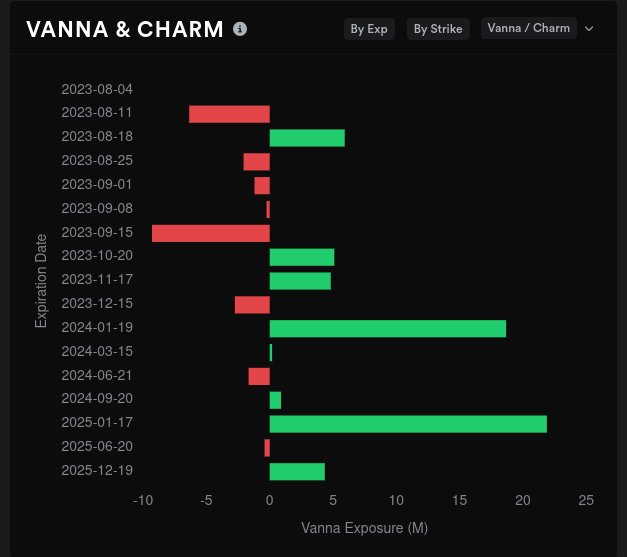
Since 8/18 looks like our most bullish expiry and we know there's positive vanna there, let's get some more detail from Volland. We have strong negative vanna at $115 with an equal amount of positive vanna at $120. There's nothing to speak of past $120, though:

At this point, I'm thinking our $110-$115 range might have just moved up to $115-$120. Can we confirm that elsewhere?
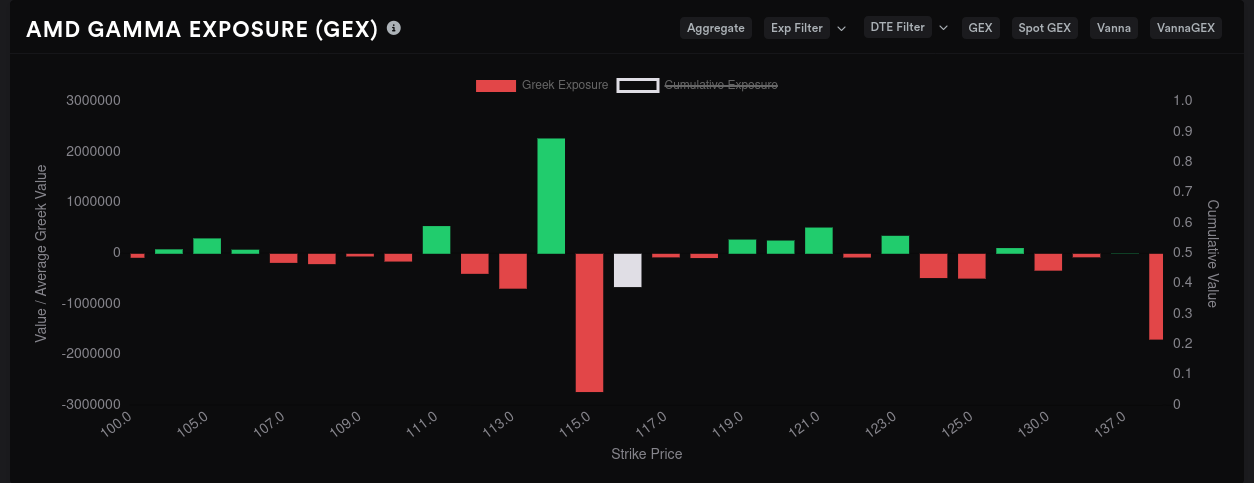
Aggregate gamma exposure (GEX) for AMD shows $115 as the biggest price magnet with $114 and $111 providing some potential resistance to downward moves. On the upside, there's not a strong resistance level:

Which expiration dates should we examine for GEX? These will likely shift a bit since we just finished a big one, but it looks like 8/11 and 9/15 are the ones we should look at for now:

8/11 GEX shows downward resistance at $114. Our biggest price magnet is $115 and the upside isn't really capped by a significant bar. However, we do know that the fuel from vanna taps out once we are about 0.15-0.35 delta from $120, and that's likely around $118.
I can't leave out 8/18 as it's a monthly OPEX with plenty of volume. Our biggest magnet here is $120 with upside resistance at $121, $125, and $130.
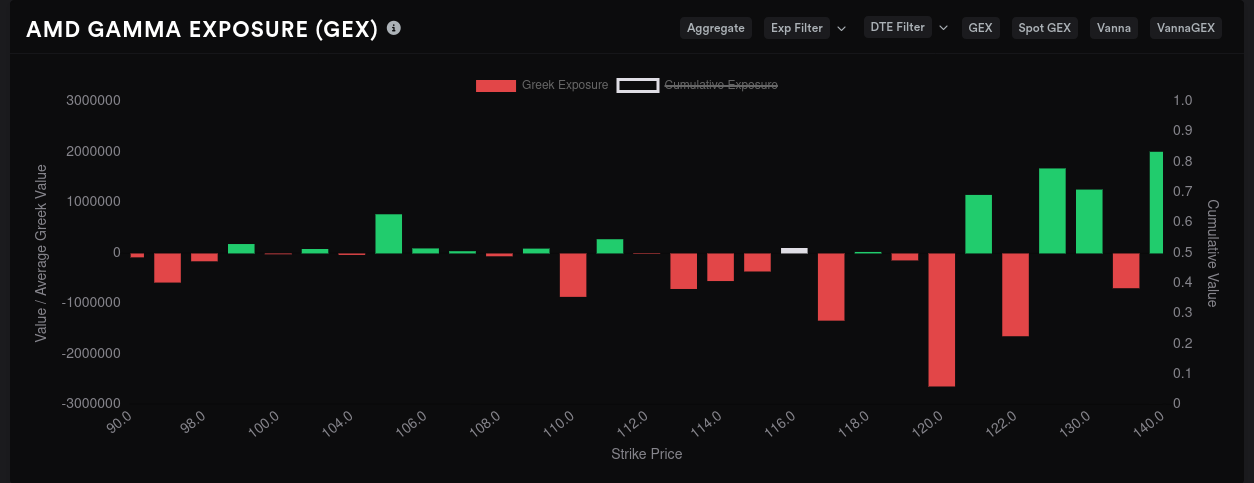
9/15 paints an interesting picture. $115 is the biggest price magnet with $120 becoming the resistance. If we can get over $120 and hold (which looks very unlikely), we might be able to hang out up there for a while. The more likely scenario is that AMD gets bumped back down into a $110-$120 range.

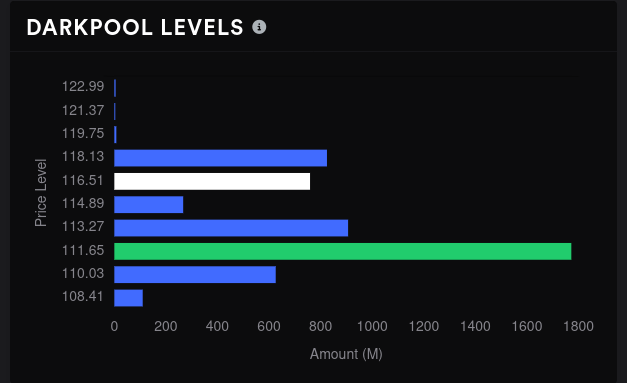
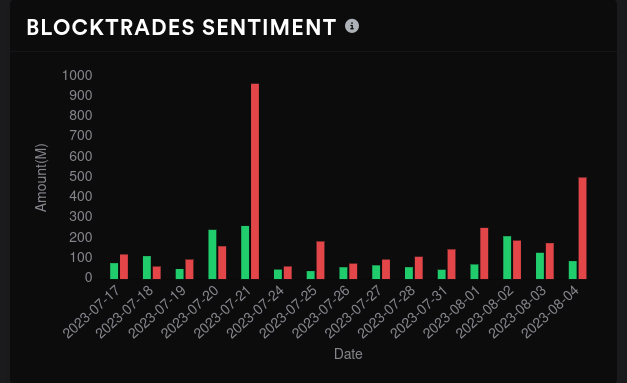
Can dark pool trades help to confirm? Possibly. Our biggest level is unmoved at $111.65 with almost $1.8B in volume. However, we have some secondary levels building out from $116 to $118. Sentiment is becoming more bearish and Friday saw a steep move to the downside. There's a risk that this new dark pool buildout in the upper $110's could become resistance instead of support.
TSLA
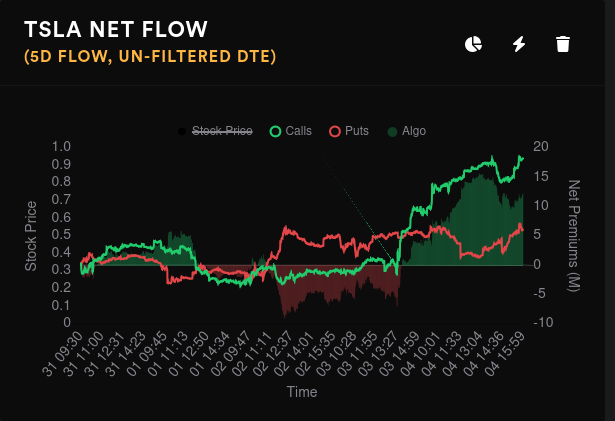
As I mentioned yesterday, TSLA's chart gave me pause as volume came down and price seemed to drift downwards without much purpose. TSLA's options flow last week was a mess but Friday showed some bullish potential even as price slid downward:

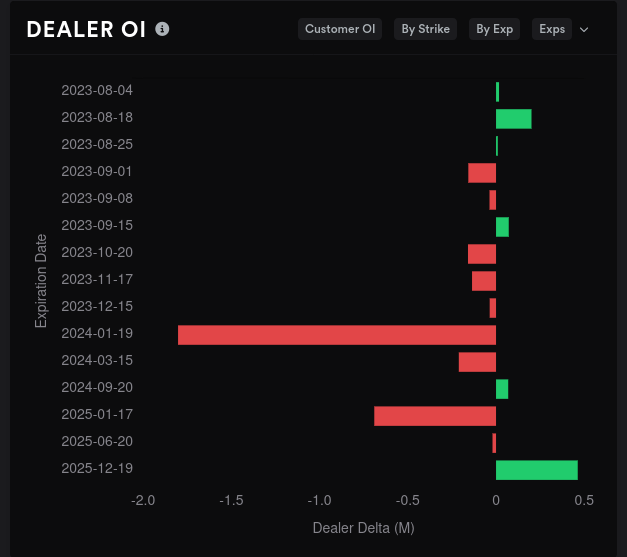
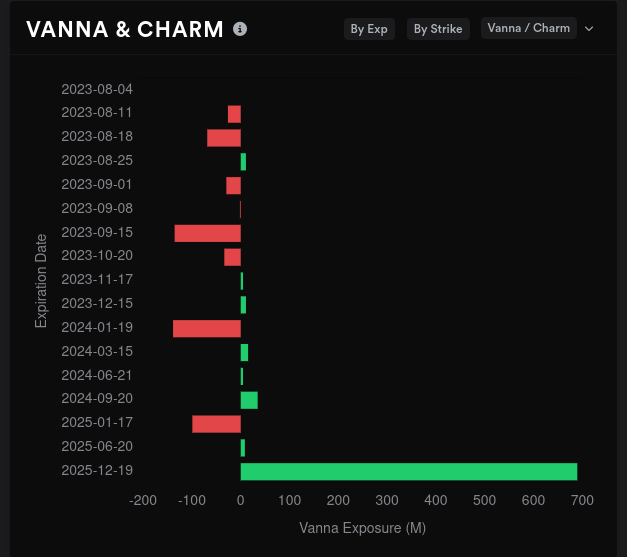
Dealers are long TSLA which implies customers are taking on bearish positions on aggregate. There's not a clear direction for dealer open interest until we reach January 2024 when things turn incredibly bullish. 8/18 looks slightly bearish. Vanna is almost entirely negative with the exception of far-dated LEAPS contracts in 2025.
TSLA sits just under $255 this morning and aggregate GEX shows we have some big price magnets to $255, $262.50, and $270. We have some downside resistance around $245 (where I drew a support line on my charts) and there's still some upward resistance at $267.50:

8/11 and 9/15 look lik the most important expiration dates for GEX:
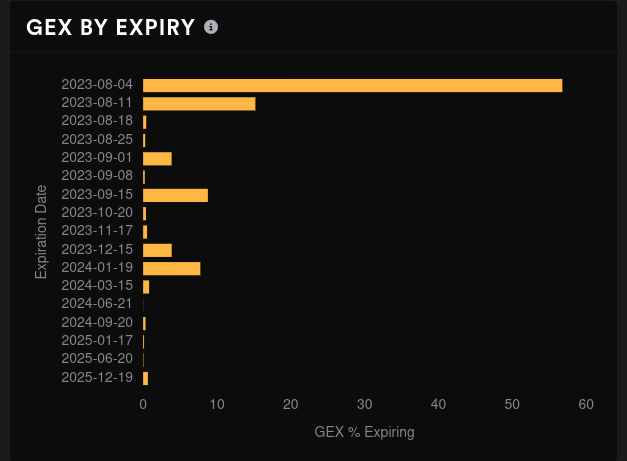
GEX for 8/11 shows a big price magnet at $270 and a secondary magnet around $250. Resistance from positive GEX seems fairly minimal here, which suggests price could run. In this lower volume environment, that could result in some wide price swings.

9/15 paints a clearer picture. $270 is the obvious target here with a potential move to $280, too. A small amount of downside resistance shows up around $260.

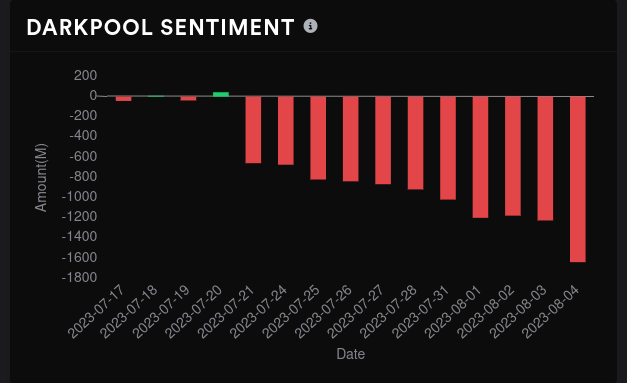
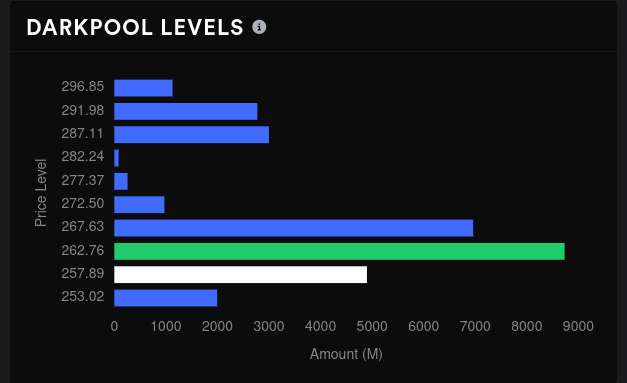
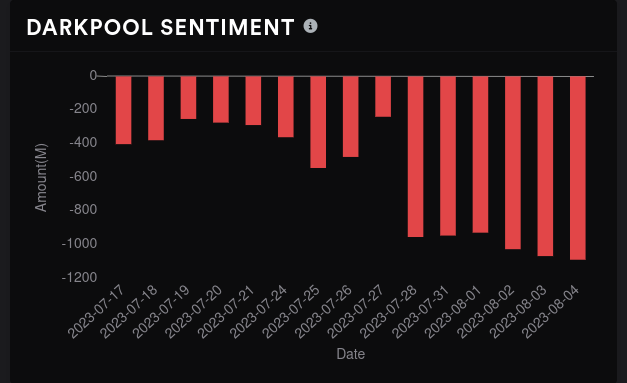
So the window for TSLA movement seems to run from $250-$280 through 9/15. What do dark pool trades tell us? Sentiment is definitely negative, but our biggest volume levels run from $258-$268 yet again. These have not moved much but the length of the bars has come down a bit.
Thesis
I feel comfortable making bets on AMD from $110-$120 in the short term but climbing over $120 seems unlikely. We have no dark pool volume up there, GEX provides upside resistance there, and the pull from vanna dies out once price reaches the $117-$118 zone. There's nothing I can find that would allow AMD to keep running over that level.
As a bit of good news, there's plenty of data to suggest that a drop under $112-$114 is unlikely barring other news.
As for TSLA, I don't like the current low volume price action. Putting a range on this one sure does seem difficult, but it looks like $250-$260 could be a solid range through 8/18 and then everything opens up to about $280 by 9/15. However, I can't find anything in TSLA's data that could provide enough fuel for that run.
In other words, the walls come down for TSLA's upside move but it seems like the battery isn't charged up for a run. 🔋 🤷♂️
Good luck to everyone out there. 🍀
Discussion