Another look at MSFT for July 30th

Microsoft posts earnings results this afternoon when the market closes, but what does the current data tell us? Let's break down vanna, institutional trades, and the price action from the chart. 📈

Happy Tuesday! We're waiting on the Federal Reserve interest rate decision tomorrow and it could give us hints on where the market might be heading into September. I thought this was a good time to check in on Microsoft's charts since it's heading into its earnings call this afternoon after the market closes.
All investments come with significant risks, including the loss of all capital. Please do your own research before investing, and never risk more than you are willing to lose. I hold no certifications or registrations with any financial entity.
Let's dig into some data.
Chart
The MSFT daily chart below starts in January 2024 and shows a great rally into April followed by another rally into early July. Then the bottom fell out:
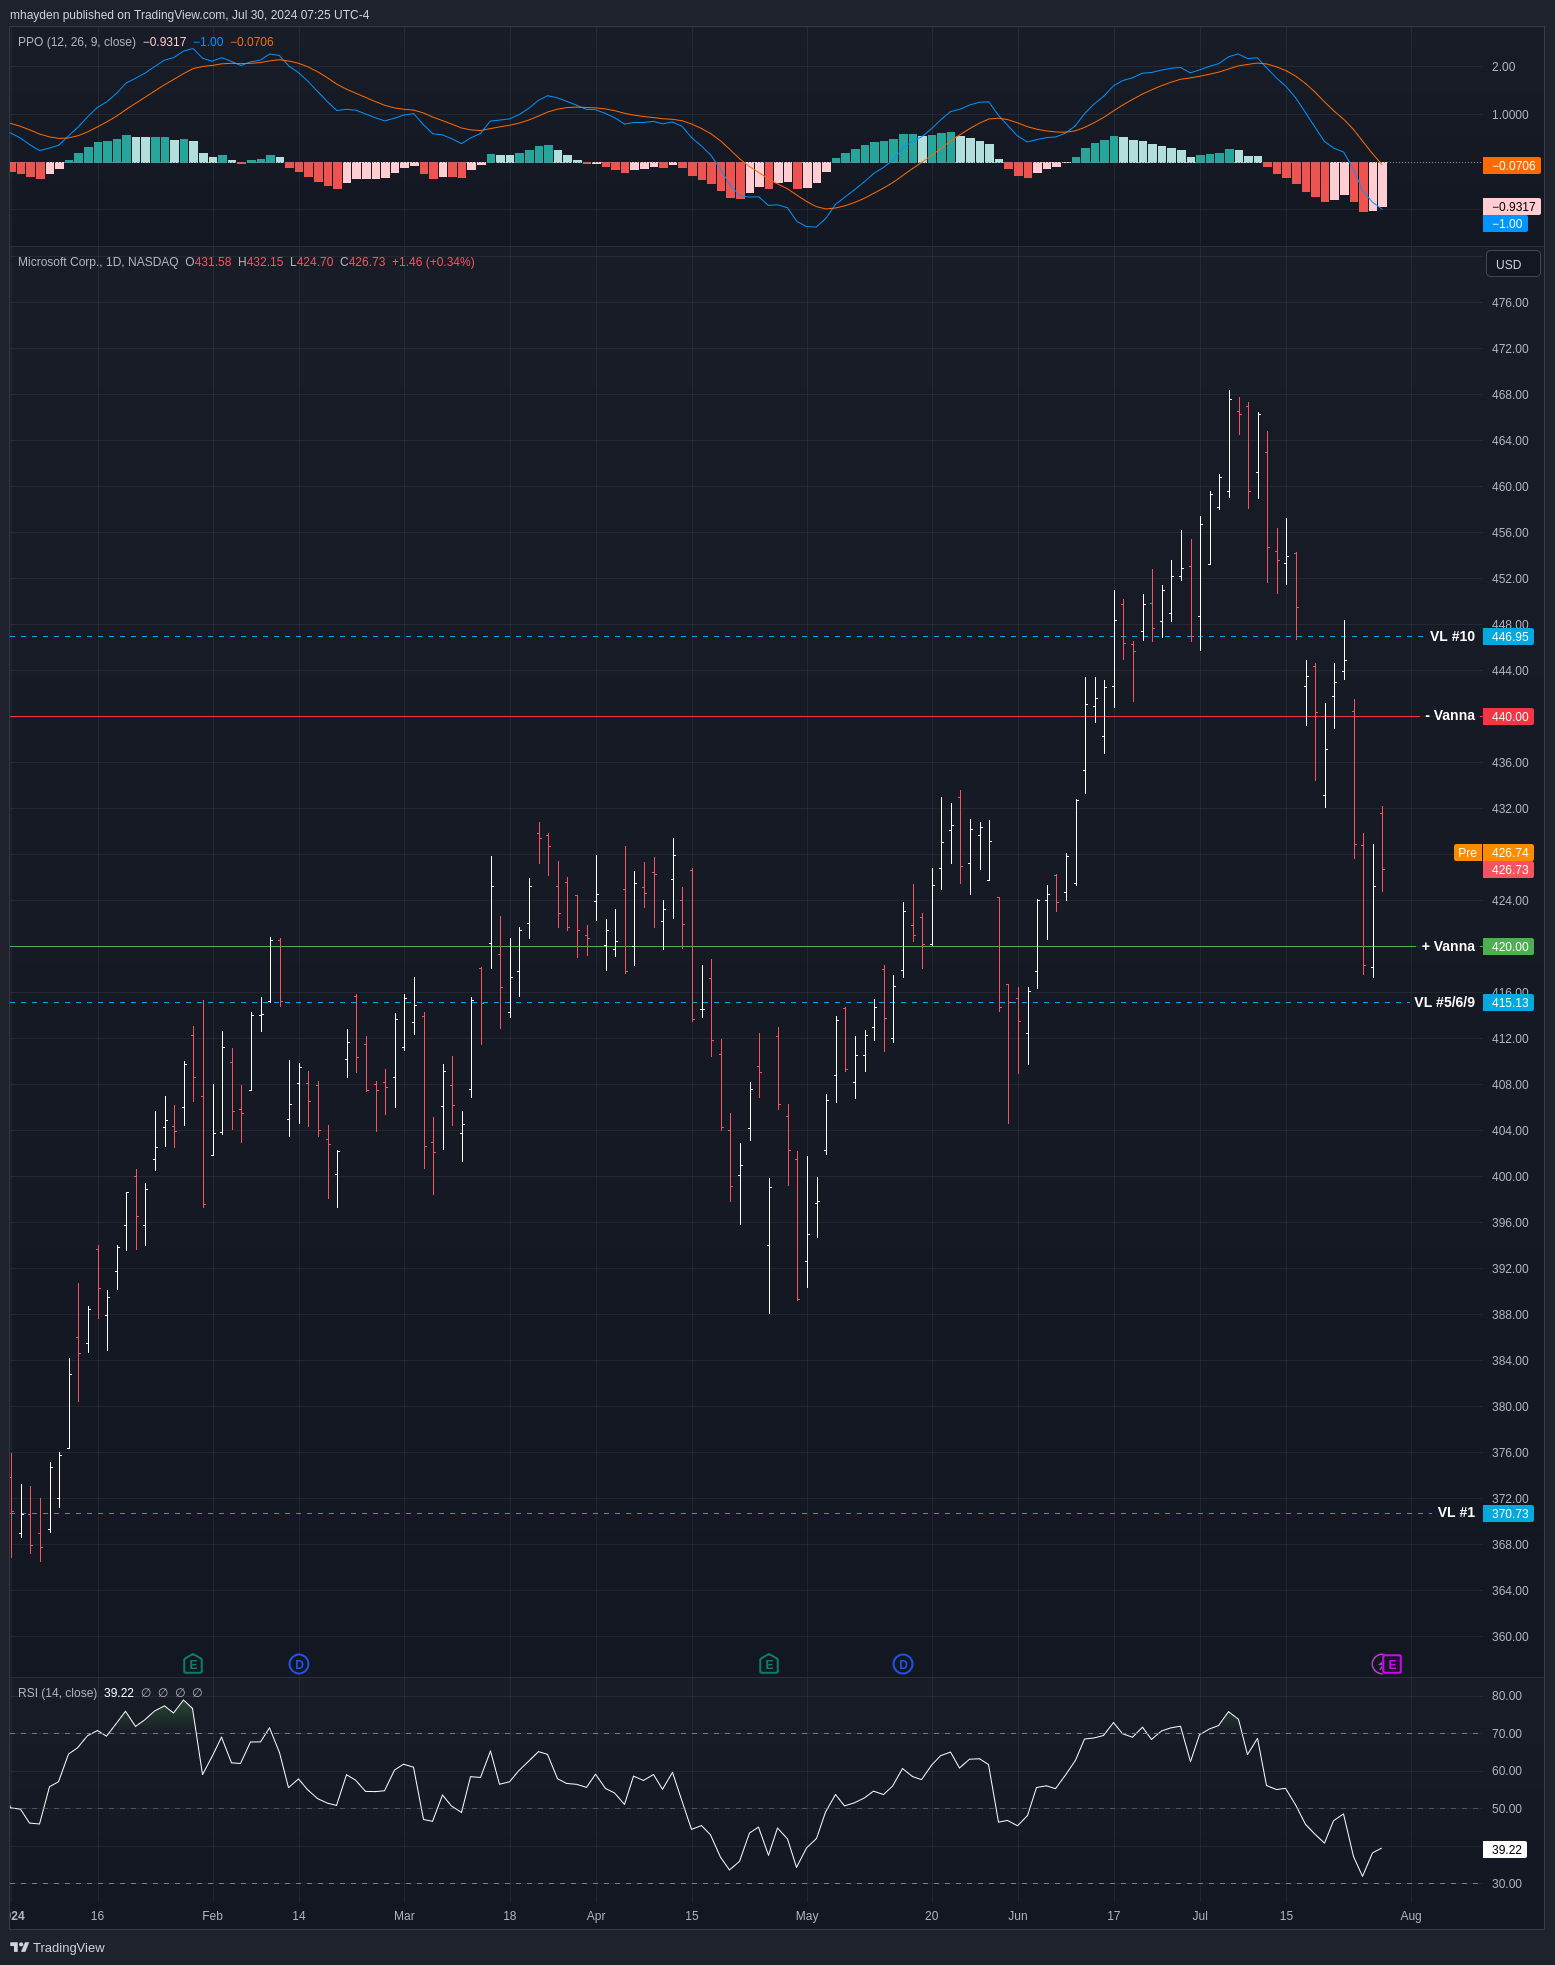
Both the PPO (top) and RSI (bottom) indicators confirm that the new highs were made on stronger momentum. The RSI bounced off the 30% level Friday but the PPO remains firmly below zero with the fast line moving down faster than the slow line.
You'll notice some lines on the chart that I've pulled from other data providers. The light blue dashed lines mark large institutional trades from Volume Leaders and the vanna lines come from Volland. Note that MSFT recently bounced in the $415-$420 area and that's a location with a lot of positive vanna exposure and the 5th, 6th, and 9th biggest trades ever made on MSFT.
Vanna
I decided to join Volland once more to get an idea of where dealers are hedging the most customer trades. Volland delivers lots of extremely detailed (and challenging) data about how market makers are hedged, which gives you some hints about where customers in the market might be trading. Their main focus is on charm and vanna.
In a situation where implied volatility is steady or decreasing, you can look at positive vanna (green) as a magnet for price. Negative vanna (red) typically acts like a repellent and pushes price away (in both directions).
How does MSFT's chart look?
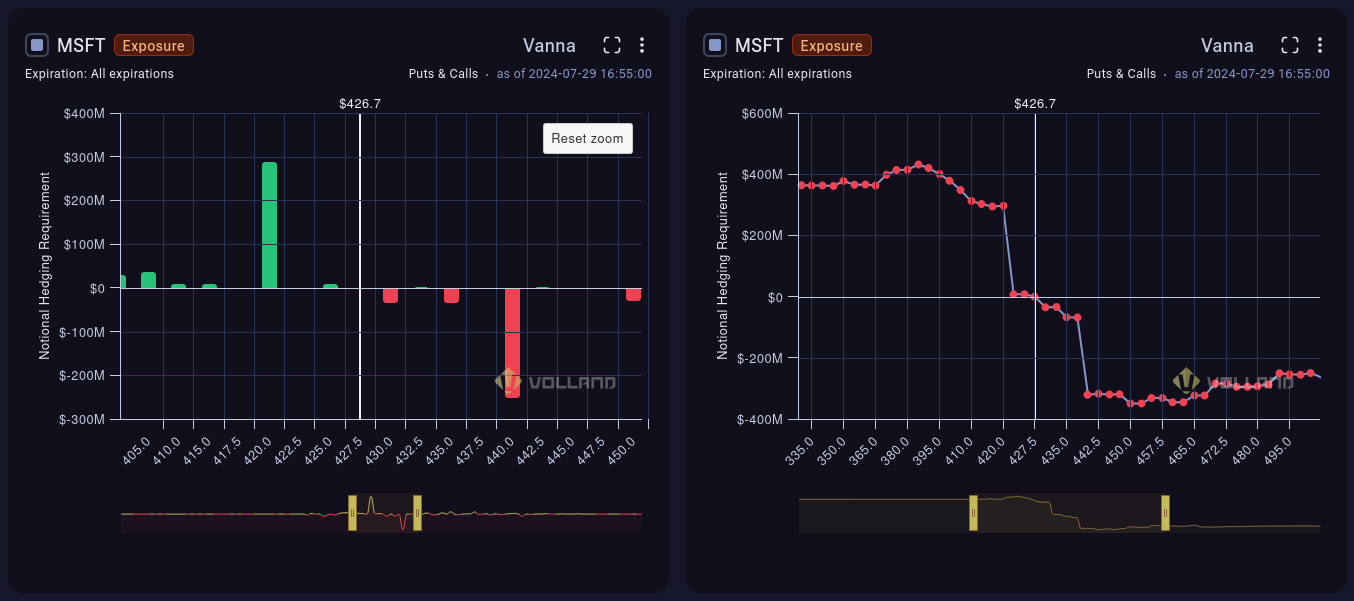
The chart on the left shows specific vanna levels and the strike price associated with each. We can see that $420 is a strong positive vanna level and should act like a magnet while $440 is negative and should push price away.
The chart on the right shows that there's supportive vanna levels underneath the current price, but there's nothing above the current price to help with pulling price upward.
With that said, MSFT has positive charm, which is generally bullish. The notional value of charm is nearly double that of vanna, so we could see some upside that is limited to $440.
Institutional trades
Volume Leaders highlights large trades made by institutions and these levels can help you identify support and resistance levels. The area just under $420 has received a lot of attention this year and that's where MSFT just bounced:
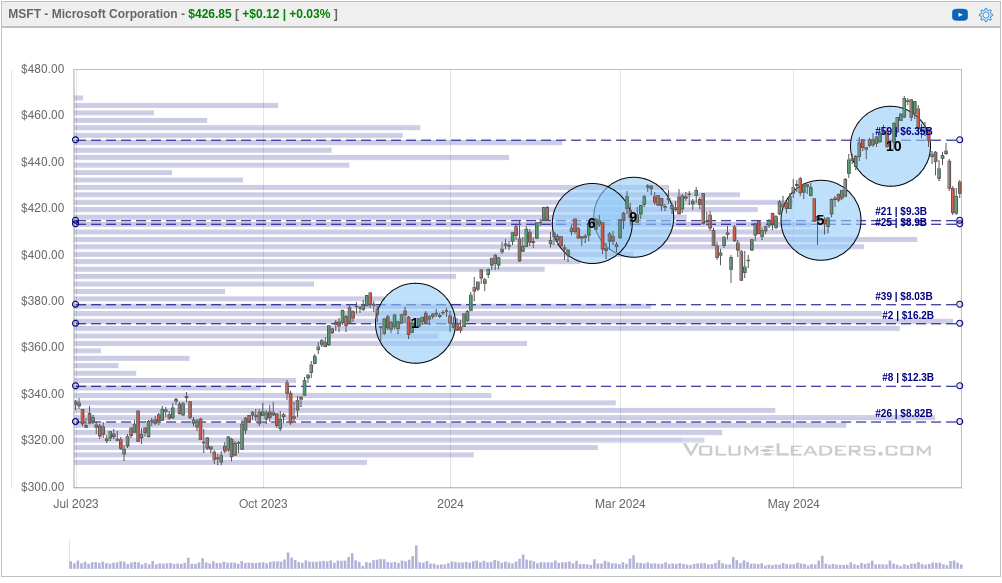
The largest trade ever made in MSFT was in December 2023 around $370.
The recent #10 trade follows a pattern I've seen a lot recently where a large trade comes through and then a stock has a blow-off top (as MSFT did in early July) only to fall back through that trade to a lower level. I've seen this on quite a few charts lately, especially semiconductors.
It's critical to remember that these big trades don't give you directionality. They could be simple entries or exits into longs or shorts, but they could be part of a complex hedging strategy for portfolios.
Thesis
Earnings are challenging to predict and should always be treated with caution! MSFT could post incredible results and correct downwards 20%. They could also publish terrible results and rally upwards another 20%. Every trader is looking for something different in the market and that's tough to gauge, especially for a novice trader like me. 😉
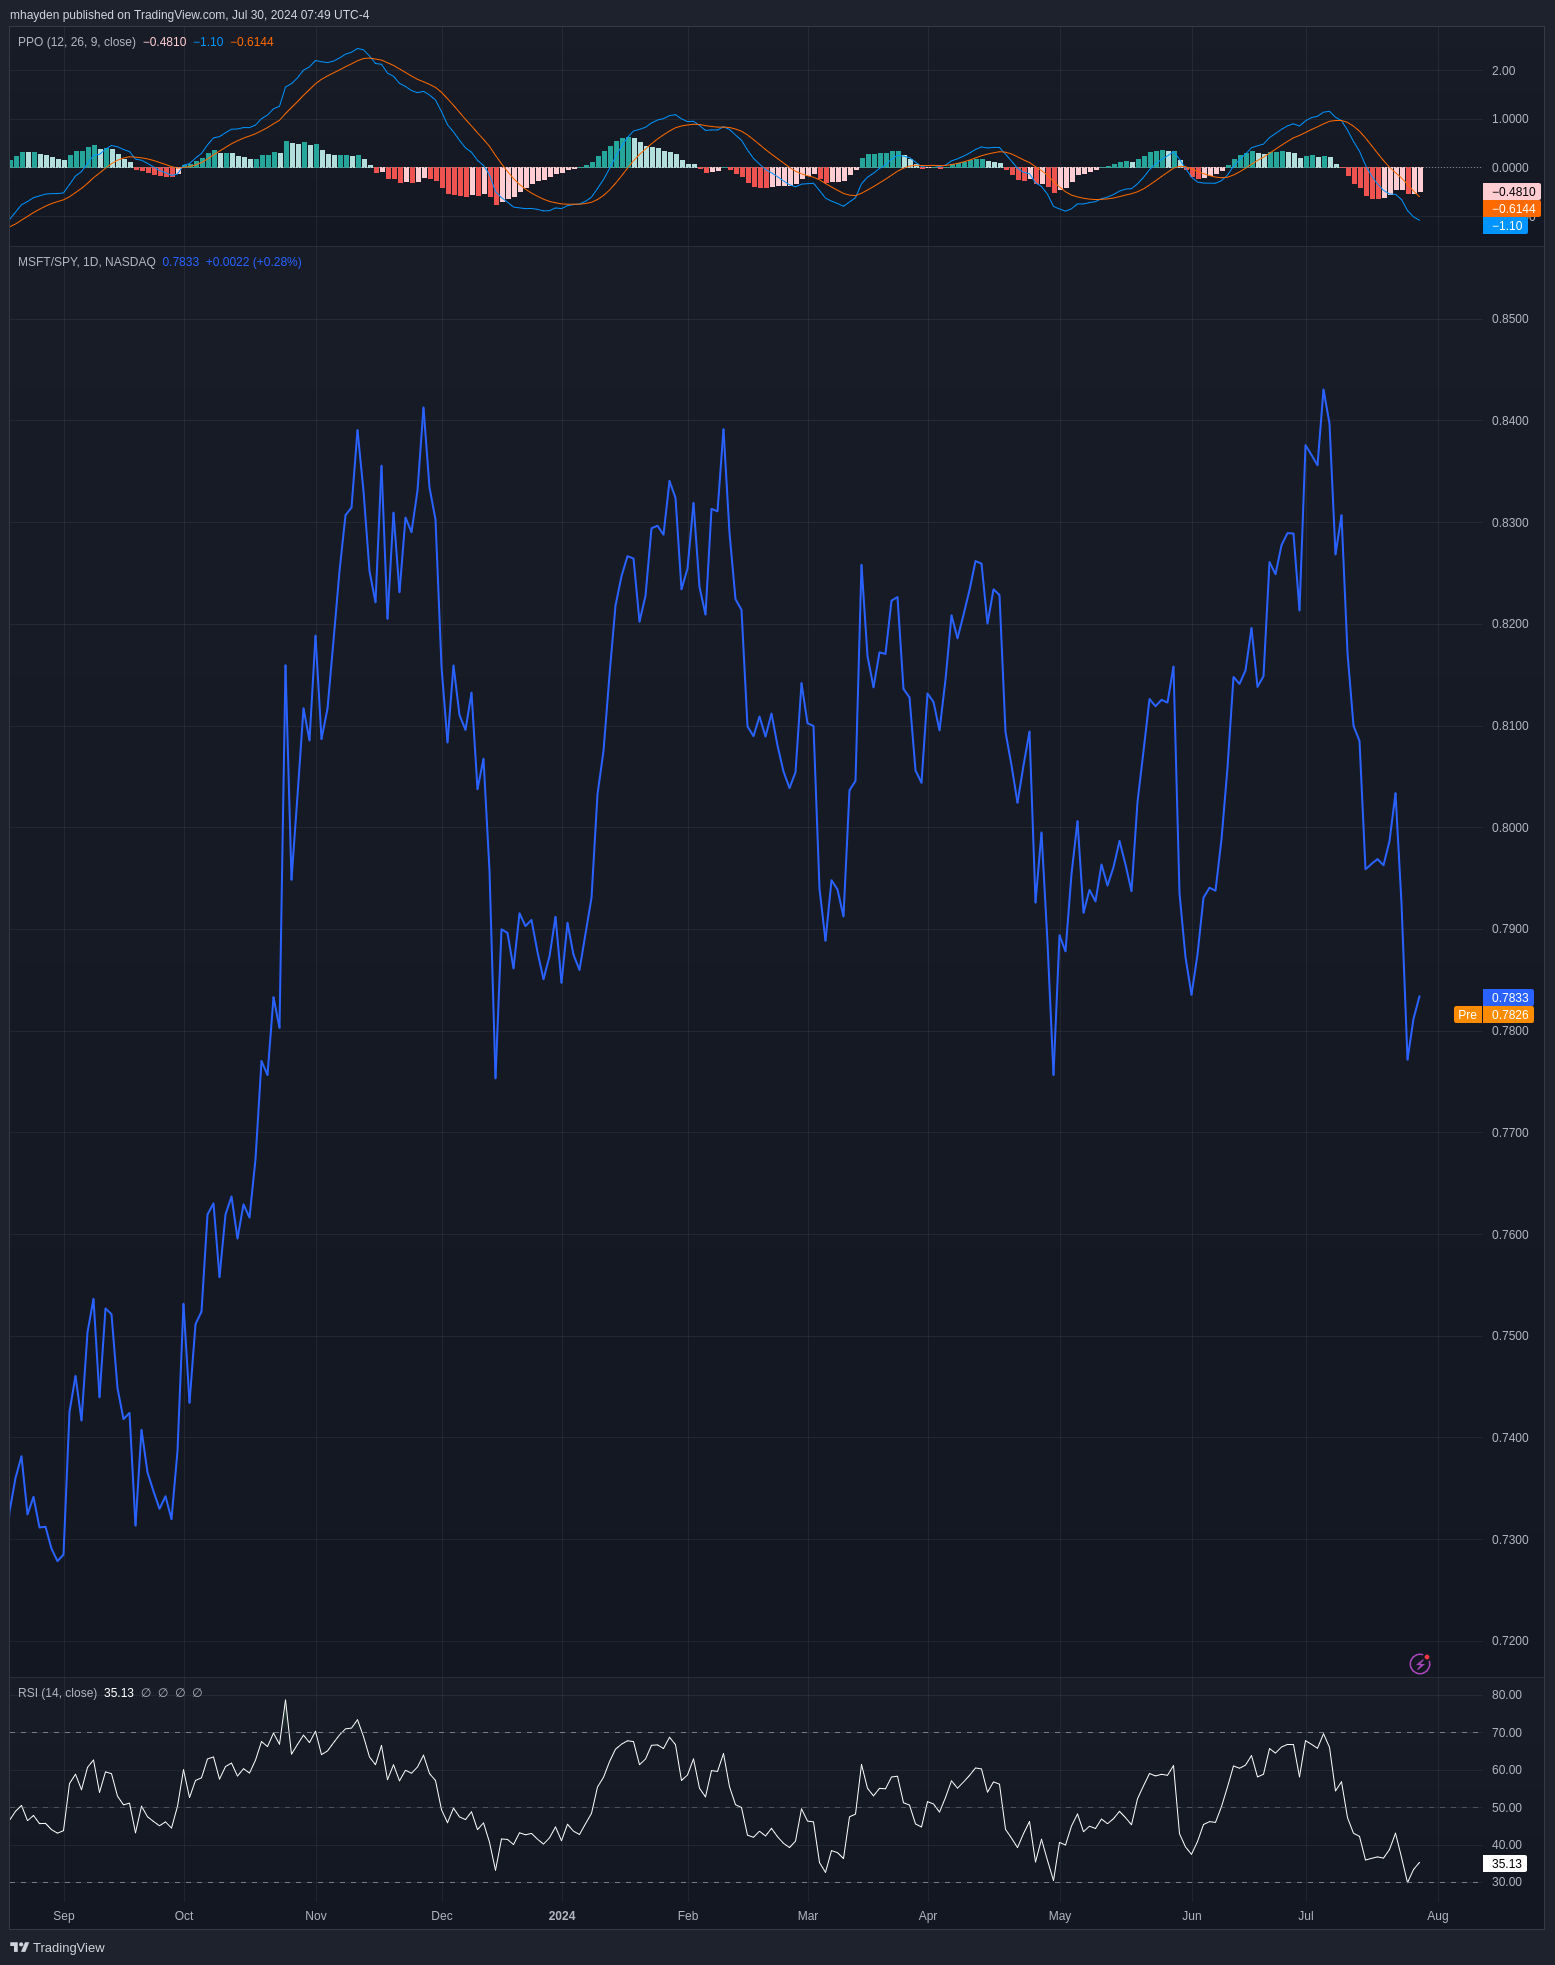
One important thing to note is that MSFT has tried to outrun SPY three times since November and has been pushed back by the rest of the market three times. Bear in mind that SPY was increasing during this entire time, but MSFT has failed to gain a bigger share of SPY since November 2023:
Good luck to everyone today! 🍀
Discussion