Broad market look: SPY & SPX

With all of the earnings news on the way this week, how does the broader market look? Let's dive into SPX and SPY today. 🏊

With AMD covered yesterday and TSLA coming up on earnings Wednesday, I thought it might be a good idea to check in on the broad market. I'll be taking a deep dive into SPY/SPX in this post.
It's key to remember that SPY and SPX have very different characteristics and traders make different bets on them. For example, you can be assigned shares of SPY at expiration but SPX is cash settled. You also can be assigned shares early on short SPY options but SPX options are settled upon expiration. Contract sizes are quite different, too.
All investments come with significant risks, including the loss of all capital. Please do your own research before investing, and never risk more than you are willing to lose. I hold no certifications or registrations with any financial entity.
Time to dig! ⛏️
Vanna
I like starting with vanna here because it paints a picture of price boundaries. On the simplest terms, vanna is a measurement of how much deltas will change when the implied volatility changes. This movement of delta must be properly hedged by market makers, or dealers, and if we know the levels where they need to adjust their hedges, we can make higher probability trades.
Nothing is 100%, but if you can increase your edge from 50/50 to 55/45, that's tremendous.
Decreasing implied volatility (IV) generally pulls price upwards to positive vanna levels. Increasing IV generally pulls price downwards to large vanna levels. Negative vanna levels do the opposite.
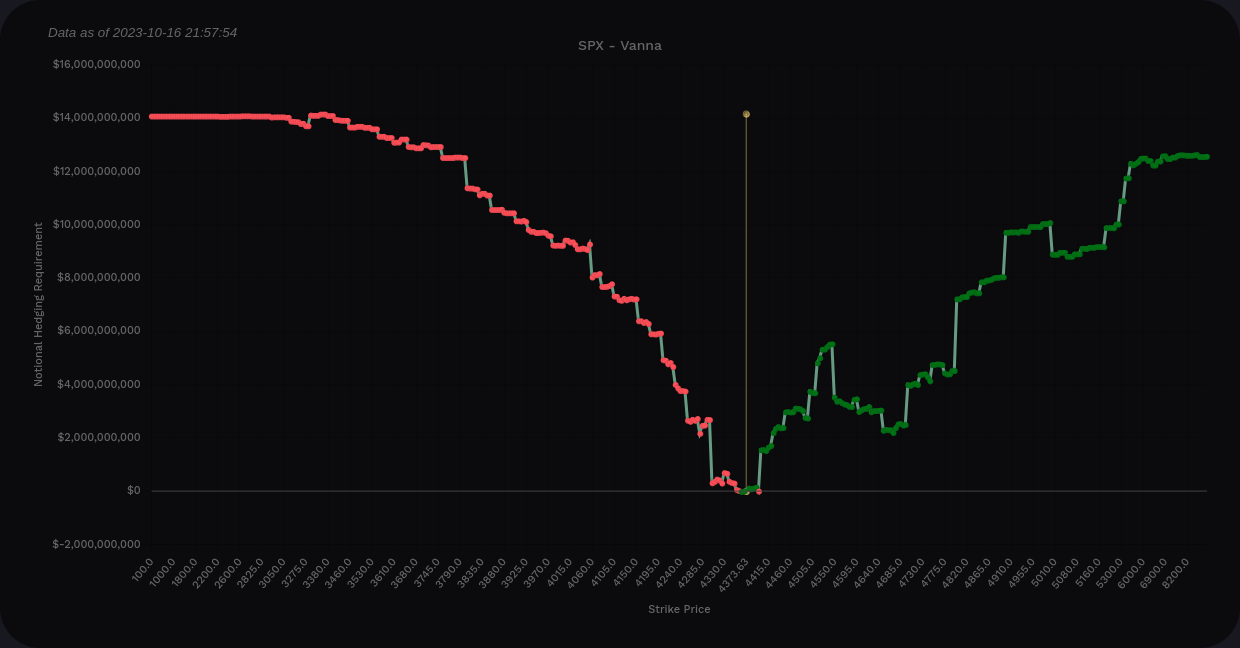
First up is SPX. Starting with the curve chart, we see that vanna is quite positive at the left and right extremes. This suggests that increasing IV will very likely push price downwards.
My next thought is: How far up or down would we probably go? Our next big level above is right around 4400 and then we get a couple of levels around 4500. The negative vanna at 4550 looks like a big stop sign. 🛑
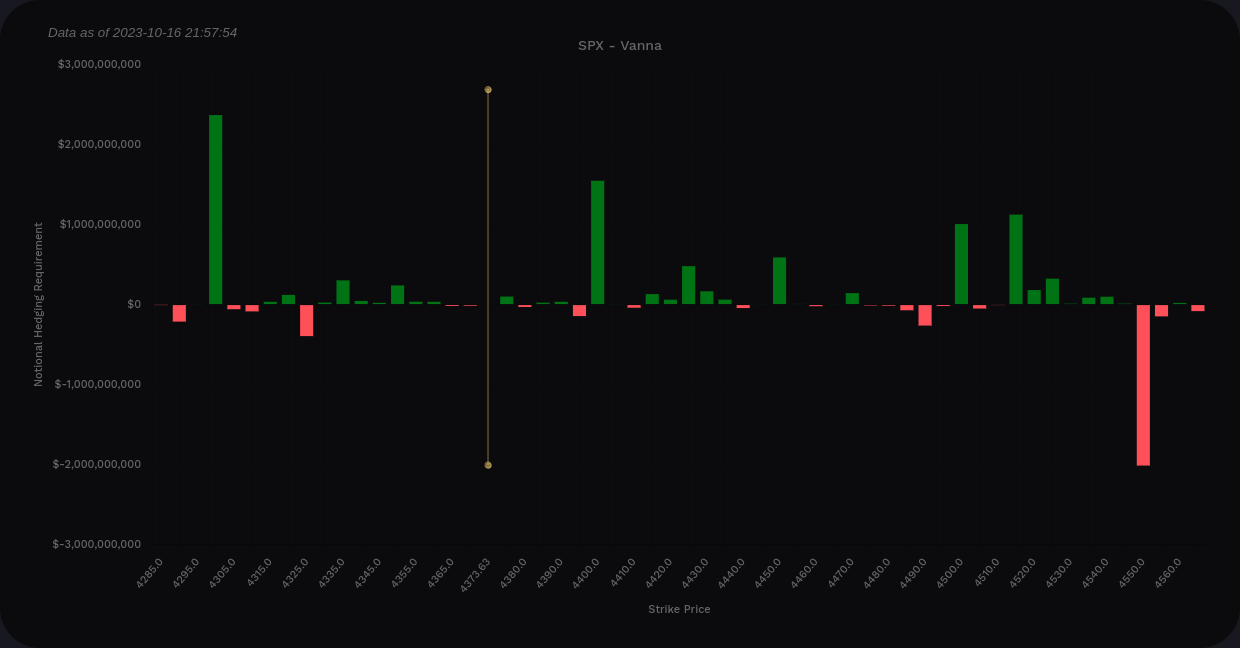
SPX vanna from volland
If we move down, 4300 looks like a decent wall.
This is really interesting to me as we recently had almost zero positive vanna past 4100 and we had a huge negative gamma wall around 4480. That disappeared.
Can we see that same shift in SPY?
Remember that SPX is generally about 10x the size of SPY. This relationship varies a little from time to time because of dividends from SPY and there's an expense ratio for SPY from the ETF's management firm.
SPY's curve shows positive vanna on both ends, but the right side looks much lower. There's also a big negative dip above the current price that I saw in SPX over the last few days but it disappeared for SPX.
The bar chart shows the last bits of positive vanna topping out around 440/441. The big negative vanna stop sign is at 448 and this hasn't moved in several days.
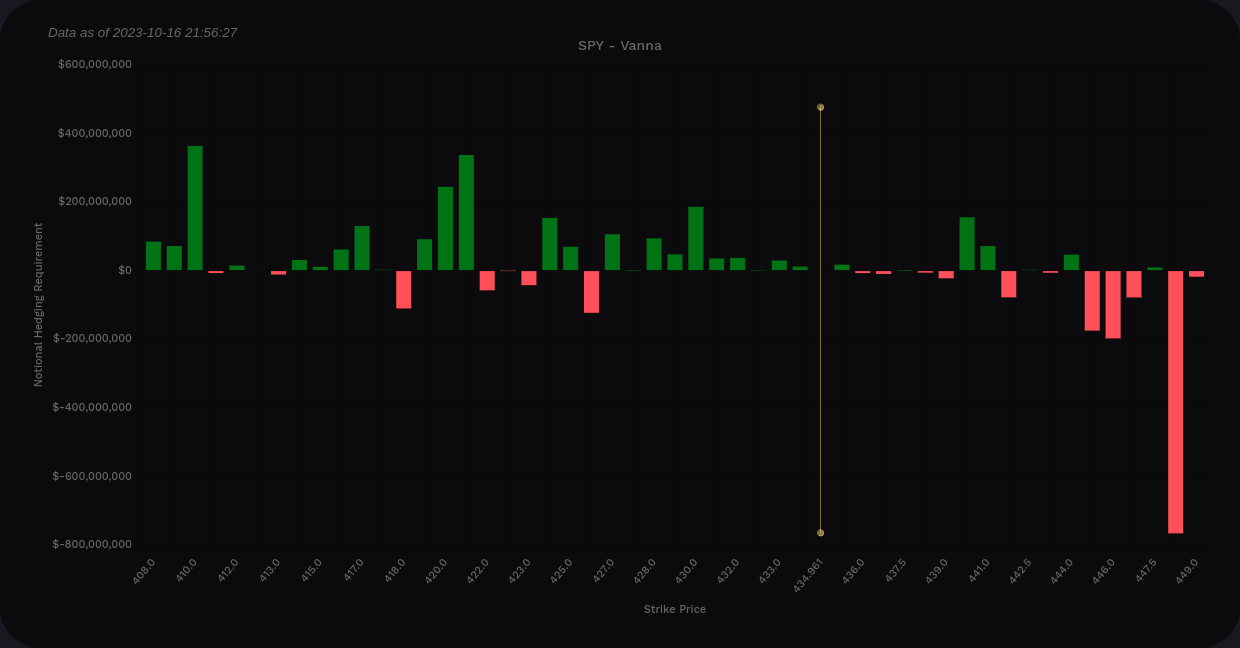
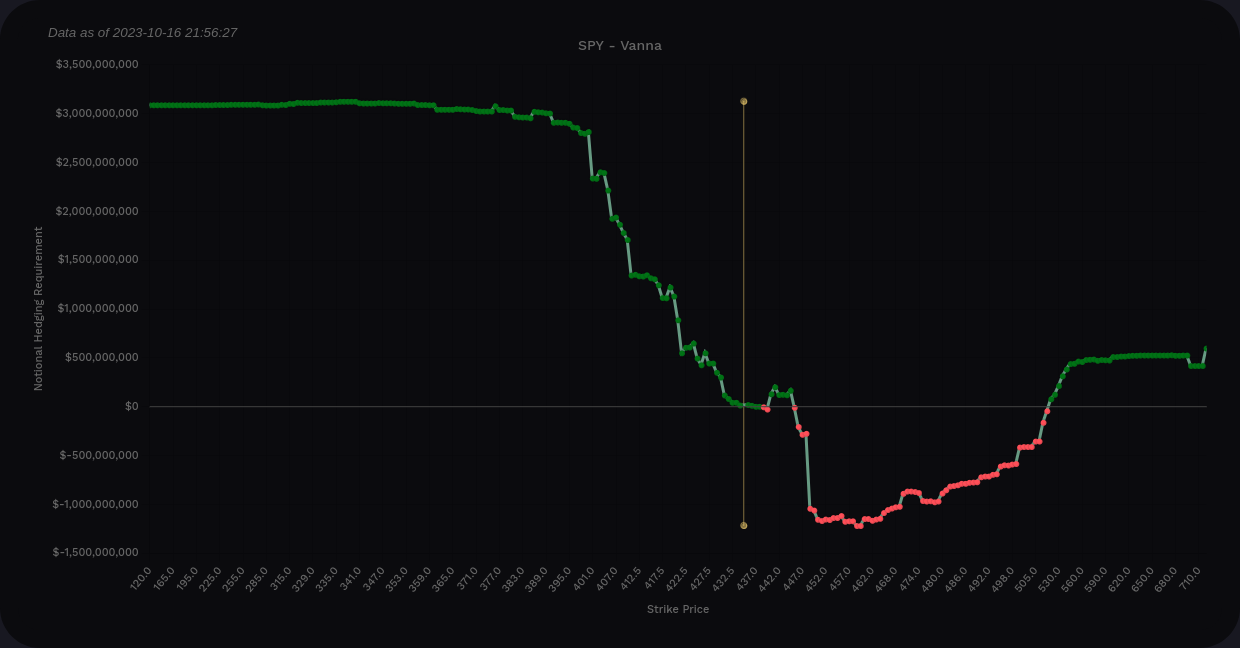
SPY vanna from volland
If we move down, we get bits of light resistance down to about $424 with a decent support level at $421. Beyond that, it's $410.
I'm not sure why there's such a discrepancy between SPY and SPX vanna above price here. It's not dividend-related because SPY did its dividend in September. My guess is that there are different hedging dynamics in play, but I'm honestly not sure. (If you know why, please let me know and I'll update the post!)
Options flow
The flow of options contracts broadly across the market looked bullish yesterday.
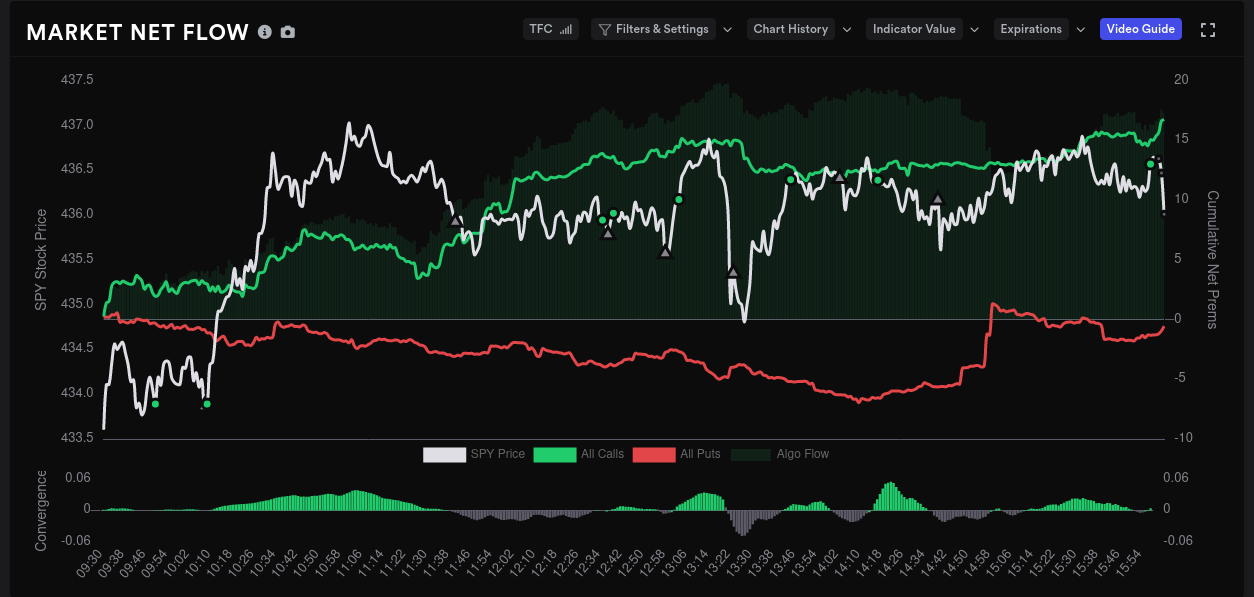
There's been plenty of back and forth over the past five days with premiums increasing on both the bullish and bearish ends.

Dealer positioning
SPY's dealer deltas, which measures the delta of contracts piling up on dealers, started going short earlier in October and peaked around October 5th. Since then, it has come back towards the middle line and it swung slightly long.
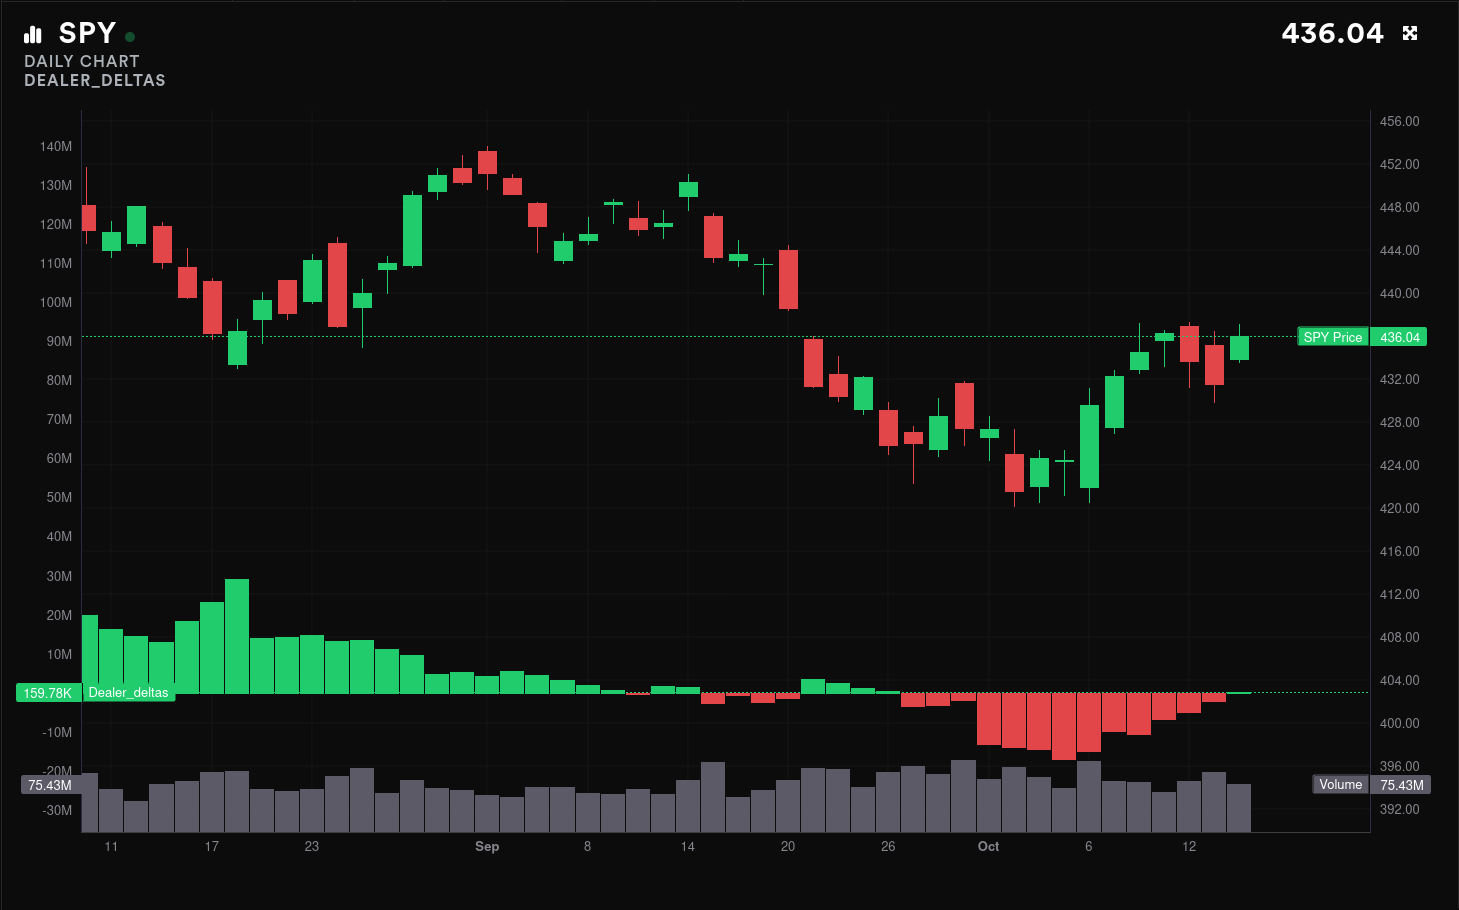
What does this mean? Well, when you buy a call in the market, a dealer shorts a call on the other side. By tracking these dealer trades, we can make a guess at what customers in the market are doing. If dealers were recently short and now slightly long, we can argue that customers were recently long and now slightly short.
In other words, customers in the market have changed their sentiment from bullish to slightly bearish.
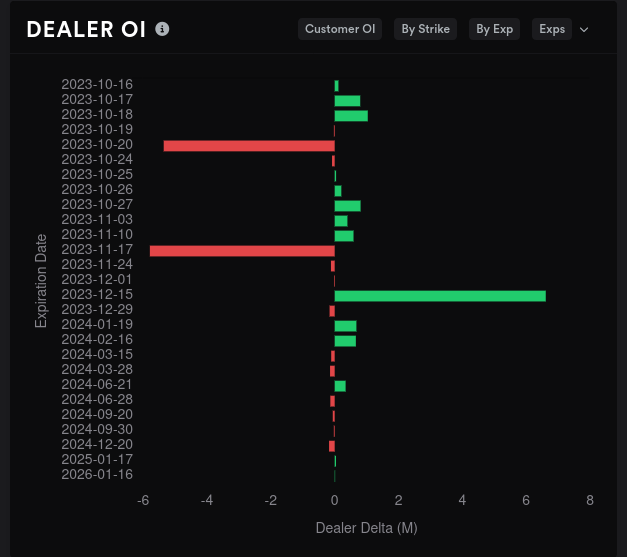
That's interesting, especially when you check dealer open interest and see that customers are bullish going into 10/20 and 11/17:
Gamma exposure
SPY's overall GEX shows that we're in an area of negative GEX that runs from 433-437. Generally, the tallest red bars on this chart can become magnets for price if it runs near those lines. Those lines here are 421, 425, and 430.
Tall green lines are positive GEX and they often repel the price – but they can repel and add momentum in both directions. If price manages to move past a green bar, that green bar can give price a little extra momentum.
Our biggest resistance appears at 424. We have positive vanna here, too.

If we look at 10/20 data in isolation, we see room to run between 429-436. Resistance shows up at 424 (third time we have seen this level).

Whale trades
Traders that throw big money into options contracts can also give us some clues about where the market is headed. On the aggregate, some traders are really arguing back and forth about $420. 😆
$420 took a tremendous bearish dip to $39.5M in premiums but it now is on a run back to the middle line with only about $19M in bearish premium. $435 and $425 are also slightly bearish.

10/20 shows $425 going bullish but slowly coming down. $430 and $440 have gone slightly bearish.

11/17 shows that most of our arguments about $420 are here. There's definitely some disagreement about where SPY might be through the earnings season.

Chart
SPY has made a lot of fair value gaps on the daily chart lately. Often these gaps become magnets to get filled, like traditional gaps on charts, but sometimes they can become new support or resistance lines.
Above price, we have that gap from $436-$438 that still needs to be filled. We run into a very small order block near $448 from 9/14.
Below price, we have fair value gaps again at $432 and $426. If we fill those, we have the equilibrium zone from $422-$418. Losing that $420-ish zone would be pretty painful.

LuxAlgo's indicator suggests that money flow is slightly bullish, but it believes our current trend is still bearish even though we broke a trend line. If we can break through the gap just above the current price, there's a good chance that we could get some momentum up to $448-$450.
Thesis
This data is really mixed. We have evidence that shows we're stuck between $420-$440 for a while, we also see customer sentiment turning slightly bearish, but the weekly trend is still headed up. It feels like the market is holding its breath and waiting for something.
I look across most of the stocks I'm trading right now and they have similar patterns. They're trapped in tight trading zones by fair value gaps and narrow vanna channels. Perhaps the biggest traders in the market are waiting for some of the big earnings reports this week before they make their next move.
Either way, making trades this week feels a bit riskier than it normally would be.
Betting on the SPY $420-$440 range seems like a good plan in the short term, but it feels like we're charge up for a move one way or the other. Ensure you have a flexible trading plan, use care with your position sizes, and remember that not trading is a valid trading strategy.
Good luck this week. 🍀
Discussion