Charts Chat for September 10th

Sunday is a great day for looking at charts and plotting out a trading plan for the week! Today's post covers TSLA and AMD.

It's time to revisit the two things in the market that won't lie to you: price and volume! They both show up on every stock chart for free. 😉
I did a deep dive into SPY last weekend and I'll be looking at AMD and TSLA today.
All investments come with significant risks, including the loss of all capital. Please do your own research before investing, and never risk more than you are willing to lose. I hold no certifications or registrations with any financial entity.
Let's get to the charts!
AMD
I've been watching the volume weighted average price (VWAP) lines for AMD lately since three of the biggest ones are coming closer and closer together:
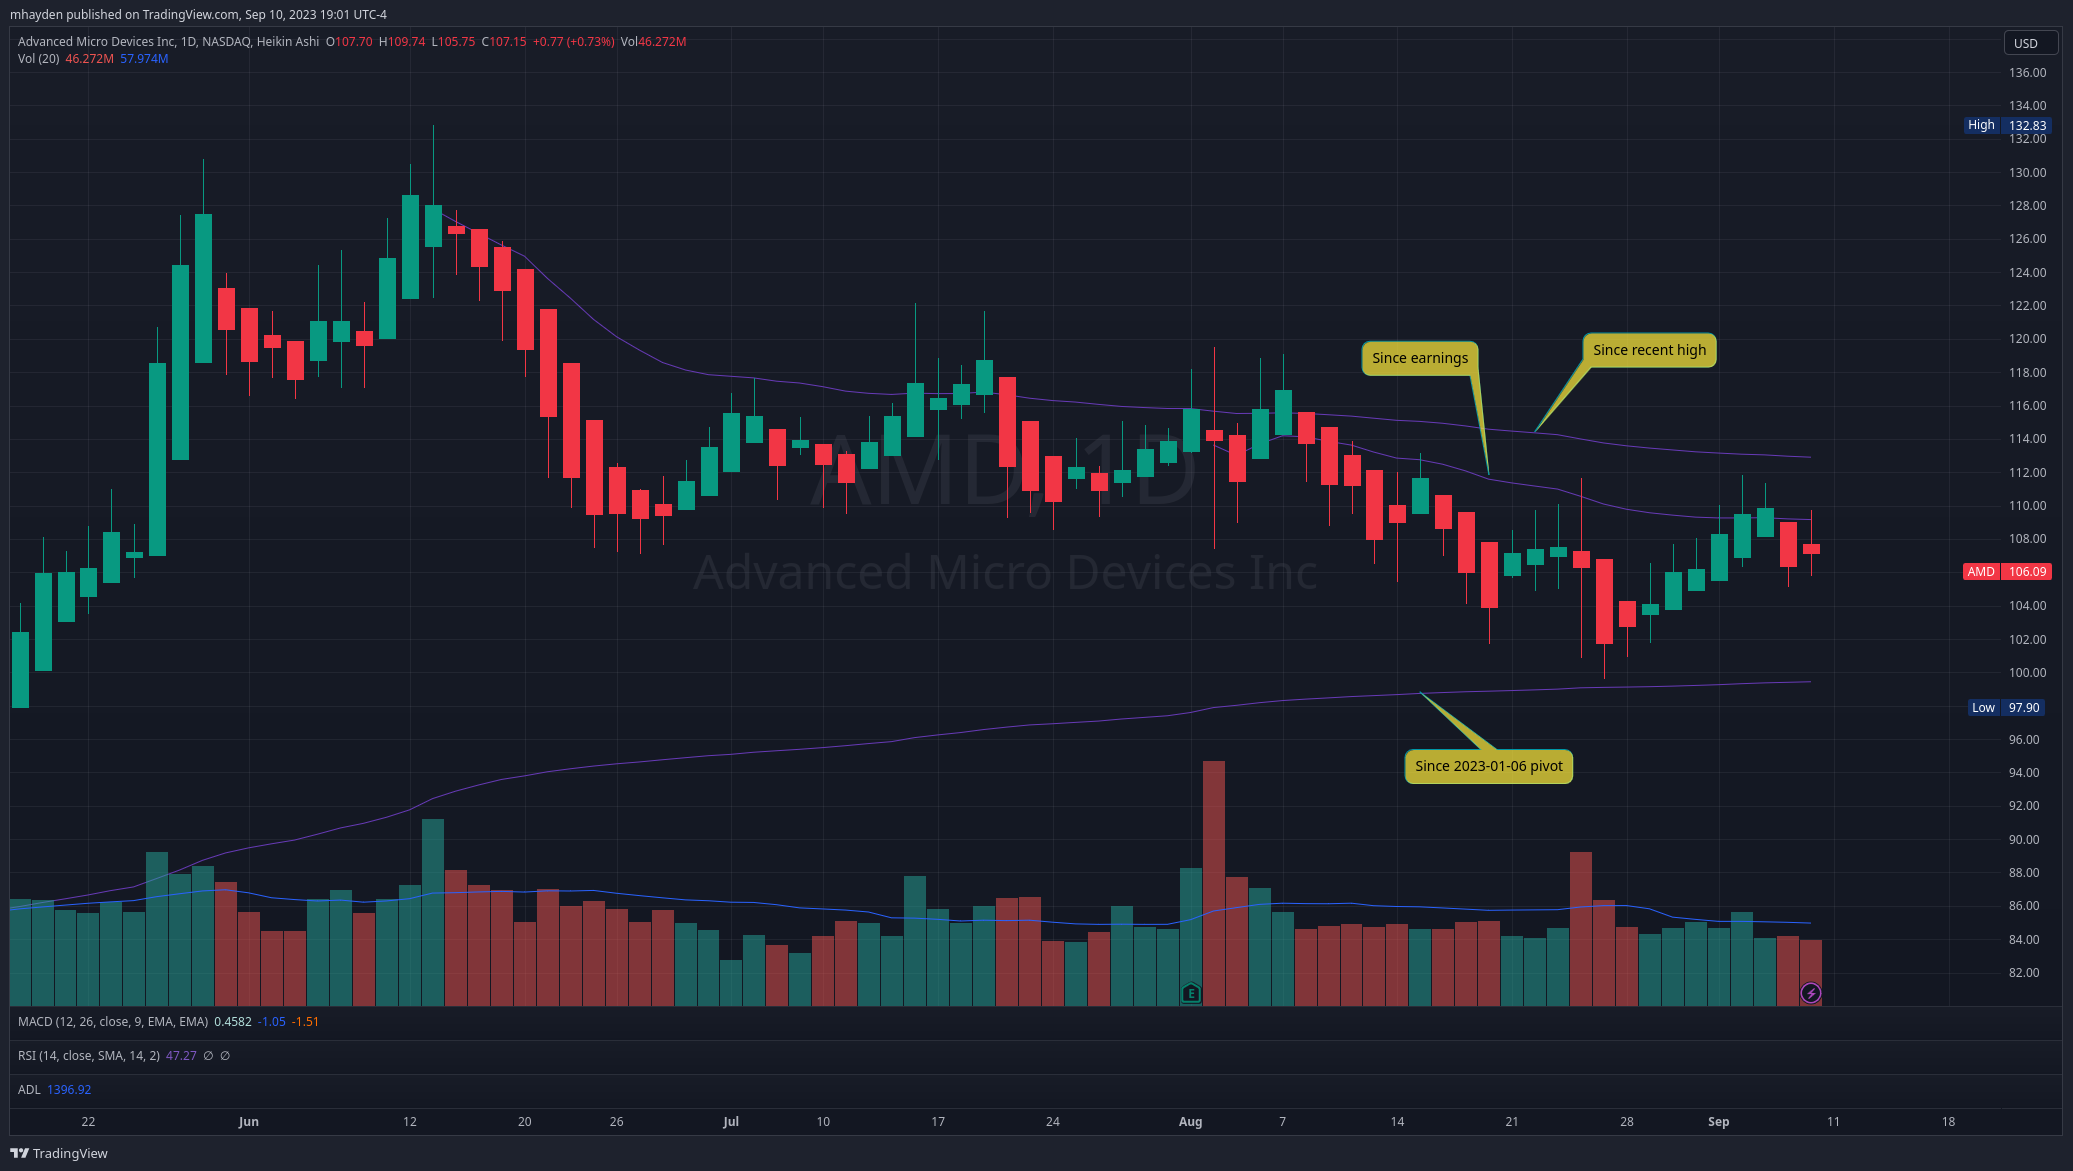
The VWAP since earnings has been a strong resistance line and AMD has bounced off the VWAP line from the January 6th pivot several times. AMD wandered close to that lower VWAP around the end of August and bounced off it again.
So we have resistance here around $109 and $113 and support just under $100 all from VWAP lines. Volume remains below the 20 day moving average except for one day in early September.
Let's look at a daily chart since the recent high and check some other indicators:

The 20MA crossed under the 50MA line in late July and that was a bearish sign. However, the 20 and 50 remained very close together since that time. The 200MA is still making its way up and it sits around $95 today.
RSI is hovering just under 50% and the MACD fast line crossed just above the slow line. The MACD is still below the zero line. All of this gives me a "the market is waiting for something" kind of feeling. We have CPI updates this week and Friday is also a quadruple witching date.
The volume by price indicator shows that point of control since the recent high is around $110. The point of control shows where the highest amount of volume occurred at a particular price. If that level is above the current price, it can sometimes act as a magnet for price. This $110 level has held for at least two weeks now:

AMD looks wedged in a $100-$112 range for at least a little while longer, but there's plenty of news this week that could push it out of that range.
TSLA
Here's a TSLA daily chart with 20/50/200 moving average lines and VWAP lines from earnings and the recent dip to the liquidity zone at $215:
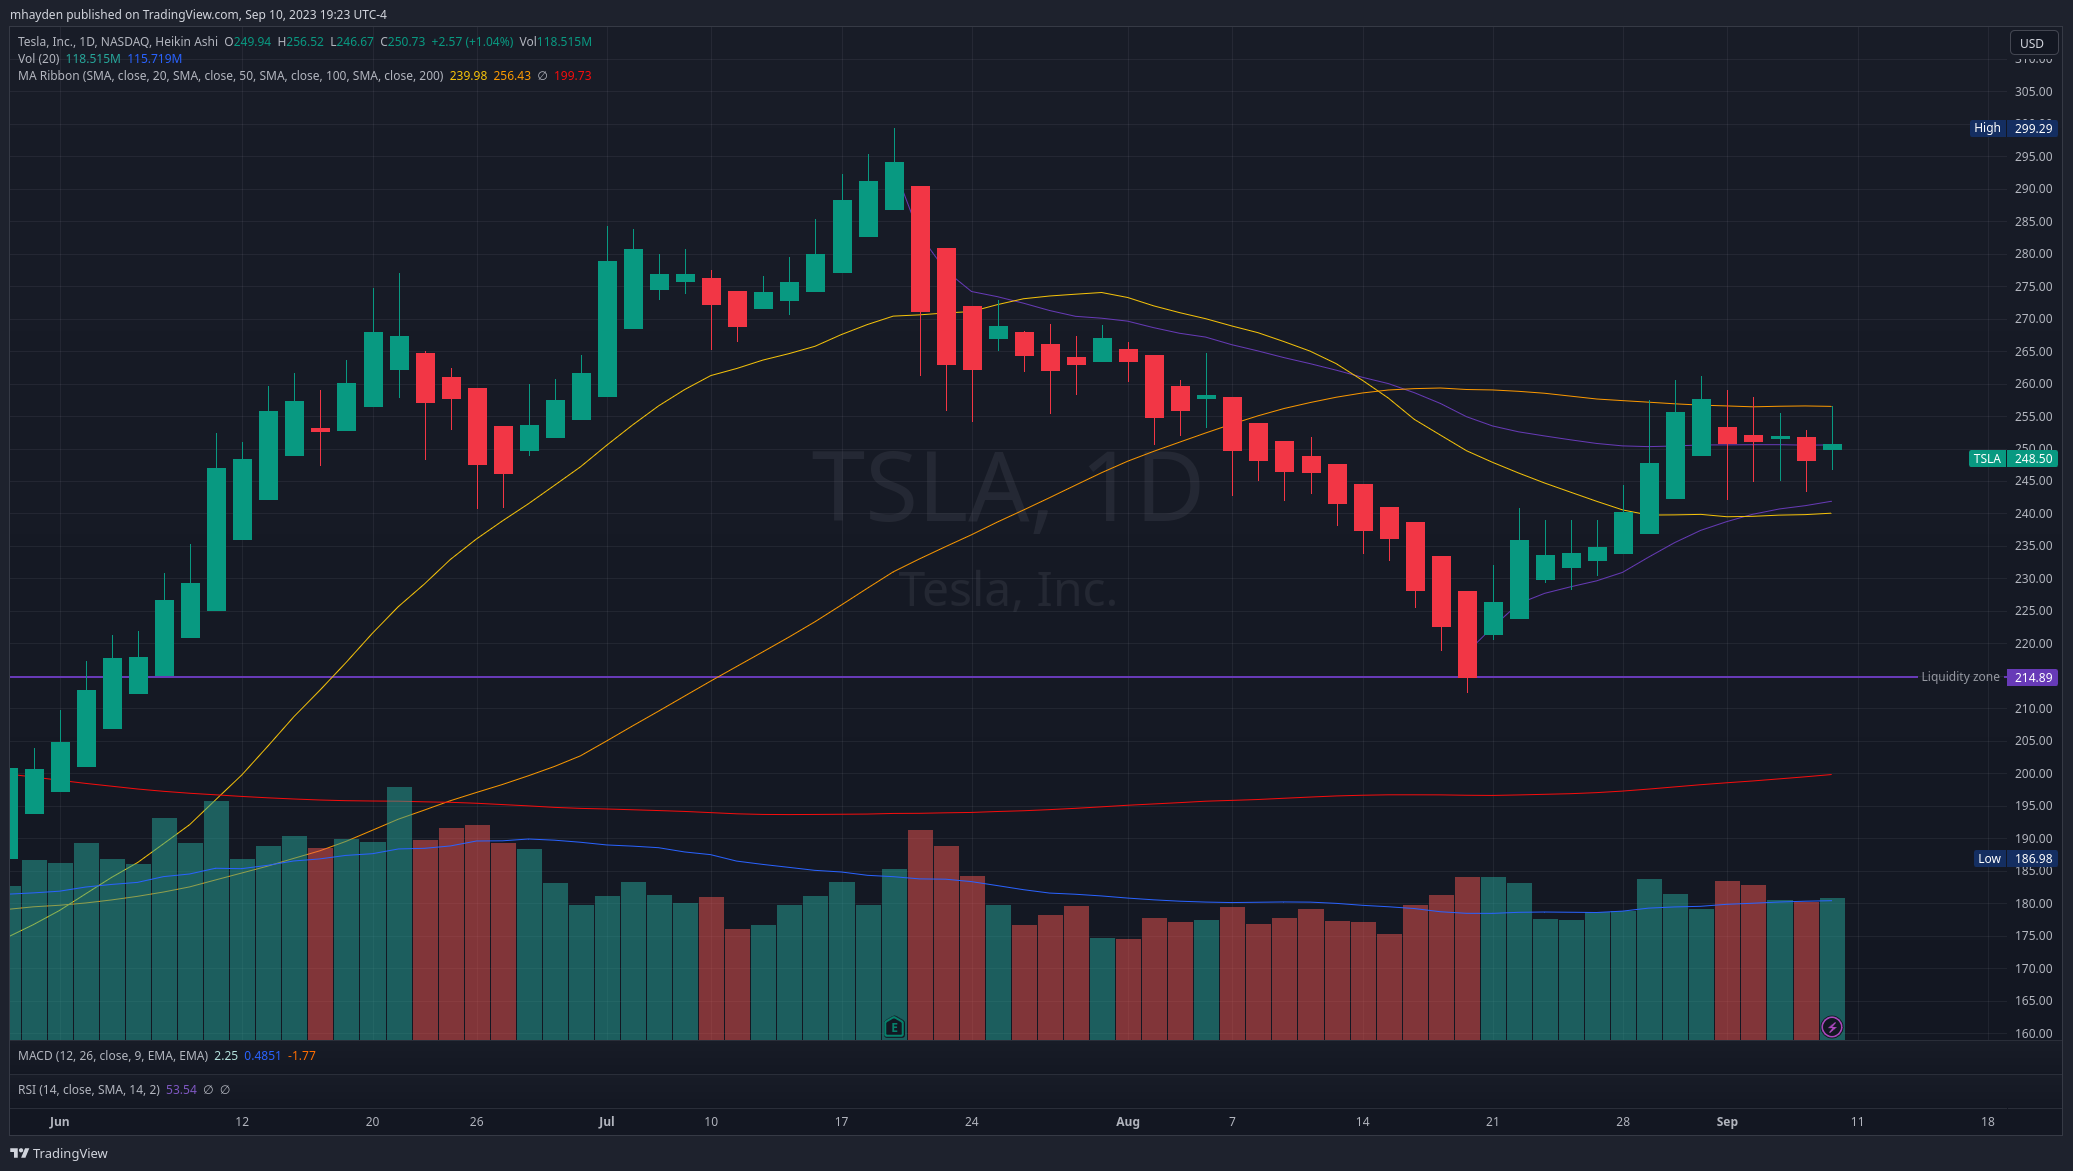
First off, let's examine the VWAP lines in purple. TSLA fell away from the VWAP line from the most recent earnings call but ran right back up to that level after hitting a liquidity zone around $215. I added a VWAP line from the recent drop to $215 and TSLA has cleared that line quite well since then.
That $215 level is pretty special because TSLA has bounced off it as support and resistance multiple times in 2022 and 2023.
As for moving averages, we had a death cross from the 20/50MA in August and those lines have diverged more than AMD's. The 50MA line seems to be resistance for TSLA right now. The 200MA is wandering around $200 this weekend.
Volume for the last two weeks increased slowly and the most recent week was full of dojis. This highlights a lot of indecision for TSLA.
Let's check the volume by price since the recent dip and add our MACD and RSI indicators:
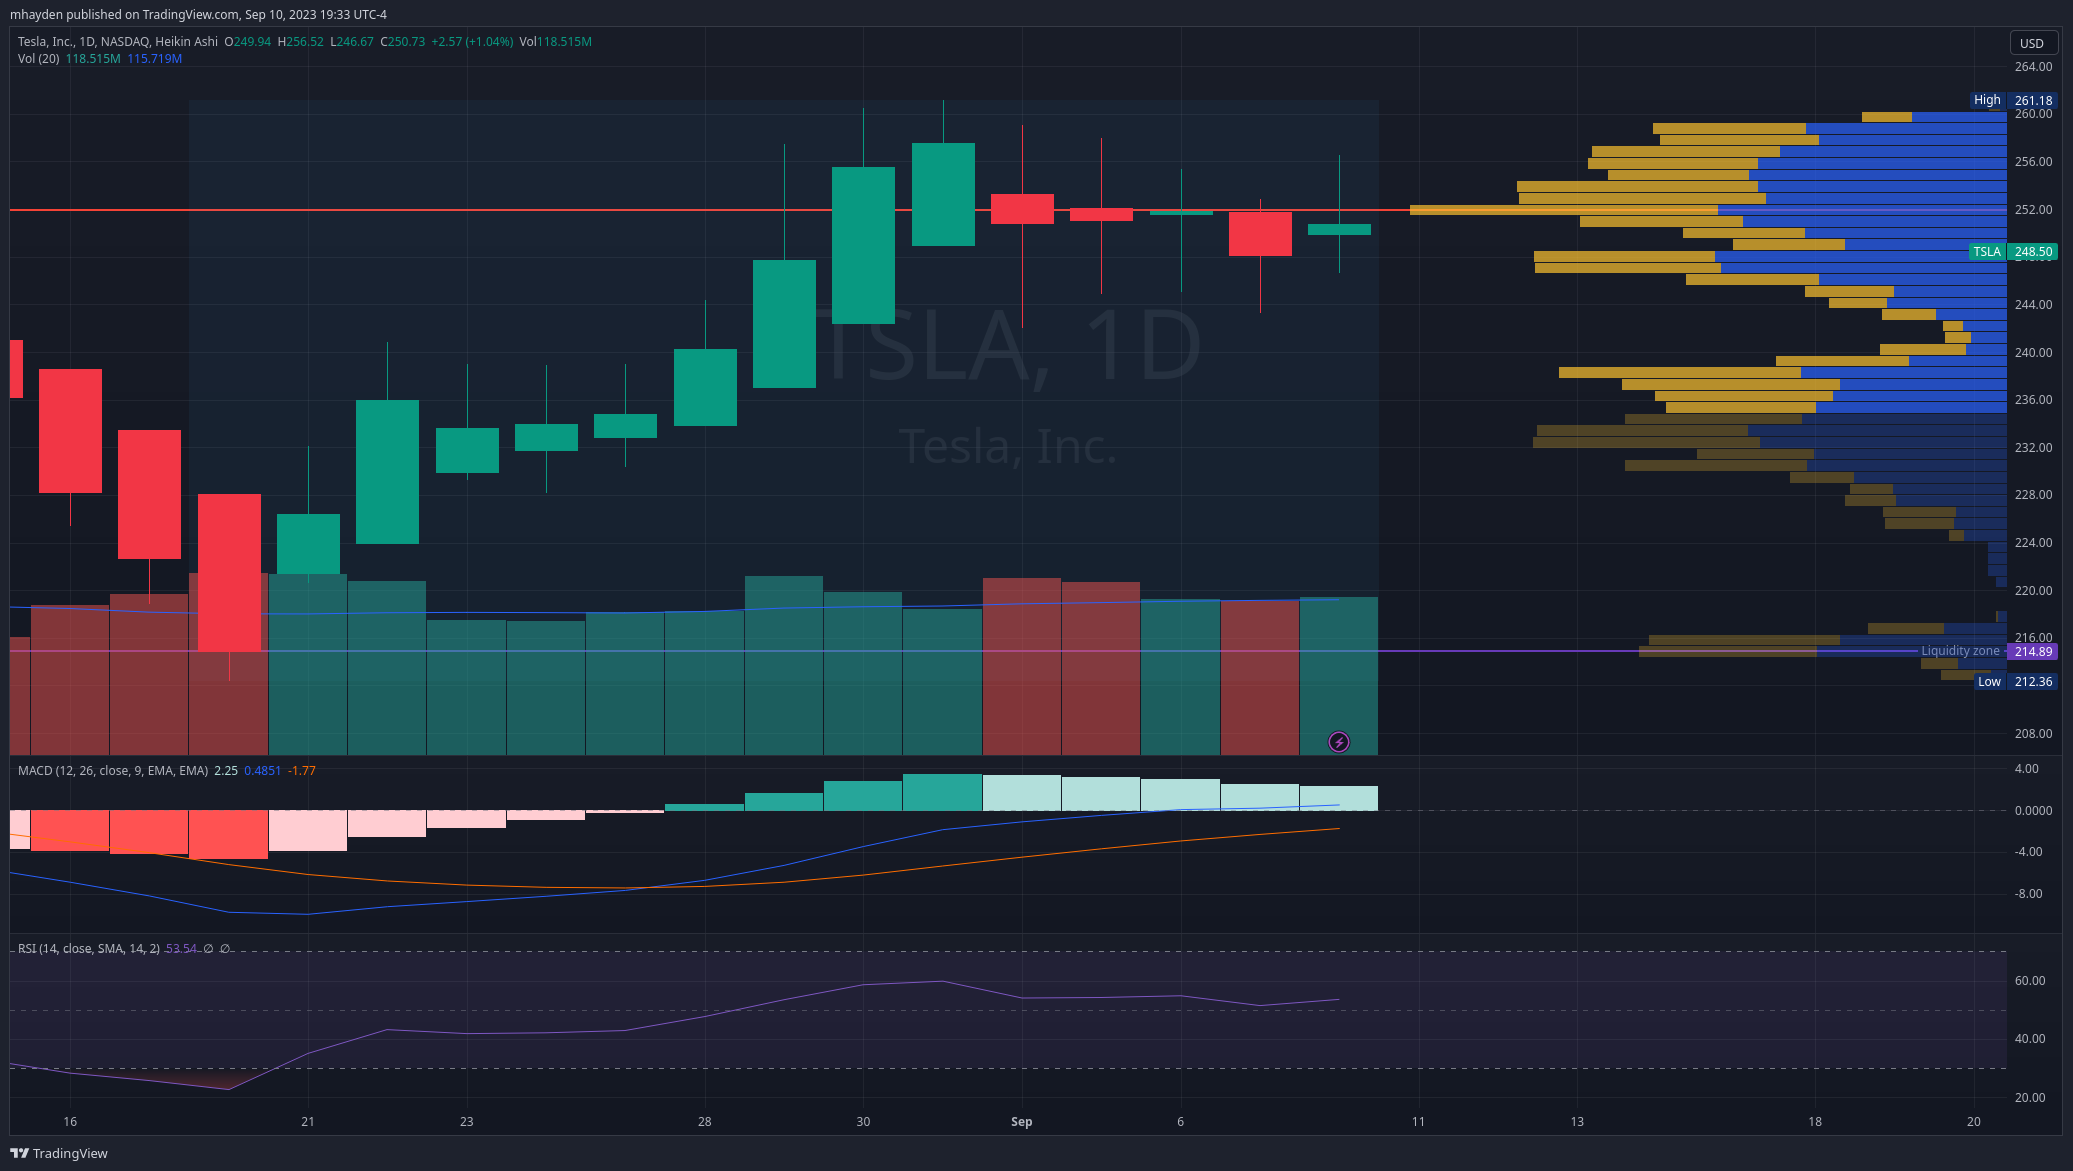
RSI sits just over 50% and the MACD fast line just crossed the zero line by a small amount. Both of these signal more indecision and a potential for moves in either direction. CPI and quadruple witching loom large this week and that could be what we're seeing in the charts.
The point of control from the volume by price indicator is right around $252. There are two big volume shelves here from $248-$260 and $230-$240. A good bounce above the current shelf to $260 could fuel another rally but a bounce below to the $230-$240 range would really test that volume shelf.
I really like this $215 as a safe zone for selling some puts with extra time. There's a sharp volume shelf there and TSLA really bounced from there since it touched. $215 is a special level for TSLA.
Thesis
I'm still interested to trade AMD in the $100-$115 range. I'm hoping it picks a direction after this week.
TSLA deserves a bit of a wider range for trading. If I wanted to be aggressive on premium collection, I might sell strangles from $240-$280 through 10/20. A more conservative bet might be to trade the $220-$290 range through 10/20 and that's what I've been doing so far.
Good luck to everyone this week. ☘️ Remember to drink some water, get some sleep, and share your learnings with others.
Discussion