Charts & Coffee for December 3

Market trends look strong, but how long can we rally at this pace? Let's dig into charts, vanna, and institutional trades to get an edge. 🔧

I'm back! After a great week in Las Vegas for AWS re:Invent, I'm back home and eager to dive back into the market. Last week confirmed for me that the artificial intelligence (AI) and machine learning (ML) hype is still in full force. 🤡
But wait a minute – this blog is about using charts and nerdy data to get an edge on the market. We're not here for the hype!
All investments come with significant risks, including the loss of all capital. Please do your own research before investing, and never risk more than you are willing to lose. I hold no certifications or registrations with any financial entity.
Let's get right to it.
Broad overview
The first image here is a view of my 6-up futures dashboard on a weekly time frame. Across the top from left to right are futures from the S&P 500, the NASDAQ, and the Russell. What do the three of these have in common?
- Multiple bullish heikin ashi (HA) candles with no bottom wicks. S&P/NASDAQ have four in a row while the Russell has two.
- MACD fast lines have crossed or are about to cross the slower line.
- S&P 500 and NASDAQ finally have properly stacked weekly moving averages over an upward sloping 200. The Russell index definitely looks weaker and messier.
In short, the S&P 500 and NASDAQ have been ticking more and more bullish boxes over the last 4-5 weeks. The Russell is still a mess when it comes to the moving averages but everything else looks remarkably better.
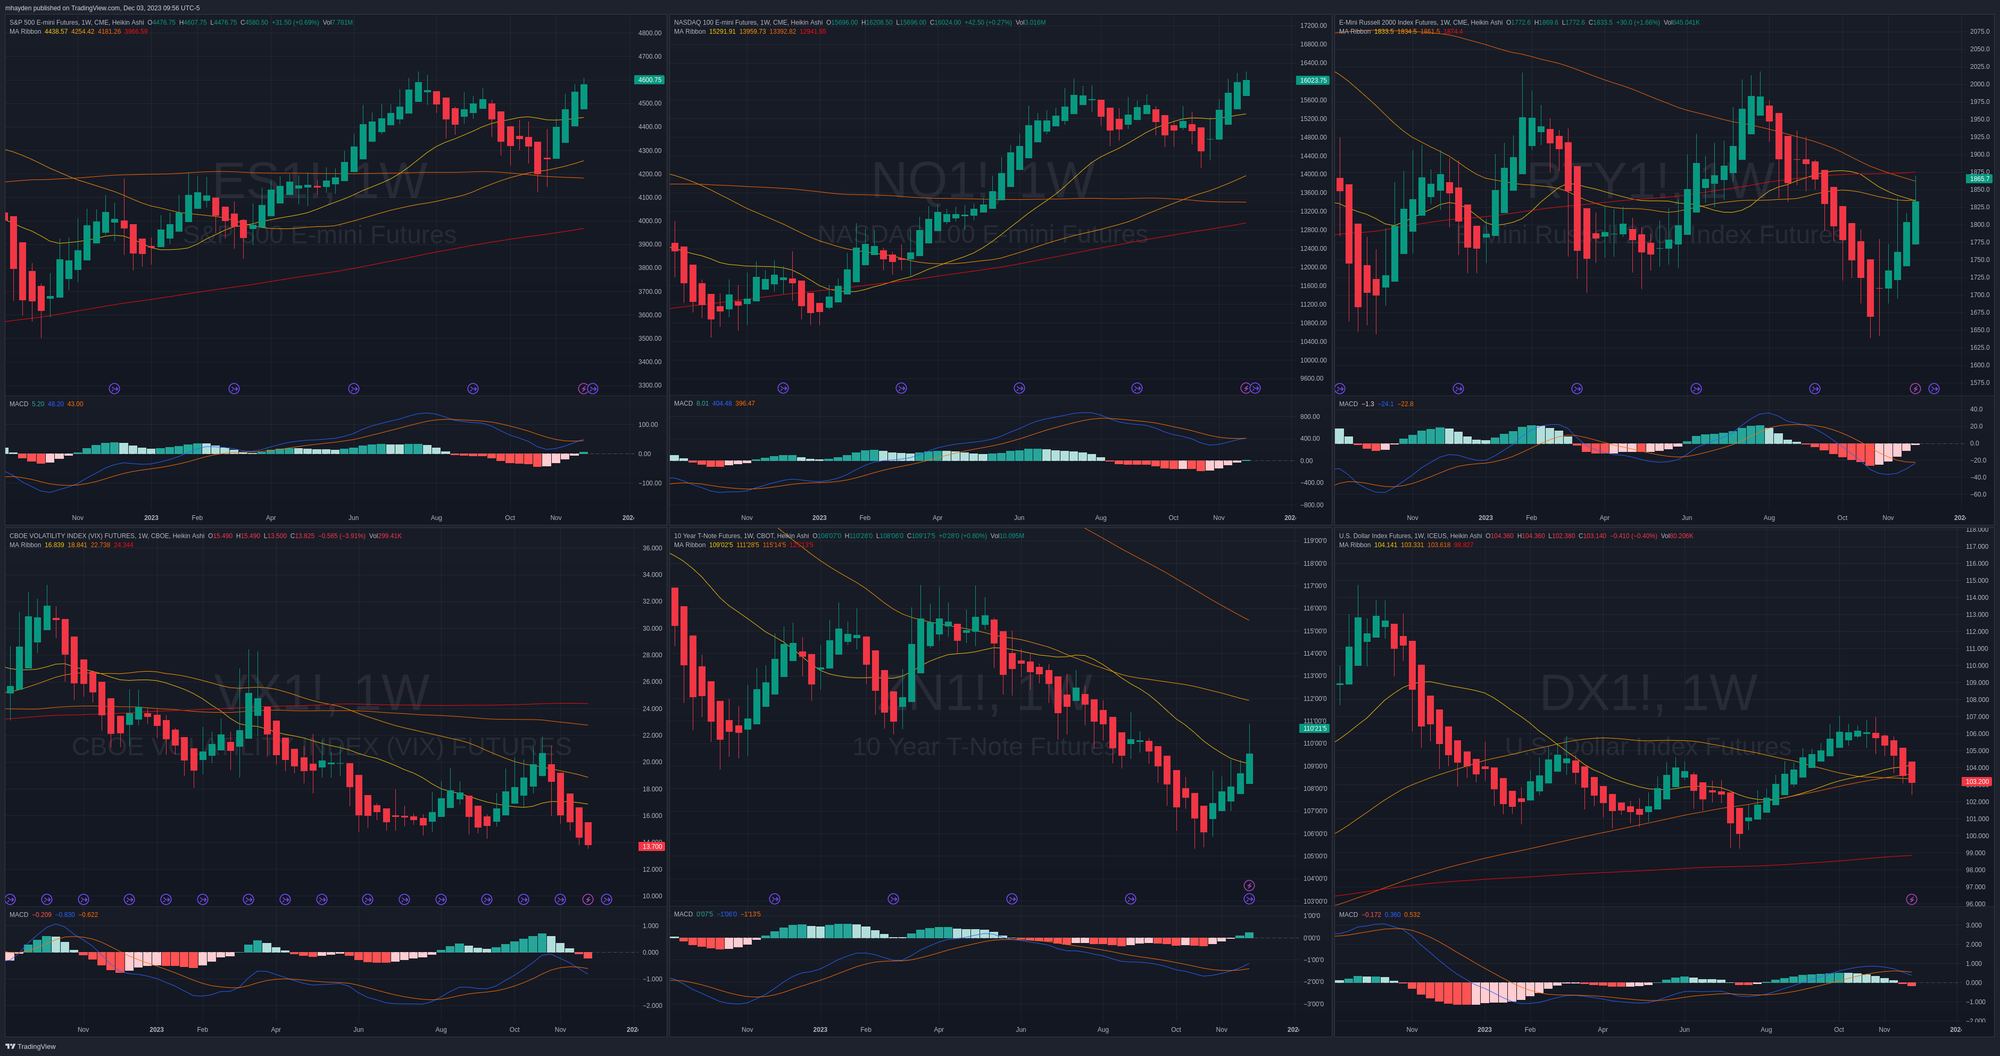
Left to right along the bottom includes futures for the VIX, 10Y treasury prices (not yields), and the US Dollar. Let's break these down:
- VIX: There are multiple bearish candles in a row with no top wicks, moving averages have a bearish order, and the MACD just took a hard cross to the downside. This suggests that the downward move on the VIX is really strong.
- 10Y: Three of the last four bullish candles have no bottom wicks, and the MACD is making a bullish cross. The moving averages are not looking good here, but the 10Y price has only just started turning a meaningful corner recently.
- Dollar: Just like the VIX futures, the Dollar futures have multiple bearish candles in a row and it broke through three of the four moving averages in the last three weeks. The MACD also made a bearish cross.
VIX and USD dropping combined with 10Y yields decreasing is a recipe for higher prices in equities.
SPX weekly
The S&P 500 index finished last week up about 0.75%. You'll note two lines on here at 4300 and 4700 – those come from vanna. More on that in a minute.
If we examine the candles from the chart, we have four bullish candles with no bottom wicks. We also have the Ichimoku cloud's green line above price. Price is also well above a green cloud that is building in height. The only real question here on the cloud is whether the blue line will cross the red line (a bullish signal). That's the final box to tick for a fully bullish Ichimoku cloud indicator.
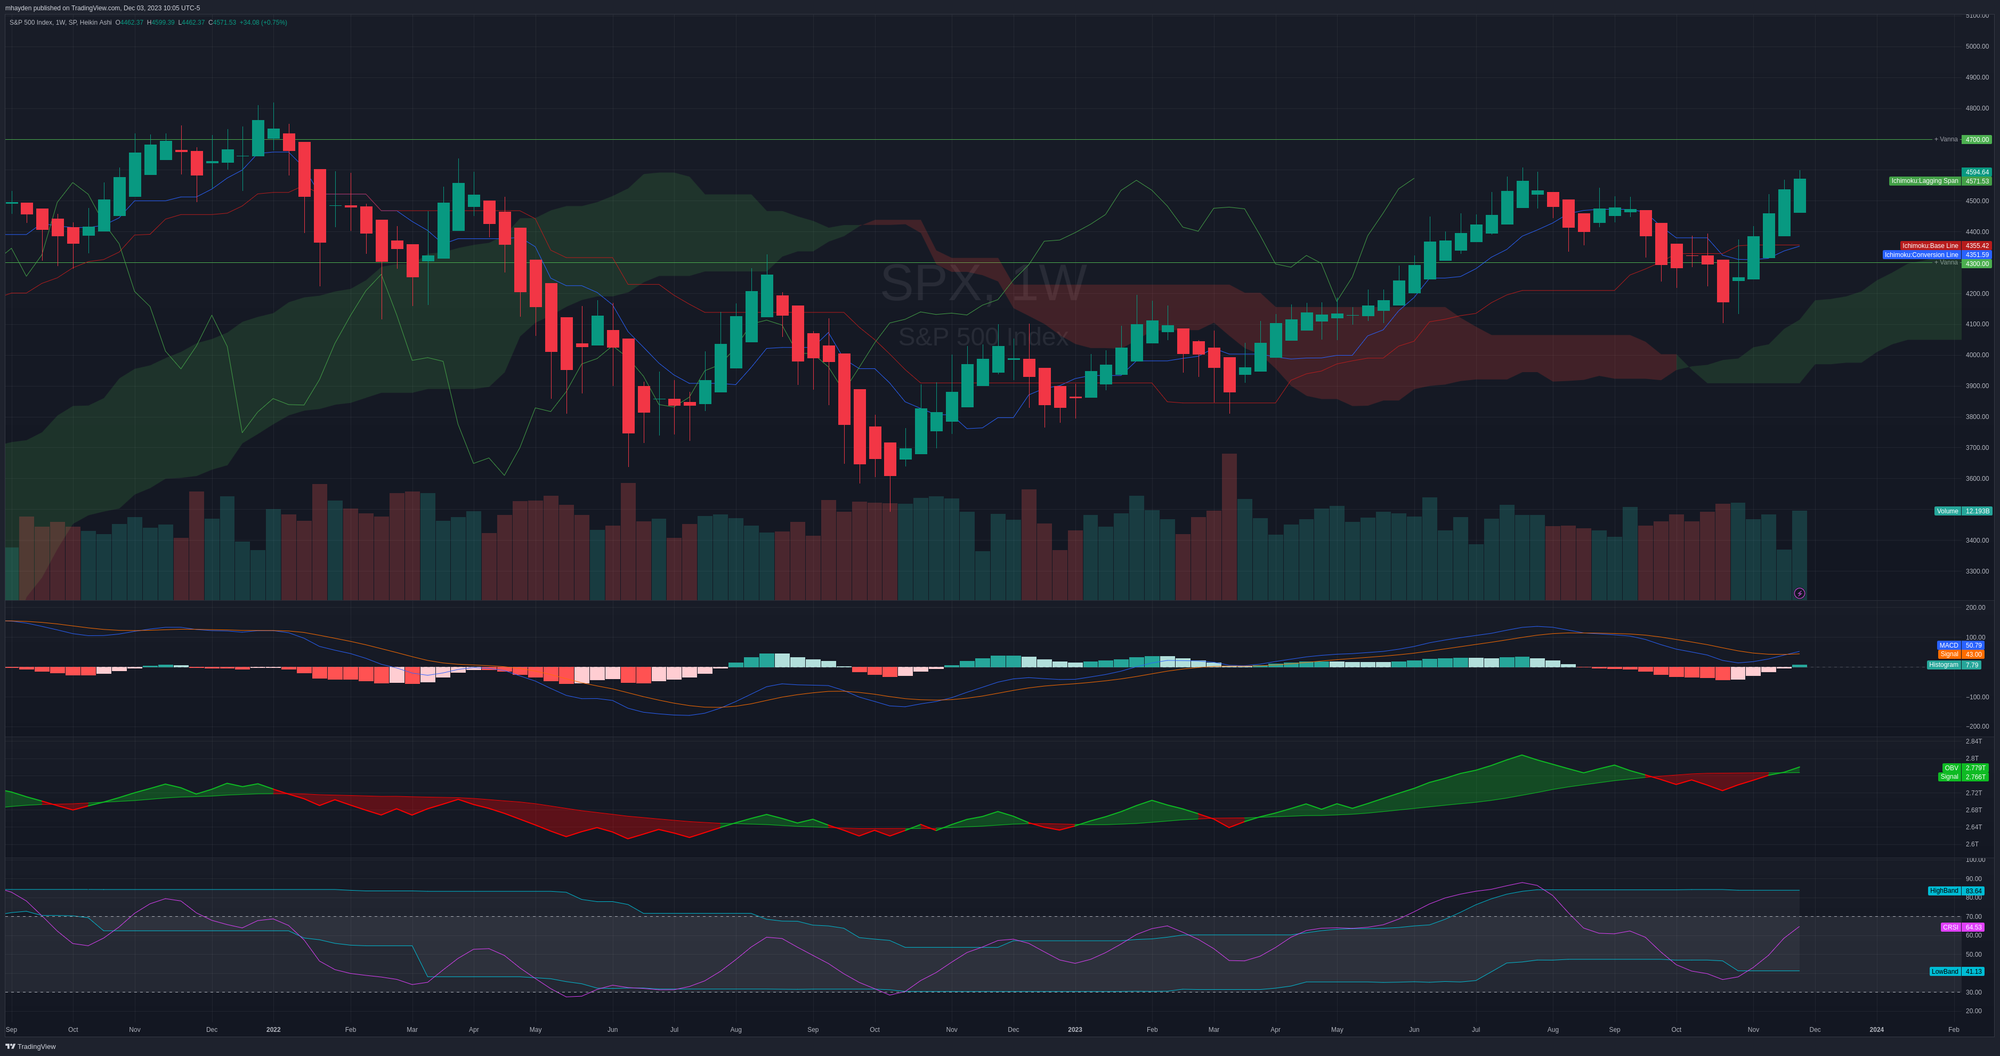
Below the candles, our first stop is the MACD. The fast line (blue) is crossing the slow line (orange) and this is a bullish turn. The histogram bars in the MACD indicator turned green for the first time since the week of August 14.
Next up is the on balance volume (OBV) which measures bullish and bearish volume. If the market moves up, I want to see this line move up with it. That's a bullish confirmation. If the chart moves one way and the OBV goes the other, I buckle up for a reversal. I don't see any of that here. SPX looks strong based on volume.
Finally, we have the cRSI. It's the same as a regular relative strength indicator (RSI), but it applies a channel based on price movement. I like this better because some stocks can hold well above 70% for a while, but 70% might be too low for some tickers or during certain price action. The RSI here is just past halfway up the channel and looks like it has more room to run on the weekly.
SPX daily
The daily chart tells a slightly different story. Everything on this chart screams "boy, we are overextended to some wild levels." Here's what I mean:
- The Ichimoku cloud has some bullish signs, such as green over price and blue over red, but the blue line is well above the red level. This price action makes me nervous. In addition, all of this is happening over a red cloud.
- MACD shot up like a rocket but it looks like it ran out of fuel. The histogram is shrinking and we're close to seeing the fast line touch the slow one.
- OBV doesn't give us a lot to work with here at the tops since we have a little chop lately, but it's still fairly strong. It hasn't broken the level from Nov 24 and that's worrying.
- cRSI is pegged at the top of the channel after breaking out of the channel on Nov 3. It could hover here a while longer, but that would require a lot of bullish price pressure.
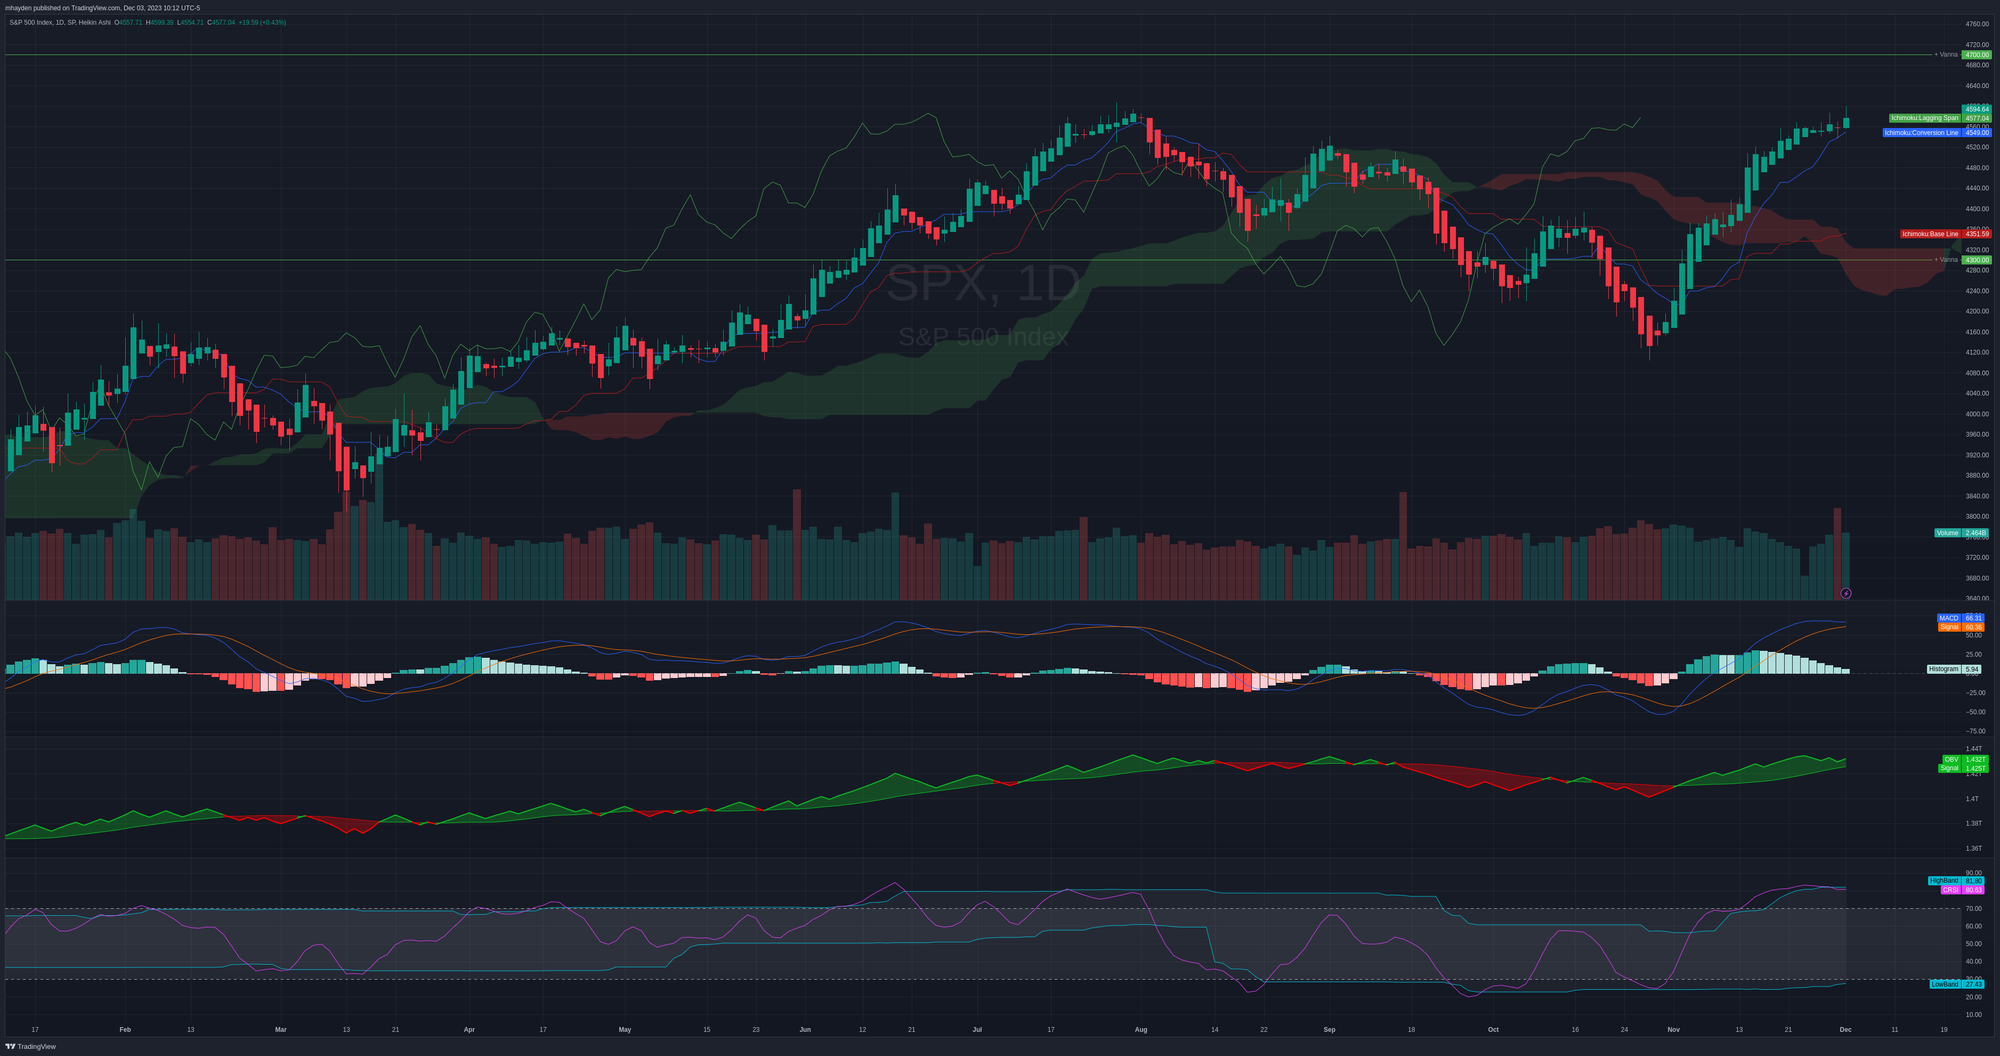
If you're a shorter term trader, this information is really important. I see a lot of signals here that suggests we're looking at a pullback or consolidation inside of a very strong bullish longer-term trend.
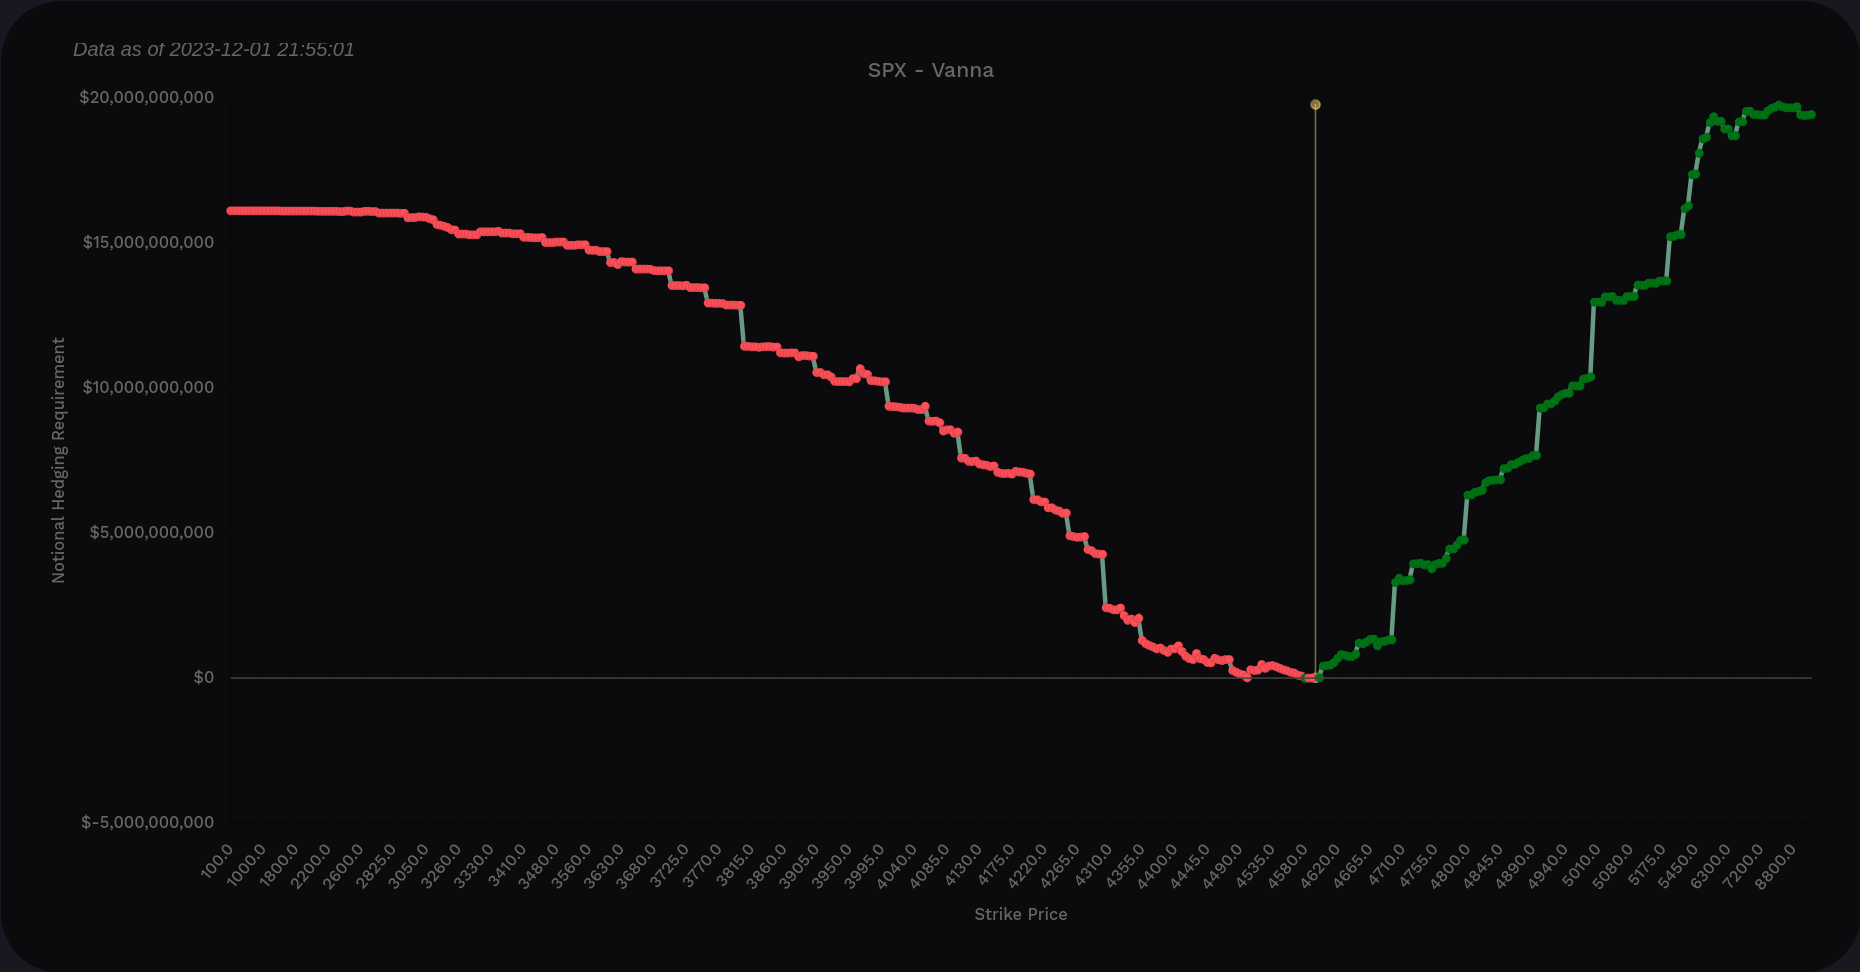
Vanna
How are dealers positioned and how might that affect the S&P 500 index? The VIX futures chart suggests VIX is headed down with momentum but our SPX daily chart shows some signs of weakness. We will need to be open to multiple outcomes.
The vanna curve looks like a textbook bullish curve with positive vanna on both sides and no dips below the zero line. On the bar chart, our levels remain at 4300 and 4700 as they have for some time.
If the VIX continues to fall, our next price target is at 4700. That was our level in January of 2022. If the VIX makes a turn upwards, we pick up support at 4300.
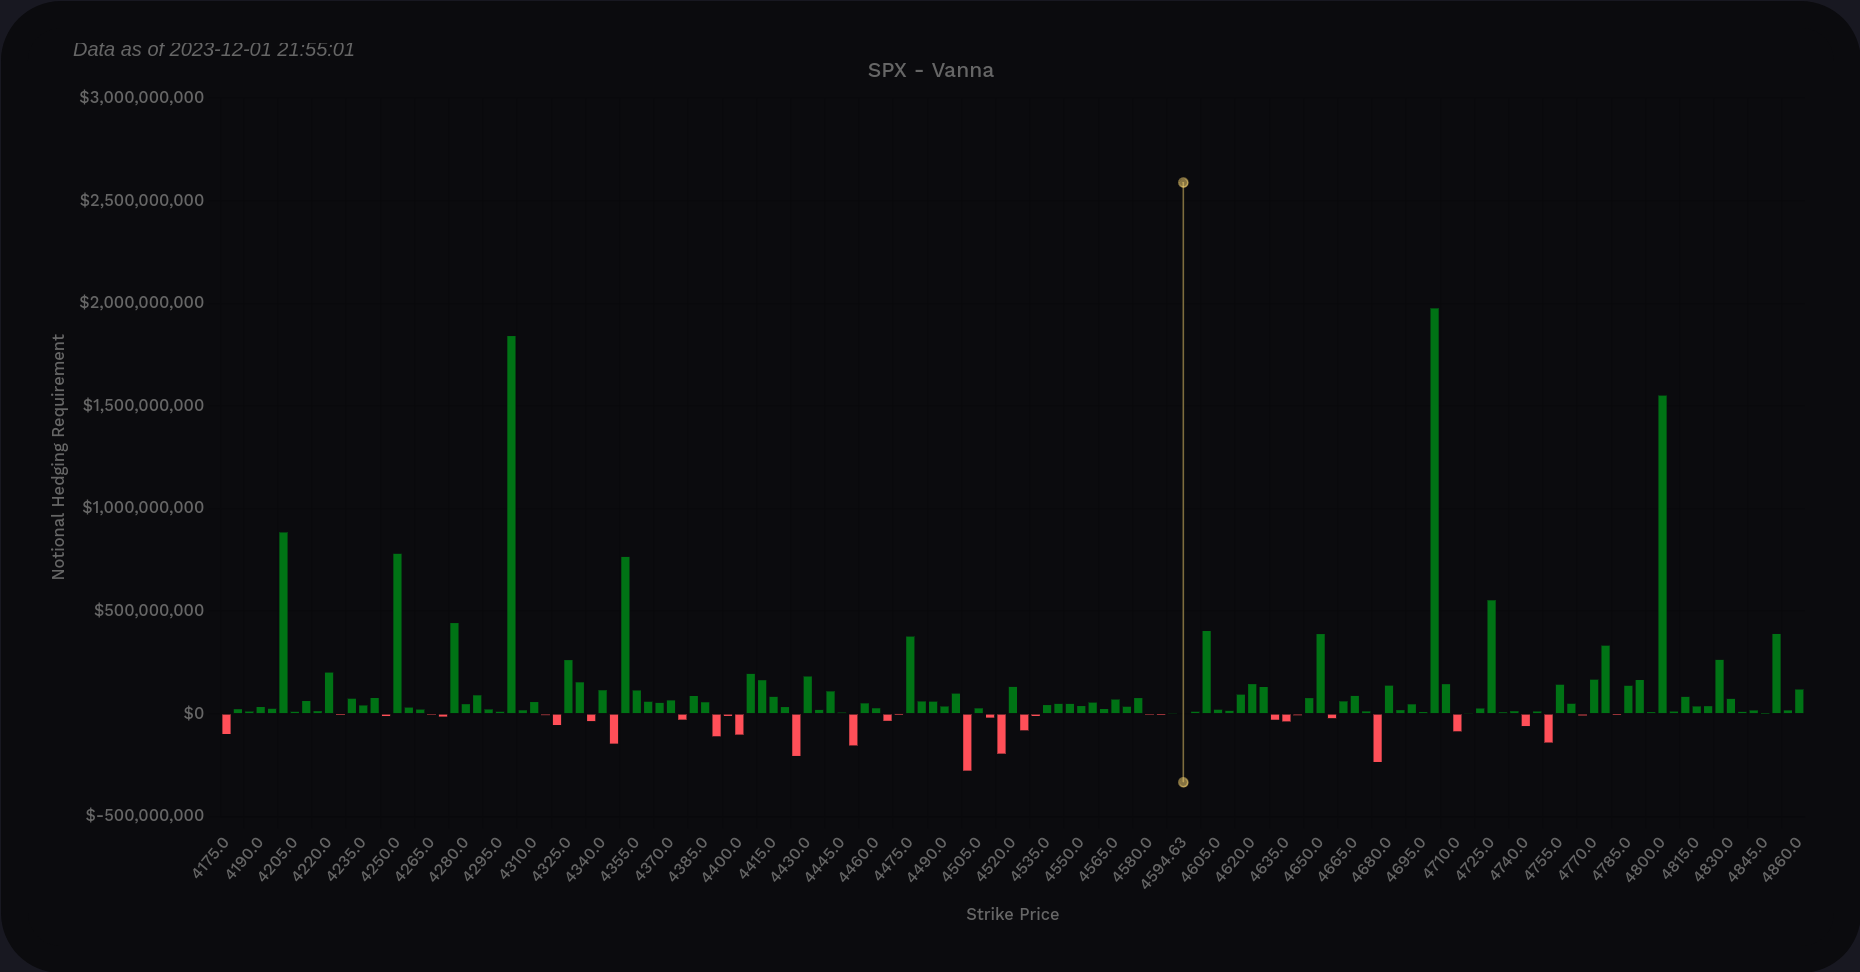
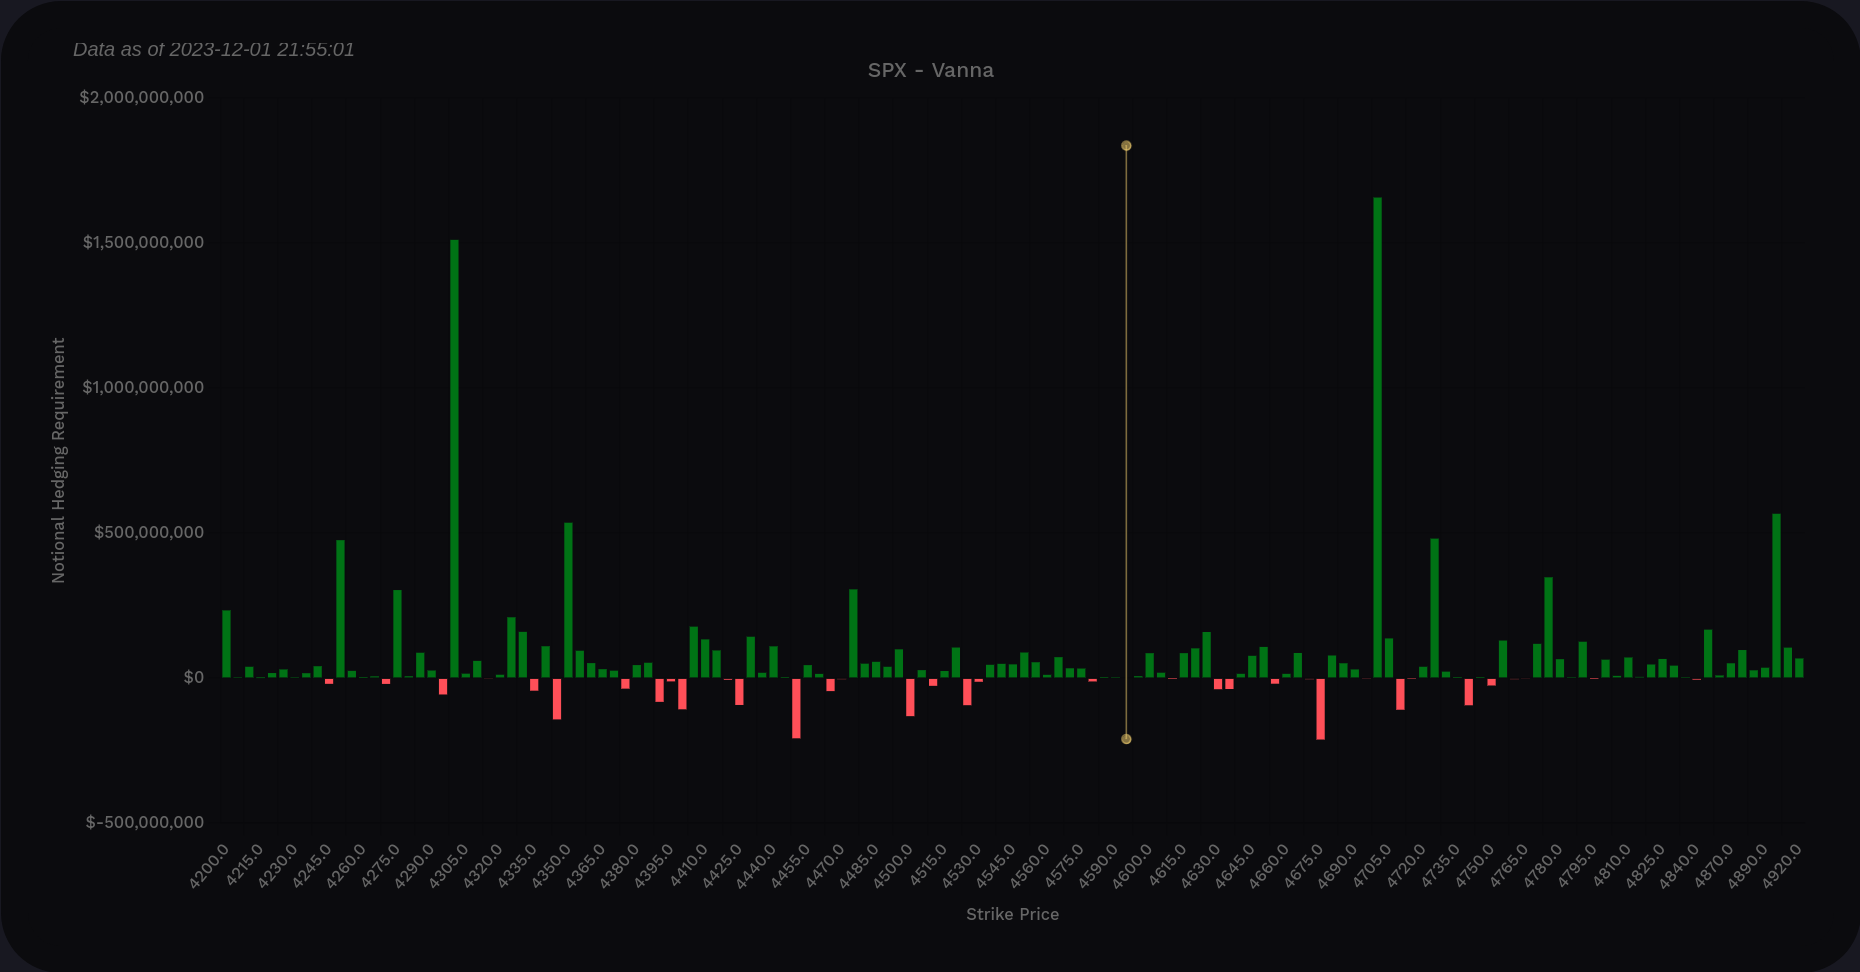
SPX vanna across all expiration dates
Let's examine vanna from now through the next OPEX on 12/15. Nothing changed. 🤔
Let's include expiration dates through the next OPEX on 1/19. Nothing changed. Again. 🤔
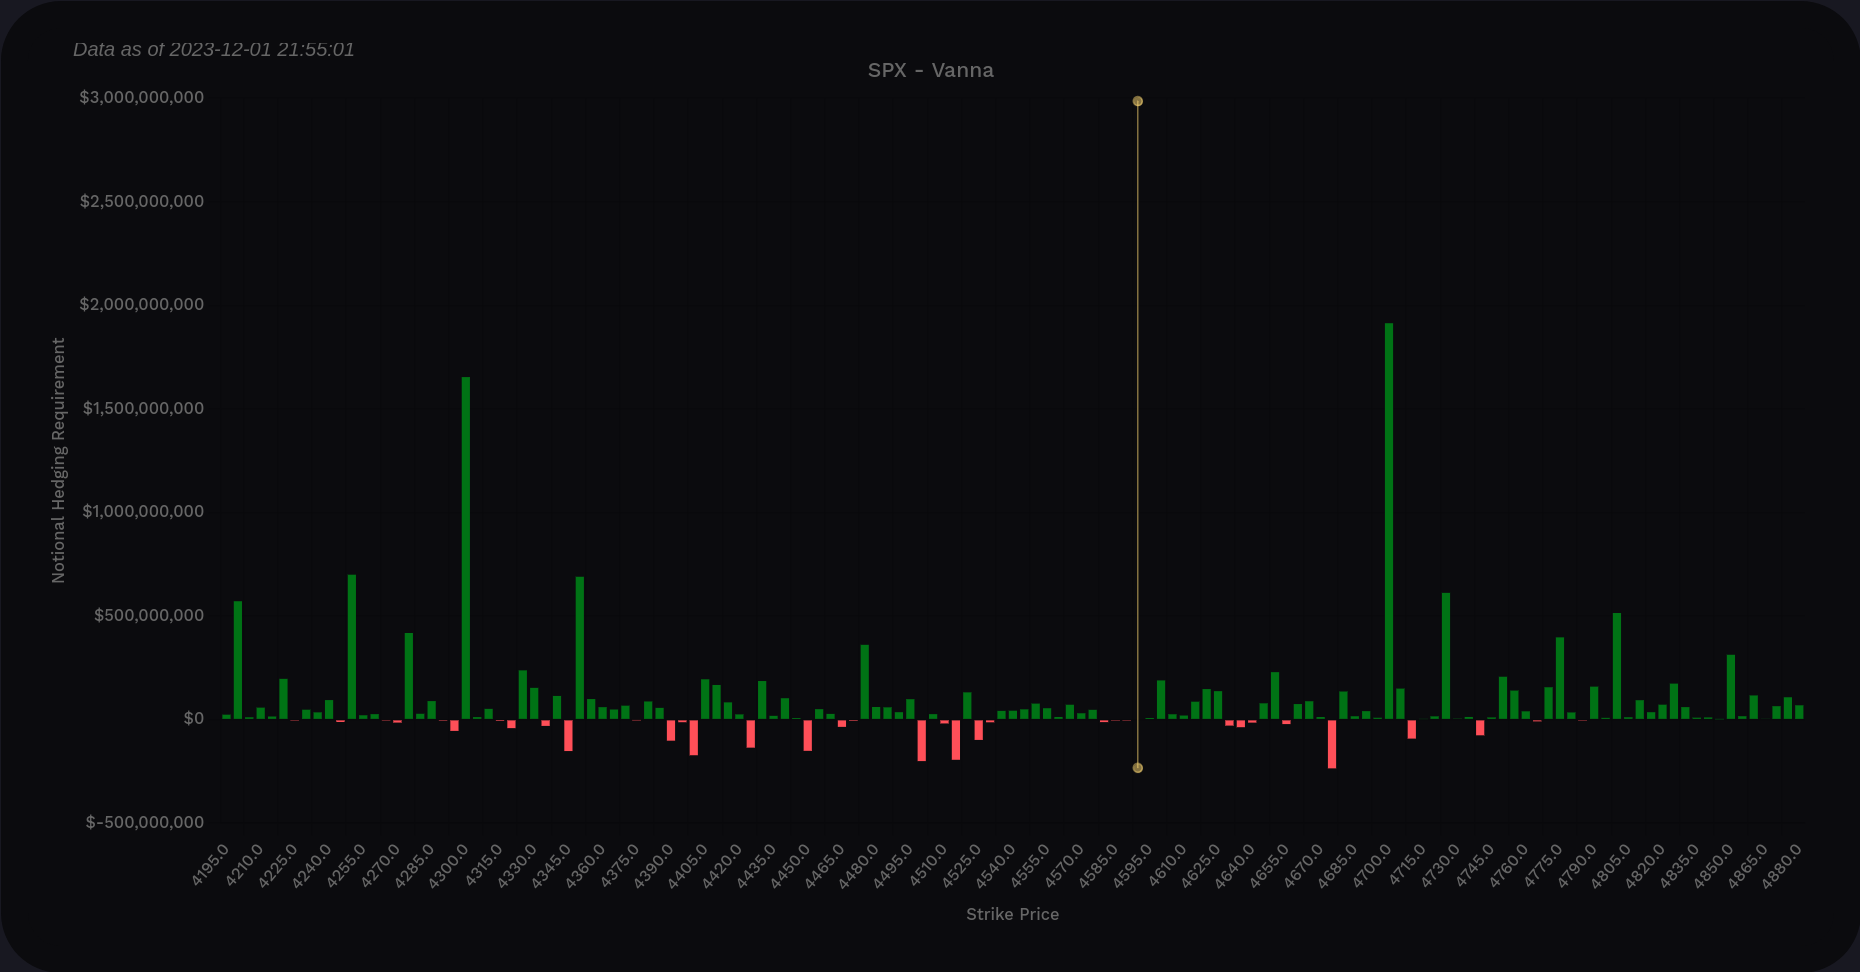
So it looks like 1/19 has us pegged between 4300 and 4700 unless something wild happens.
Institutional trades
Volume Leaders tracks institutional trades on various ETFs and equities. Although it shows dates, prices, and amounts of each trade, it does not show directionality. That's left up to you to infer.
The numbers inside each bubble here refer to the trade's rank out of the top 100 trades. For example, the 24 at the top right means that the trade that occurred there was the 24th biggest trade for SPY since Volume Leaders began tracking it. That's a big trade.
There's a cluster of big trades from $390-$400 last December and then no trades that ranked in the top 100 until just last week. On December 1, there was a lit exchange trade for 4.51M shares at $459.10. That's over $2B in SPY shares changing hands. 👀
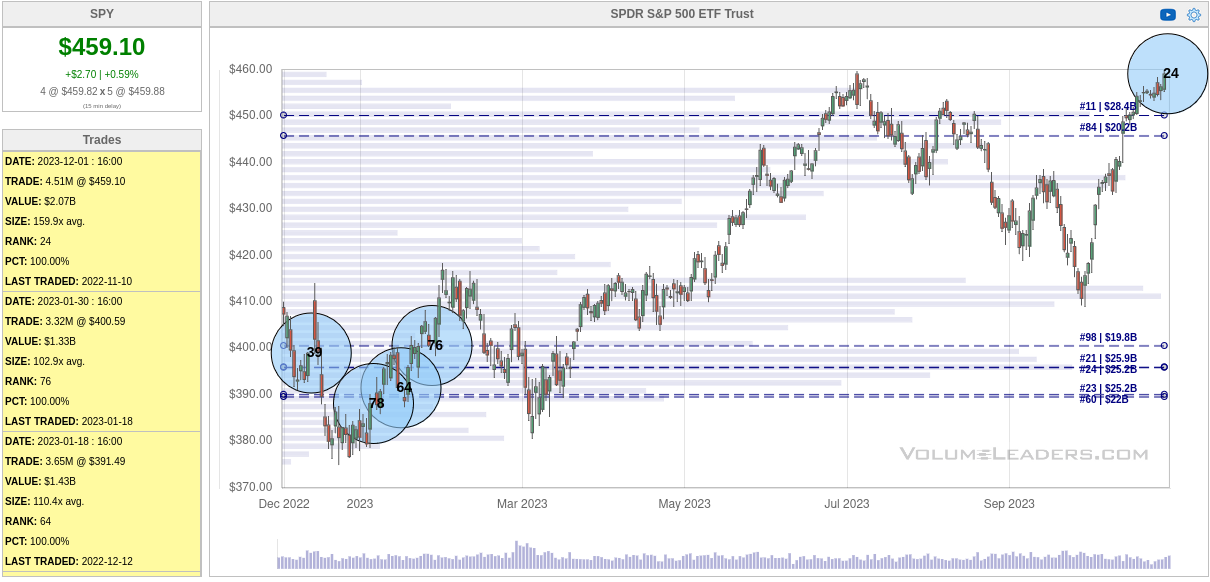
So the question here is: was this a buy? Was it a sale of an existing long position? Was it a new short? I'm not sure yet.
What's special about this $459 level? If we go back in time, this level was where everything fell apart back in late 2021. It became a temporary support level as the market rolled over. It was tested with another rally in March 2022 but then it's easy to see what happened after that. 📉
We hit this level again recently in July after the AI rally and fell back once again. SPY is approaching this level once again but it's clearly repellent for price. I'd love to see some consolidation before a nice breakout above this level, but I'm not sure.
Either way, institutions have made it clear that there's something special about $459 and it's a critical level to watch.
Thesis
We're in a strong long term trend, but on the daily, we seem to be losing steam. We're approaching an important level around $459. My money is on a brief pullback or correction and then we continue grinding higher. VWAPs from recent lows suggest SPY could pull back to anything from $427 to $439:
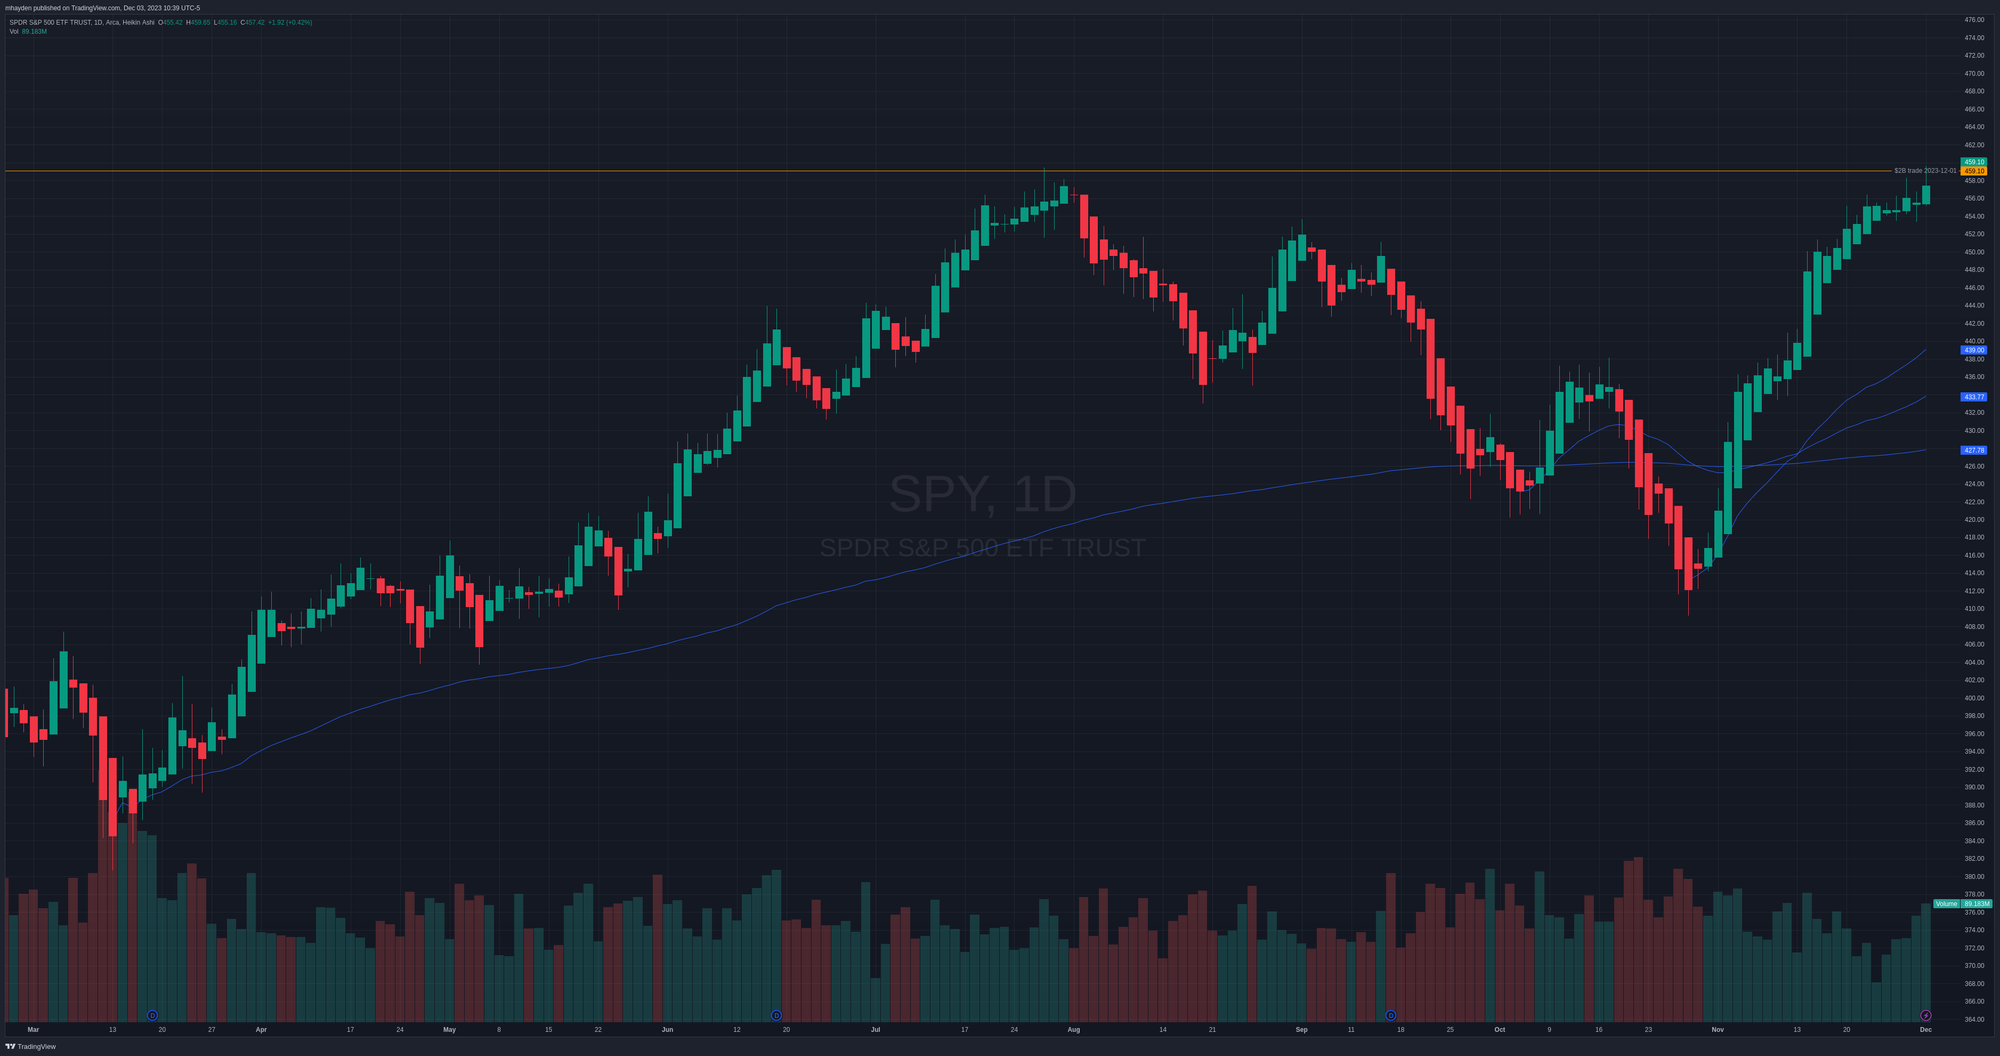
Pair that up with the big positive vanna line at 4300 and this support level has more weight.
If I'm trading SPY long term, I'd stay put. If I'm trading SPY on a shorter time frame, I might look for a drop to the $430s as a chance to start a new position or increase an existing position.
As for me, I'm net short SPY right now with a short $439 12/15 call that has been a bit painful to watch. I'm ready to pick up some SPY shares if we see some dips soon, though.
Good luck to everyone this week! 🍀
Discussion