Charts & Coffee for October 29

Grab a cup of coffee and let's look through SPX and NDX charts this week. I'll also recap Ciovacco Capital's weekly video. 📉

Welcome back to another weekend edition of Charts and Coffee. ☕
I'll be taking a fairly broad look this week without a focus on any individual stocks. That analysis comes back during the week.
All investments come with significant risks, including the loss of all capital. Please do your own research before investing, and never risk more than you are willing to lose. I hold no certifications or registrations with any financial entity.
Hope your cup of coffee is hot and ready. There's a lot to cover! 😉
Ciovacco Capital has another good video this week
Thanks to one of my good friends in the Theta Gang trading group, I've started making Ciovacco Capital's weekly YouTube videos part of my Sunday morning schedule. I love these videos because the narrator is incredibly calm and gives tons of ways to look at the market to not only see where we are right now, but how events like these have played out over decades.
Here's this week's video:
I took notes on paper while watching it because my brain seems to retain information better if I write on physical paper. I can't explain why, but it does! Here's what I wrote down:
- One of the effects of interest rate hikes is that financing and managing debt becomes more expensive. The private sector is starting to believe that the US government might not be able to manage debt effectively. Nobody in Congress is talking much about managing the deficit.
- Debt crises, like the SNL crisis in the 1980's, were terrible. However, the S&P 500 gained 227% during this period. Analysts were totally right about their predictions except for one thing: they wildly underestimated the staying power of regular investors in the market.
- 4200 was a support range for SPX for a long, long time, but we broke that this week. We revisited 4200 much too quickly recently and that puts June's breakout above 4200 under question.
- New highs/lows is turning bearish from a pretty high level.
- 10% corrections during bull markets happen more often than you think, but they always feel horrible.
- Our next level to watch in the 200 week moving average, which sits around 3940.
- Trend traders likely feel very frustrated lately as there are tons of false trends to distract us.
One last note from Chris:
Can find quite a few charts that have similar characteristics to Q1 2022.
— Chris Ciovacco (@CiovaccoCapital) October 25, 2023
I love these videos because they're full of real data without too much conjecture, fear, or euphoria. He equips you with things you can add to your regular roundup of charts so you can track some of these changing trends on your own.
6-Up Review
I've seen some traders build a multi-chart view in TradingView that has several different broad ways to look at the market. I've built one of my own as well.
My first row includes S&P 500, NASDAQ, and Dow Jones futures. VIX, 10 year Treasury, and US Dollar futures make up the second row. I might change these out over time, but this list has been working well so far.
I also overlaid LuxAlgo's Signals & Overlays indicator on each chart with the NeoCloud enabled. Red clouds signify a bearish sentiment while blue indicates bullish sentiment. The thicker the cloud, the stronger the sentiment. The cloud can often act like a support and resistance zone for what I'm measuring.

I like the four hour time frame because it gives me two bars per day and that's quite helpful for my trades, which are more like swing trades. I can see how the morning looks relative to the afternoon fairly easily.
It's clear that the big indices are in a downturn right now and the VIX, which was already in a bullish trend, crawled back over the cloud and ran higher. 10Y Treasuries are in a downtrend (yields increasing), but they began creeping into the bearish cloud last week. Finally, the dollar remains bullish, but the cloud is a little thin.
SPX
I wrote a post last week about SPY potentially giving everything back since May and that's looking more possible. If we look at a daily chart for SPX below, we have two breaks of structure from September and October. We sliced right through the eqiulibrium zone after testing it once and we're sitting in an daily order block from late May.
There are still some remaining order blocks from different time frames around 4040-4080 that could interact with price if we keep blasting through the 4117 level. Beyond that is the next order block at 3960 and then we're looking at 200 week moving average territory at 3940.
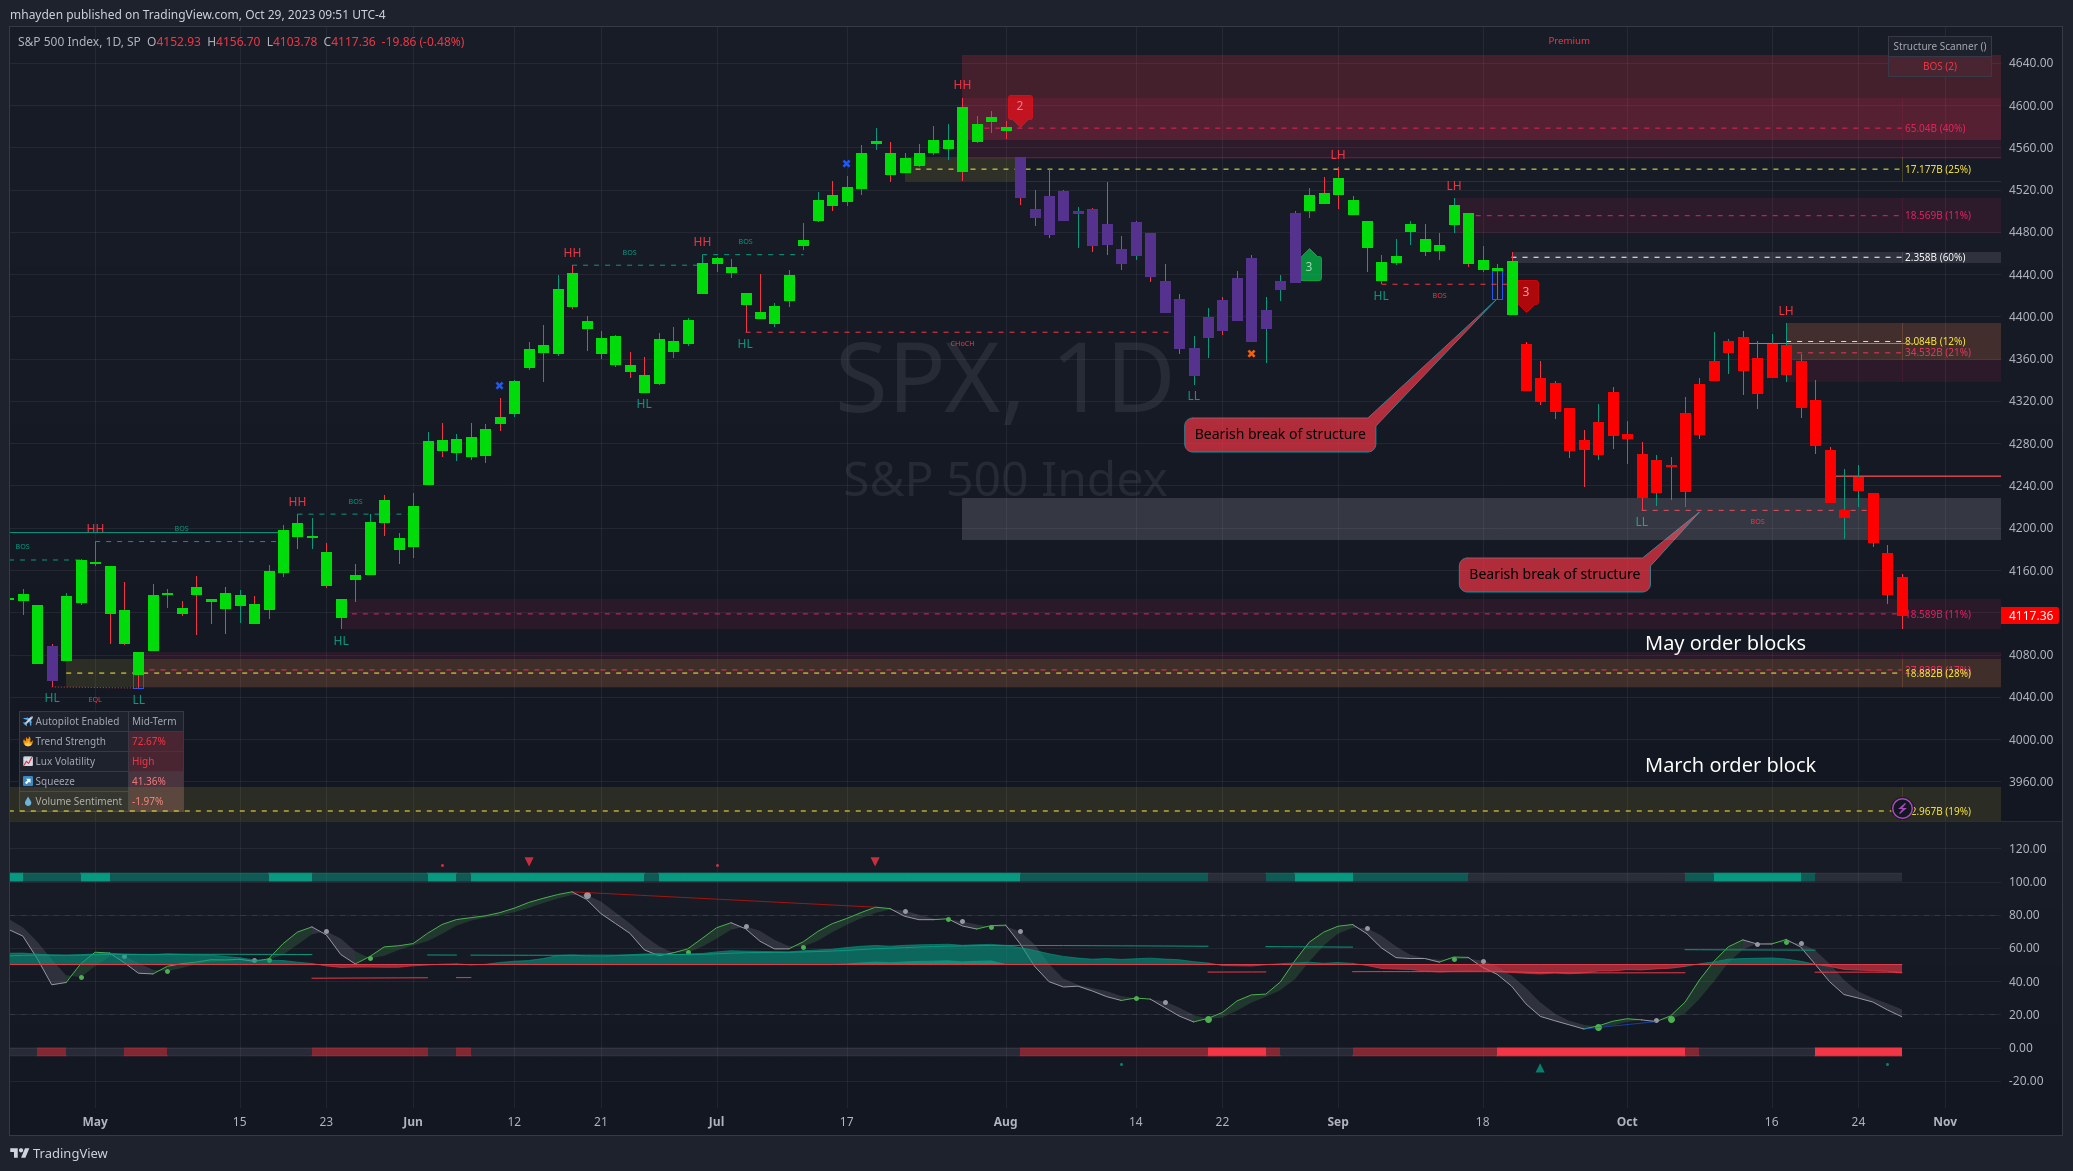
The oscillator underneath tells a good story for us as well. Some brief optimism in mid-October has definitely dwindled. Our money flow is negative and has crossed the threshold. We might even see some money flow "overflow" on the indicator. The wave is firmly below the middle line and still heading down.
Scan back to June and July on the oscillator indicator at the bottom. There's a bearish divergence in the wave (the thin red line connecting the peaks) that preceded the drop we just saw. There are also two big red triangles near those peaks which suggests a downturn from other parts of the indicator. Move over to October 1 and there's a tiny bullish divergence line preceding the small rally in October.
You can read more about the oscillator indicator over on LuxAlgo's site. I'm still learning how to use it, but it's been fairly helpful already.
NDX
The NASDAQ seems to be in a similar pattern, but as you might imagine, it has much more volatility. We have two breaks of structure, just like SPX. Also, we broke through the June breakout level.
The May order blocks here sit far below the current price. There's a lot more room to fall here to reach similar levels to where SPX is now. May's order blocks are grouped around 13000-13200 and there are more order blocks from earlier in 2023 down to about 12500.

The oscillator tells a similar story to SPX. There were lots of bearish signals and bearish divergence in June just as the market was breaking out. That leads us to where we are today where the money flow is still a bit positive, but it's shrinking. The wave is far below the center line and still falling without much sign of slowing down.
Thesis
SPX is approaching May levels prior to the June breakout, but the NDX still has some ground to cover if it's headed to the same level. I'm glad to hear from the Ciovacco Capital video that tracking trends is difficult right now because I've been having a tough time with it lately.
The "trade the chart in front of you" mindset is what I keep reminding myself about. The current charts tell me that we're likely not done correcting yet, but we're still in a bull market. However, we're approaching a turning point where we have to ask whether this is a continued correction or we're turning the corner something like we did in 2022. We haven't hit that turning point yet.
I'm beginning to shift my trading strategy to one where I look for boundaries of price during a longer time frame. This involves taking vanna into account along with order blocks and other levels on the chart to make a strategy. I'm adopting some of the TastyTrady strategies (45 DTE short strangles, higher IVR stocks) that I used a long time ago when I had less trading experience.
My goal here is to be more mechanical about how and when I put on trades, how I pick my strikes, and how I manage my trades. It's been stressful trying to pick directions on shorter time frames lately and gamma swings have been chewing up my profits. You might see my analysis shift a little during the week.
Good luck to everyone this week! ☘️
Discussion