Deep dive on AMD for July 24

Today's post is a deep dive on AMD as we approach earnings next week. Earnings season is upon us! 🎉

If you missed my post with charts and technical analysis from yesterday, be sure to catch up on that first. This blog is all about using every bit of data available to us to make higher probability trades and charting is one very important piece of the puzzle! 📈
This week should bring us details from the Federal Reserve about interest rates, but it looks like most traders think we will get one last bump up in rates:

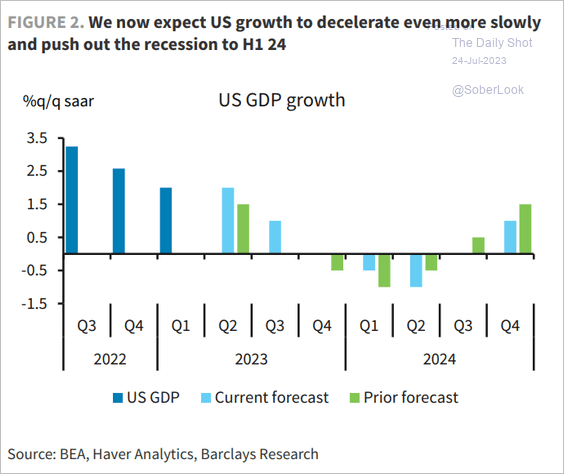
Some economists and analysts think that the effects of interest rate changes might not really hit us until the first half of 2024:
Let's see what the rest of the market data is telling us. But first:
All investments come with significant risks, including the loss of all capital. Please do your own research before investing, and never risk more than you are willing to lose. I hold no certifications or registrations with any financial entity.
Today's post will be a focus on AMD with earnings coming up on 8/1.
AMD
As mentioned earlier, AMD's earnings are coming up next week on August 1st and last week's TSM/ASML earnings weighed heavy on semiconductors. But we're not here for how the market feels, we're here for data! 🤓
Charts recap
If you forgot to read yesterday's post on charts, the key bits are these:
- AMD is running down to the $109 support level on decent volume 🐻
- We broke the 50 MA line 🐻
- Strong Heikin Ashi candles without top wicks confirm the downward move 🐻
Options data
My first look is on the vanna chart for 7/28. Vanna has weakened a bit (as it does in the second half of the month after OPEX), but it's worth a look:
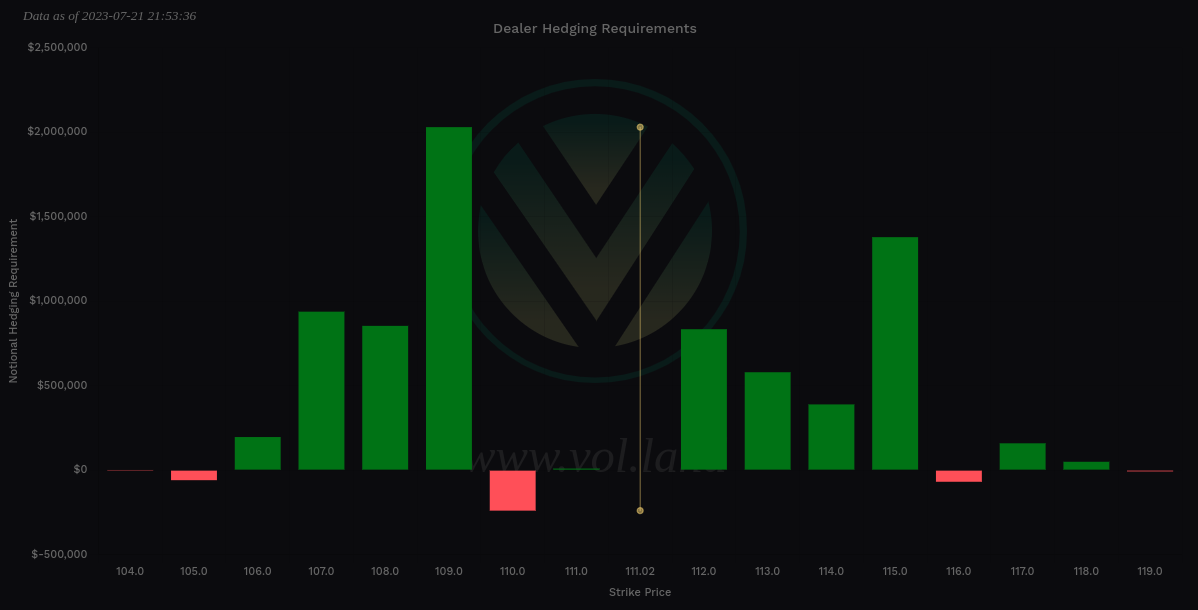
We have positive vanna across the board here with a barely noticeable dip at $110. $109 is the biggest level (right on the support line) and it looks like selling puts from $106-$108 could be profitable this week. If we do go on a run, there's not much there to get us above $115.
How does that continue into next week's earnings? Here's AMD's vanna for 8/4:
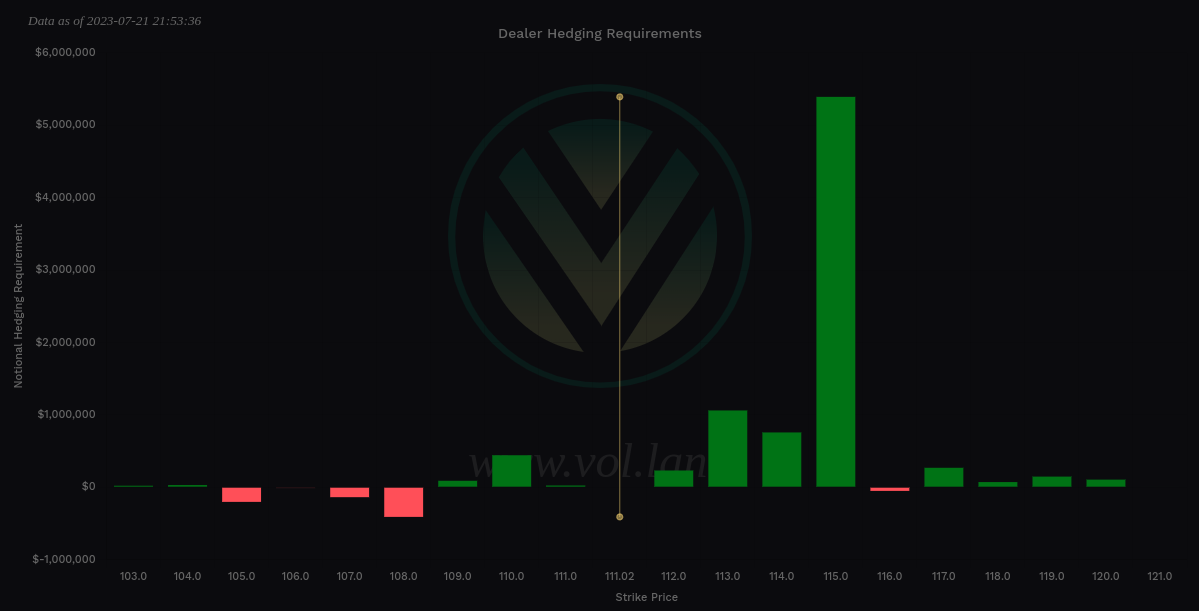
Let's assume we make a run to somewhere near $115 this week. What happens next week. Again, there's no fuel from vanna to exceed $115. It looks like the market is betting that AMD doesn't move much.
How about 8/11?

This looks less clear, but again, there's not much past $115 except for a little bit at $117 that is mostly canceled out by negative vanna right next door at $117.
How about the next OPEX date on 8/18 with tons of volume?
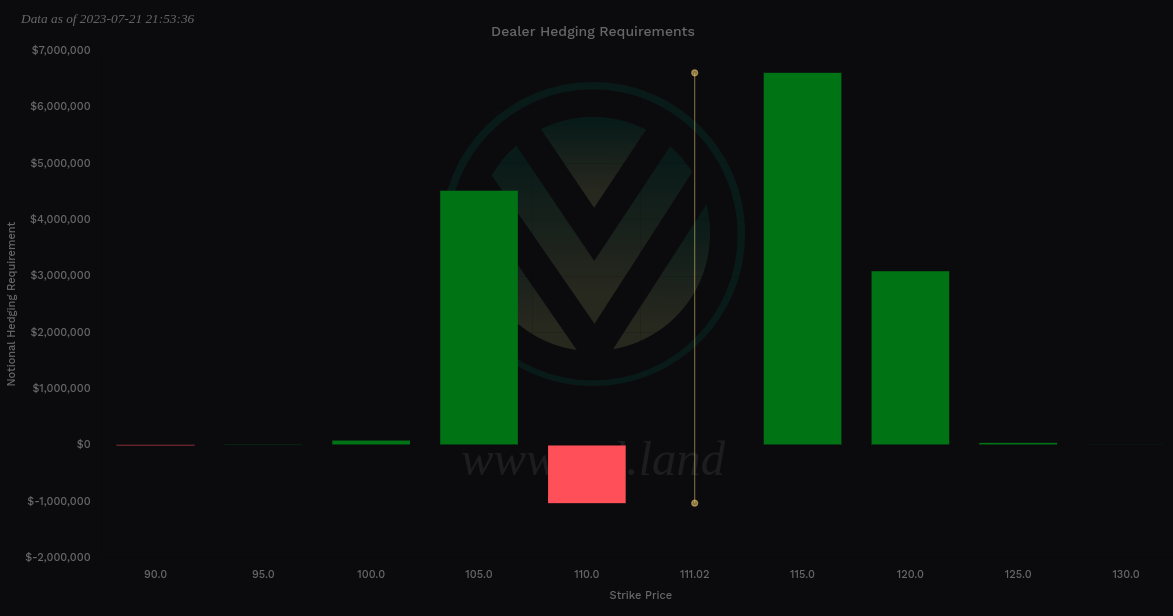
I like to see the $120 level growing here for 8/18, but $105 has suddenly appeared. Combined with the data for 8/11, there's a chance our $109 support could break down and potentially move to $105.
What does this vanna data mean through 8/18?
The safest bets through 8/18 look like going bullish from $105-$110 and bearish past about $115. I'm going to watch that $120 level to see if it grows a bit more but this data screams price consolidation to me. Consolidation is a good thing, though, because it builds a base of support for future moves.
Dealer positioning
It's challenging to see in this chart, but the 15 day momentum of dealer greeks buildup has gone neutral. This means that there's nearly an equal push in the market from customers loading up on bullish and bearish bets:

I like using the 15 day timeframe for AMD here because it tends to backtest quite well:
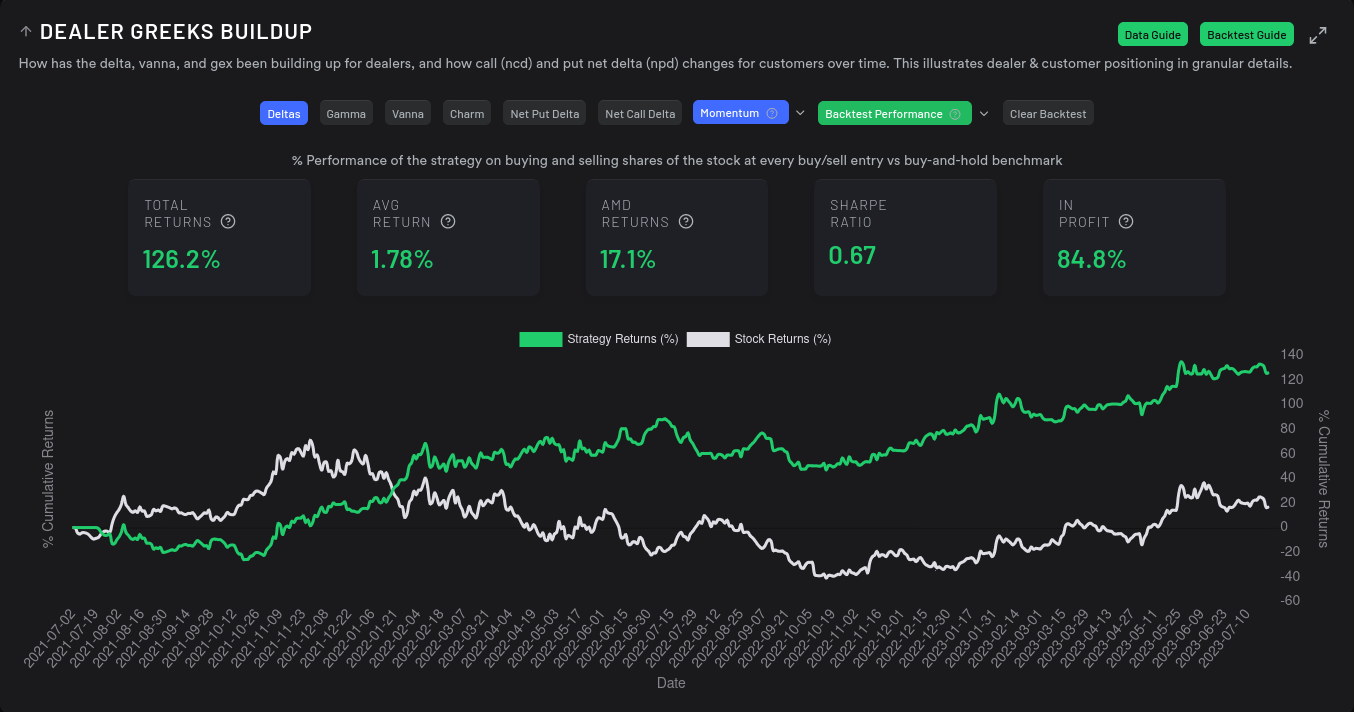
Past performance doesn't dictate future performance, but it often rhymes. 😉
This data shows up in the open interest chart as well. Customers filled up last week with bearish bets, but they're pretty quiet between now and a bullish 8/18:

Gamma exposure (GEX) also suggests that $121 has a chance of pulling price upwards, but we might get stuck on some resistance at $113, $117, and especially $119:

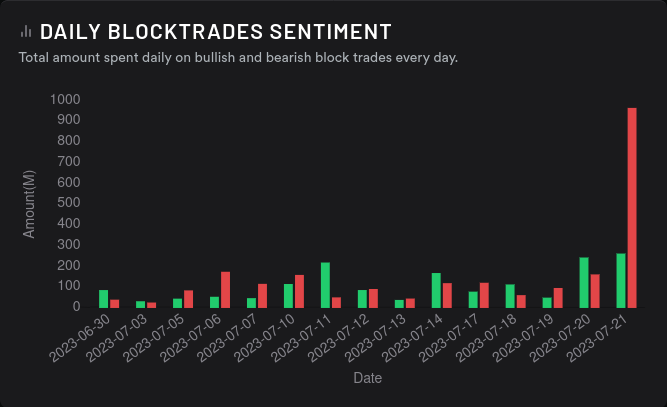
Big money traders seem to be going bullish this week on the $115 strike:

Dark pools
I like using dark pools to correlate what I've found elsewhere on charts and in options positioning. The big change this week is a massive buildout of volume between $111 and $112:
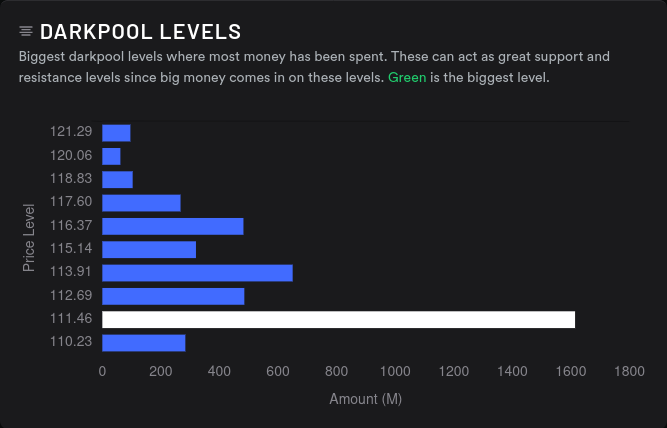

As a reminder, last week's dark pool volume was spread out much more from $110-$115 but this week is heavily concentrated at $111-$112. Friday saw a ton of volume that was overwhelmingly bearish and this might help to explain the consolidation around $111. This leads me to think that the $109-$111 level will provide some decent support going into earnings.
Options flow
Our last bit of data comes from last week's options flow:
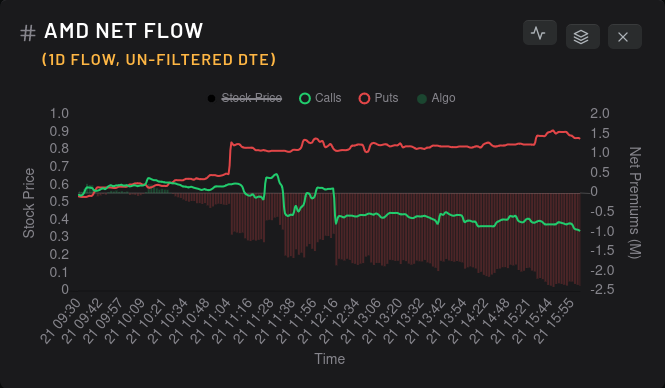
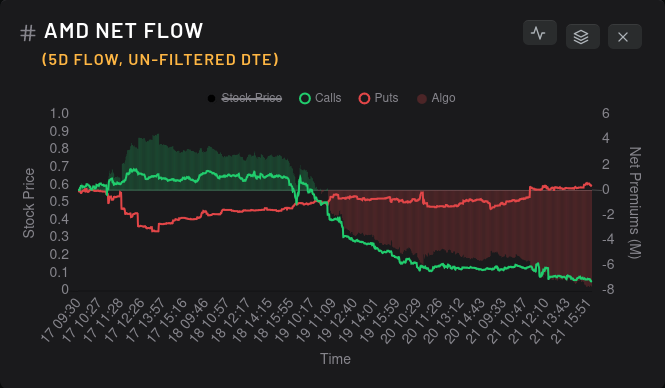
Puts overtook calls on Wednesday and never looked back. However, one thing to notice here is that put premiums didn't increase drastically. This was more of a selloff on calls.
Another thing to keep in mind that AMD's price moves will be affected by the overall market movements.
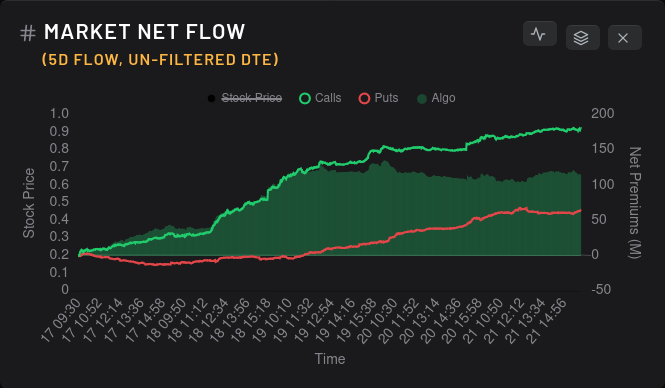
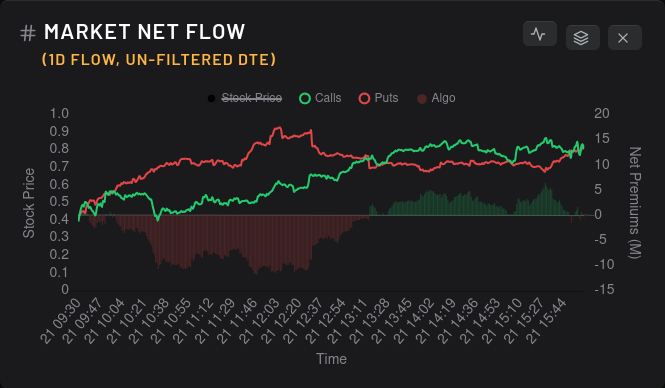
Friday saw a good move up in the market but AMD didn't benefit much from that. 7/28 was monthly OPEX date and sometimes unusual things happen on these days. The overall options flow from the market is in interesting territory as bets on calls and puts are both on their way up. My guess is that everyone is rushing to get their bets in place for the interest rate announcement this week and the massive wave of earnings calls.
The amount of earnings coming out this week is crazy:

Wrapping up
I plan to make bets this week on AMD bouncing between $110 and $115. If we somehow get a bump past $115, I'll be watching the $117 line very closely. We've hit liquidity problems between $118-$120 so many times and I'm looking to see if those problems break down this week.
I have doubts we will clear $117 with volume, but if we do, our next two important levels sit at $128 and $136.
I have short puts from $111-$117 right now with a couple of short calls in the upper $120's through earnings. You can track my trades on Theta Gang and I log them within a few minutes of execution.
Good luck to all of you out there! 🍀
Discussion