First analysis of SMCI
SMCI's meteoric rise earlier this year was followed by a consolidation since August. Charts and options data paint a different picture for the future. Which is right? 🤔

Happy Thursday! 🌄 Yesterday was a wild day in the markets with a hold on interest rate changes and an increased amount of cuts in 2024. Many people in my feed are saying this was a terrible move that sets us up for a hard landing, but others say the market has changed a lot and this move was the best one. 🤷♂️
I've been a Supermicro customer more than once before and their products have a great balance between quality, price, and durability. Another trader in the Theta Gang group has traded them for a while and I decided to give them a look!
All investments come with significant risks, including the loss of all capital. Please do your own research before investing, and never risk more than you are willing to lose. I hold no certifications or registrations with any financial entity.
Let's get into some data for SMCI!
Vanna
SMCI has a mostly bullish vanna chart here, but it's quite flat below the current price. That gives me a slightly uneasy feeling since we don't have much support down there. (Once you look at the chart, you might see why.) Thanks to Volland for these charts!
On the bar chart, our biggest bar sits at $290 and it's the biggest magnet for price movement. $280-$300 is a good region for upward price movement. There is a bar out around $350 but I tend to ignore single bars out by themselves on the chart because these can sometimes be misleading.
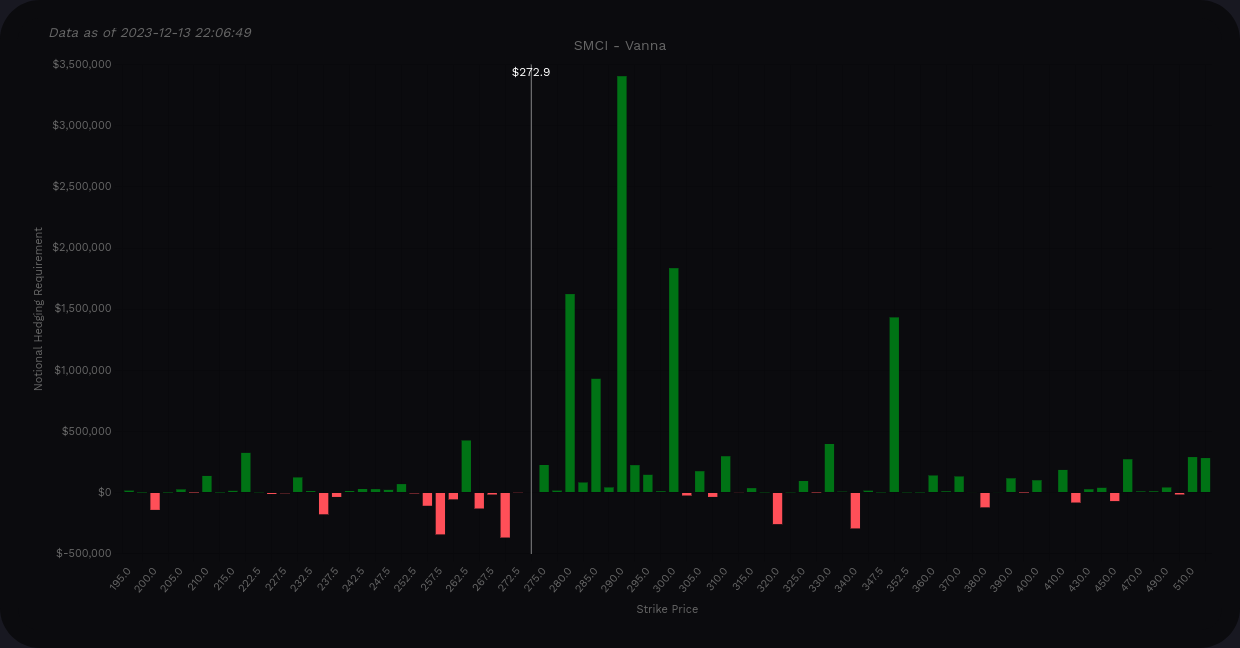
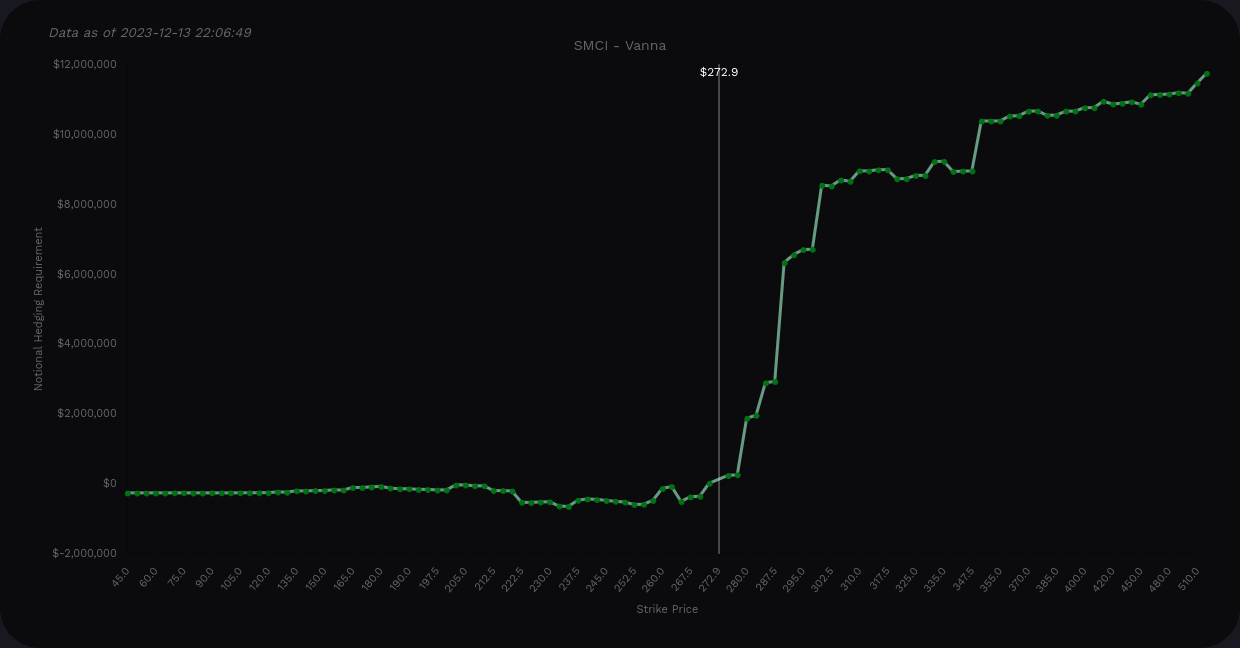
SMCI vanna across all expiration dates
Are you trading the next monthly expiration in January like I am? The pattern looks much the same there with the $290 bar being a very clear target.

Gamma
Volland's delta-adjusted gamma (DAG) suggests we have local support at $270 and our biggest resistance around $290. That makes sense because our biggest vanna bar is there and there's not much to pull price higher from there.

Institutional trades
I told you that you'd understand the support comments once you see the chart. 😉
The chart from Volume Leaders shows the second biggest trade in SMCI hitting a few months before a meteoric rise in the stock. Just imagine getting in around $84 and riding this one to $254 where we see the #7 trade. 🤯
Since the big rip, there's been a ton of trading in a channel from about $225 to $275.

Let's zoom into this channel to see what's happening. That climb over $280 didn't get much institutional interest and it quickly came back down. Once it was back in the channel, we see a lot more trades.
The biggest level here is $275 followed by $250. SMCI seems to have support around $230 that it has bounced from multiple times. The #4 biggest trade appeared at $249 and we just had #3 come in at $273. It's difficult to tell which of these are opening and closing trades but many of them aren't even numbers which leads me to think that profits might be taken up here.

Charts
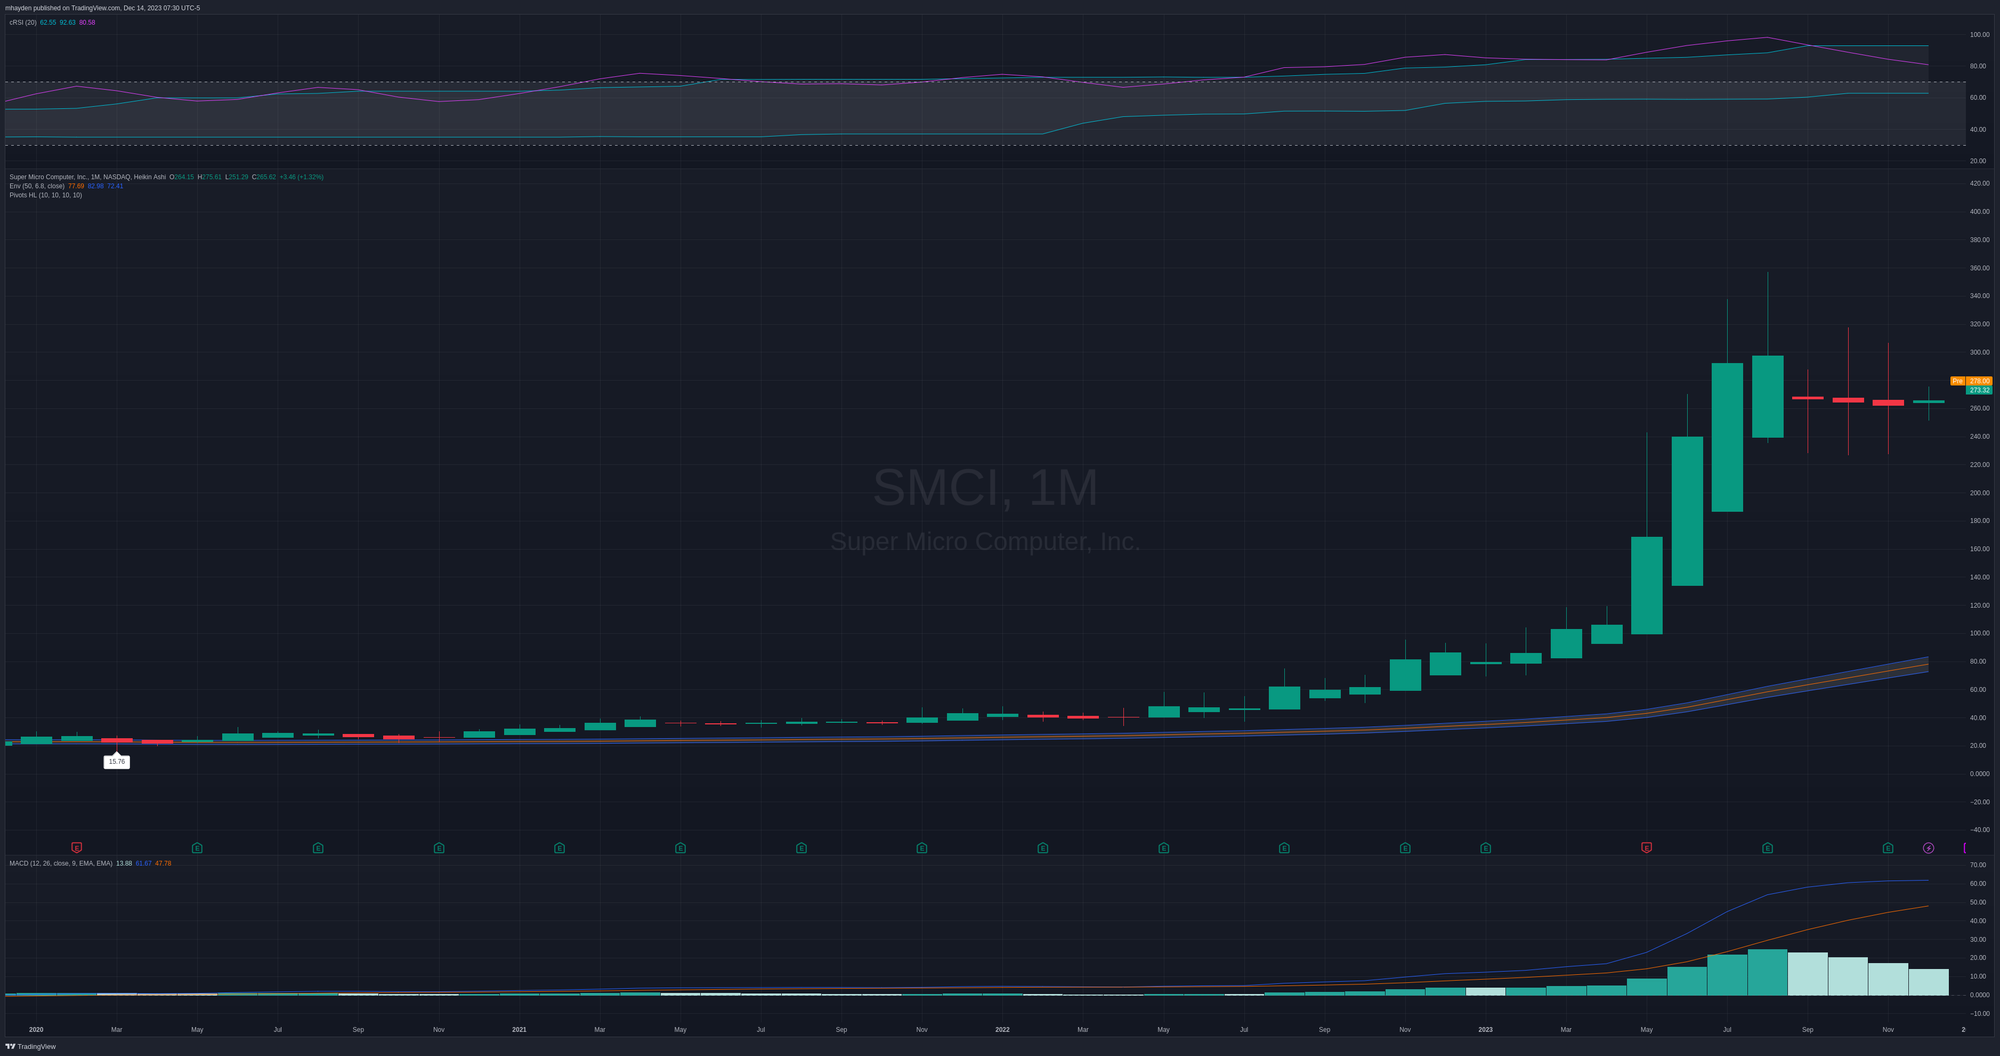
The monthly chart since COVID is incredible. This one makes it easy to see that we're consolidating and price discovery is underway for SMCI. RSI is cooling off and MACD is doing the same above zero.
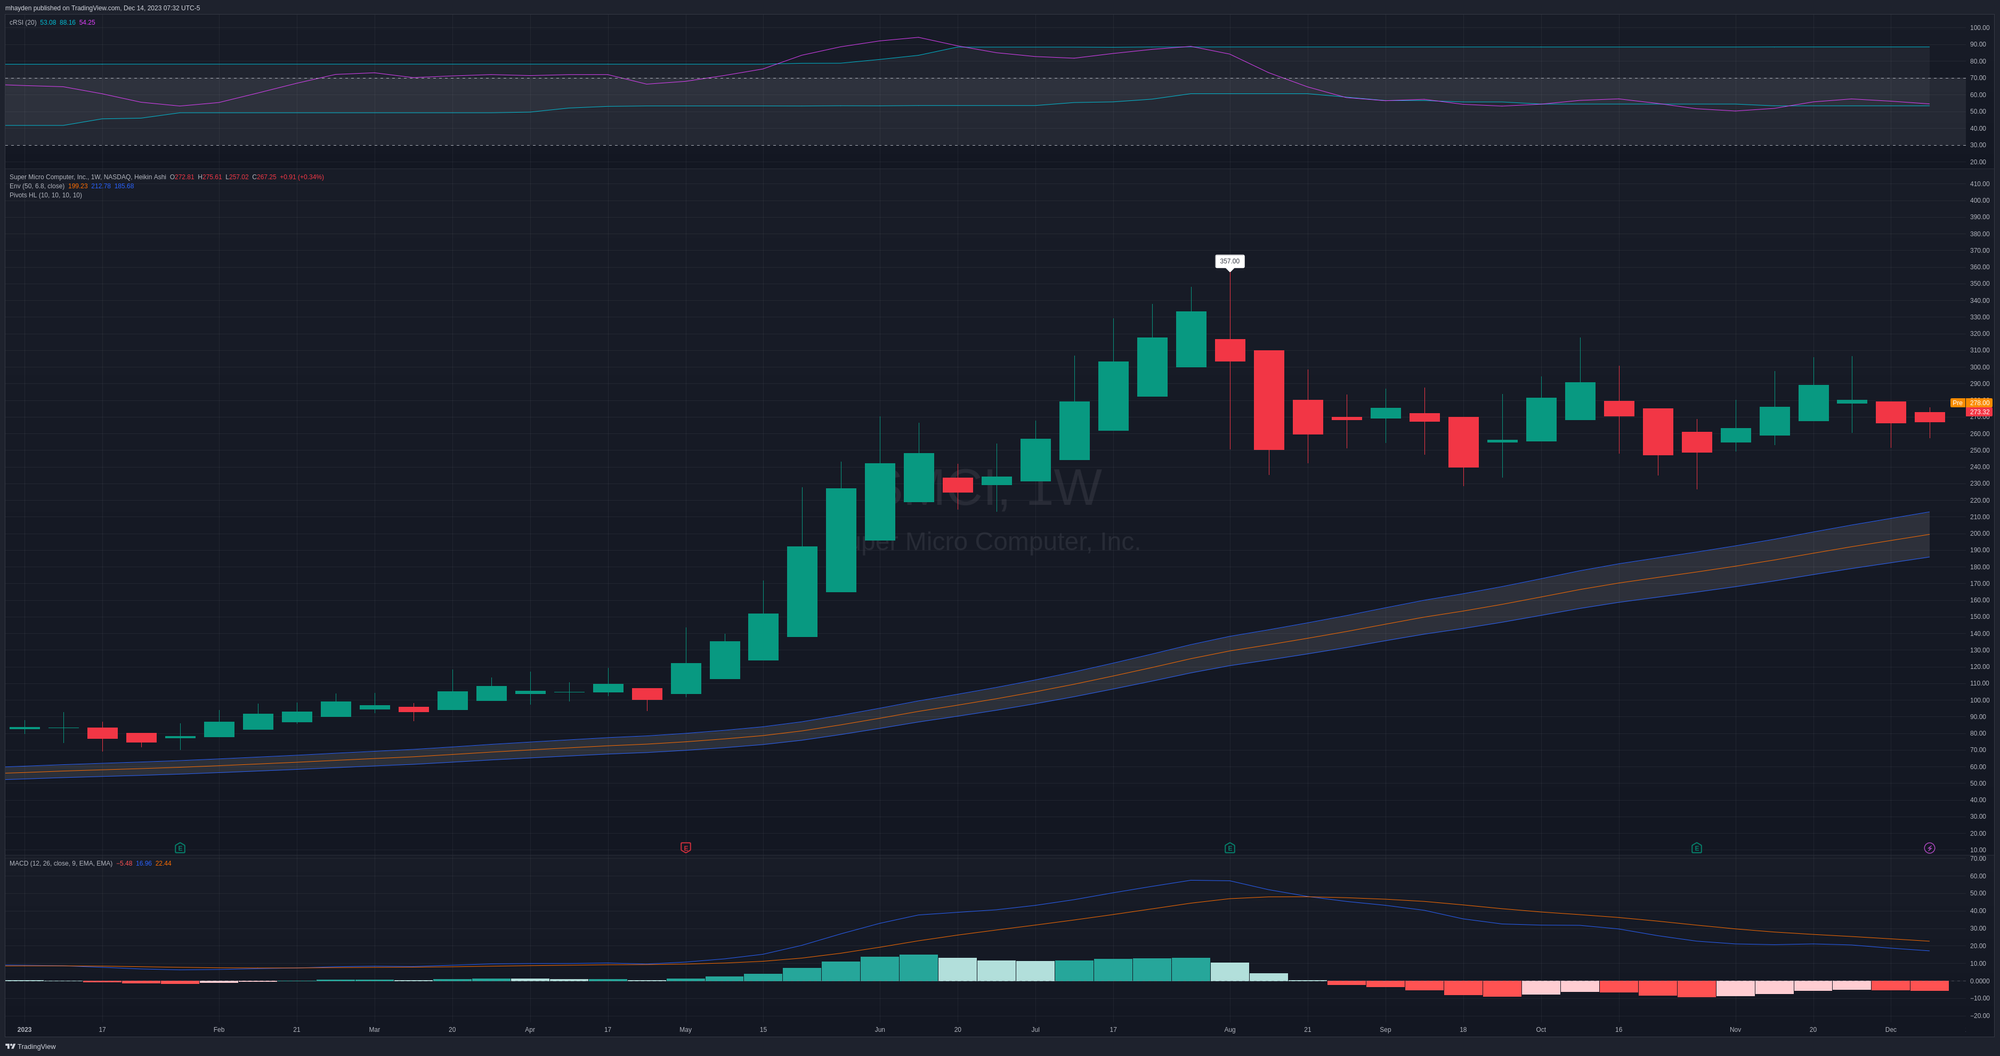
The weekly chart for 2023 shows this consolidation as well. These recent moves put the stock in a really great spot with a cooling RSI/MACD and it gives time for the 50 day moving average envelope to move up. The MACD bearish cross happened in August but there was no way that SMCI could have kept that momentum going throughout the year.
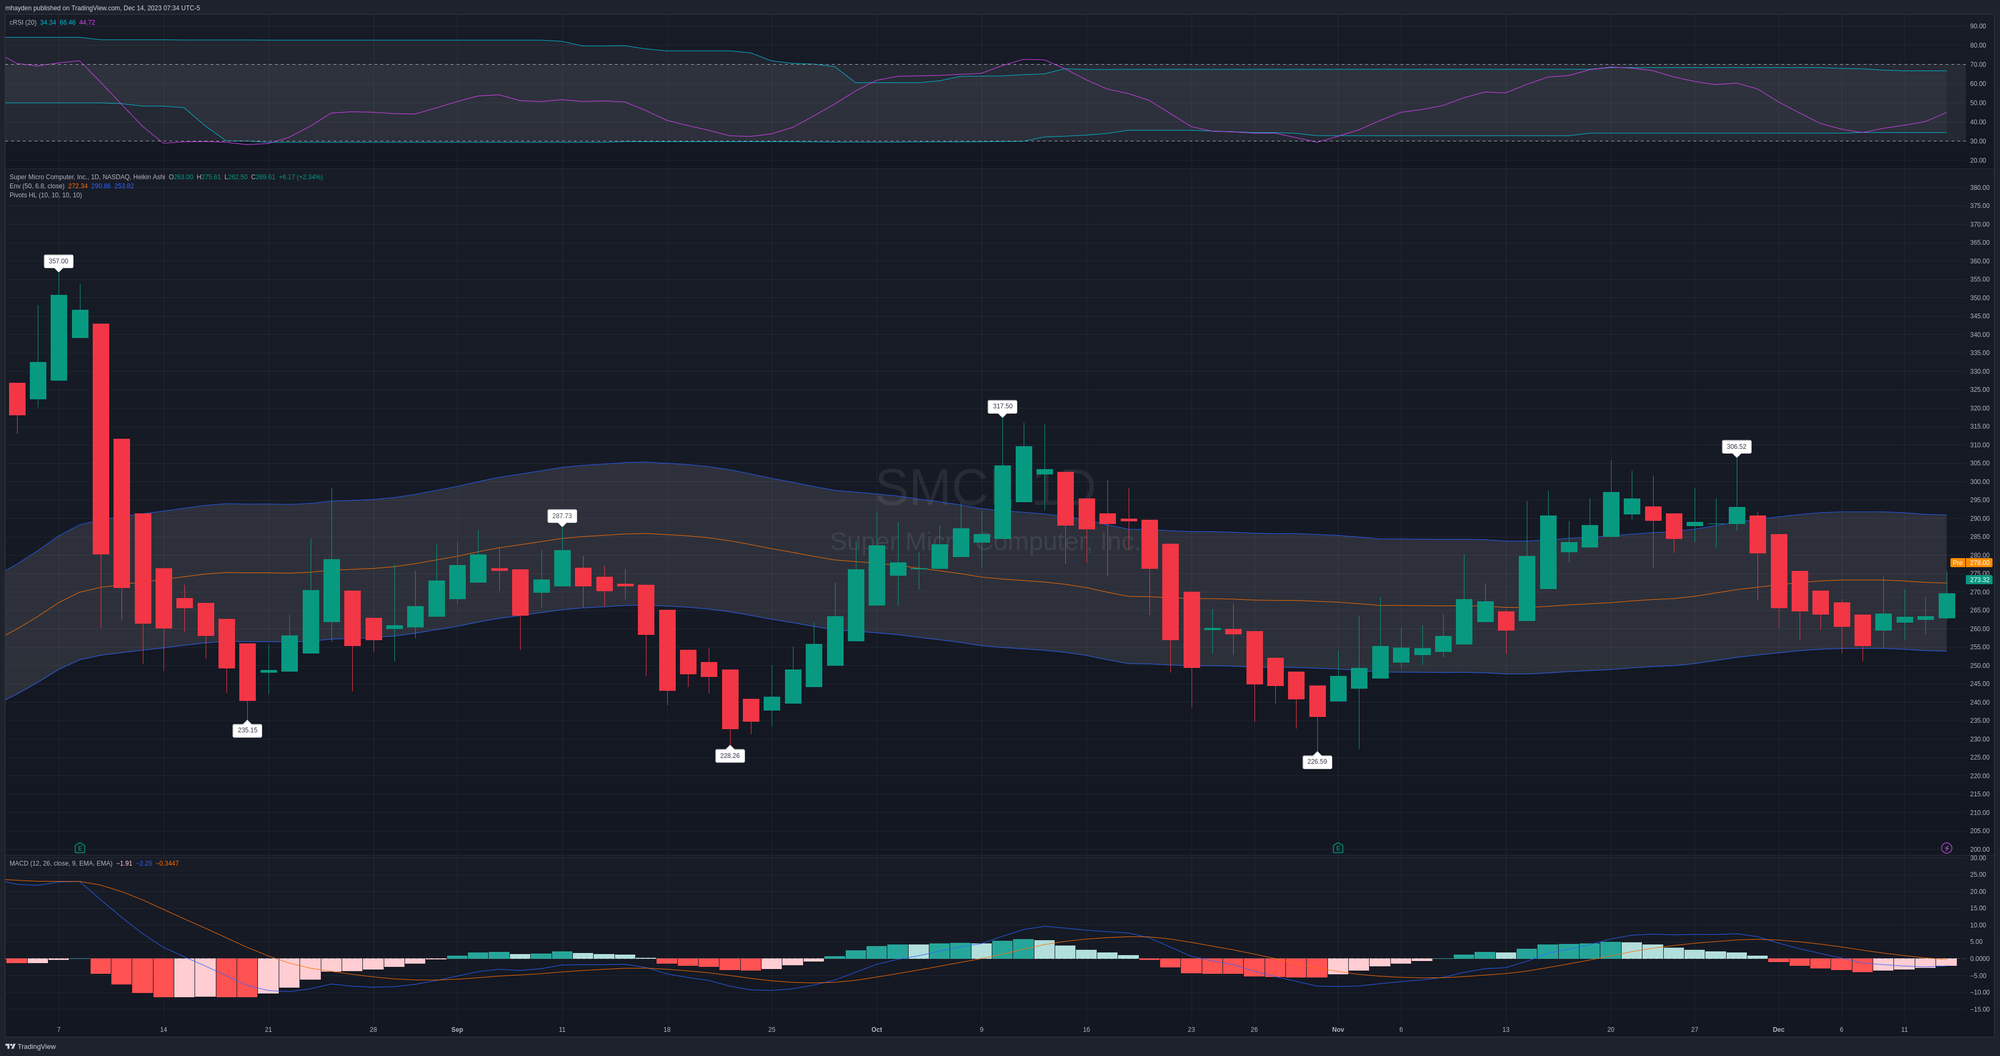
The last chart here is a daily chart since the big rally ended. SMCI bounced off the $225-$235 range three times and then made a higher low recently. Could we see a higher high soon?
The MACD shows a bullish confirmation on the recent higher low, which is a good bullish sign. The RSI made the same confirmation and it has plenty of room to climb. the 50 day MA is tilted downwards slightly but it's very bullish on all other time frames.
Thesis
I've been burned by some of these stocks with a meteoric rise in the past, but I do like the consolidation pattern happening now with SMCI. It recently made some bullish confirmations on shorter time frames and I'm hoping that's a signal that we might be grinding higher in the near term.
However, vanna and gamma suggest we're capped out around $280-$290 and that would definitely force us to post a lower high. Institutional trades also suggest this same thesis since it's difficult to find the traders with deep pockets above $280. 🤔
So we're in a pickle here with the chart and options data suggesting two different narratives. Which one will win? I'm betting on theta decay with more consolidation. 😜
I sold the 1/19 $220p on SMCI for $4.30. That's right around 2% return on risk and it was 0.15 delta when I sold it. I'm normally selling around 0.16 to 0.22 delta, so this ranks as one of my more conservative delta trades. It was up around 33% yesterday afternoon and I have a limit order to close it at 50% (my standard plan).
Good luck to everyone today! 🍀


Discussion