Friday vanna-rama for October 27

Trading options with vanna can be fun (and profitable sometimes). Let's get into this Friday's vanna charts from Volland. 📈

Welcome back to another edition of an all-vanna Friday post. If you're still a bit confused about vanna, go back and read my Trading options with vanna post from earlier in the week. I tried to cram as much information in there as I could. 😉

All investments come with significant risks, including the loss of all capital. Please do your own research before investing, and never risk more than you are willing to lose. I hold no certifications or registrations with any financial entity.
All of the charts come from Volland. Let's get to those charts!
SPX & SPY
I'll be looking at vanna through 12/29 for all of these charts today as most of my trades are targeting 12/15 or earlier.
First up is SPX, and the overall curve looks oddly balanced at the extremes. There's an ever-so-slight negative tilt on vanna but I will treat this as a fairly balanced curve.
The bar chart here looks a bit like an eye chart, but I zoomed out so we can see more of the full picture. There's a zone from 4250-4300 with extremely large negative vanna lines that will fight any move towards those levels. That could be our top end for a short while unless they move elsewhere. The optimists out there should note that 4500/4515 are the tallest positive vanna bars on the chart. 😉
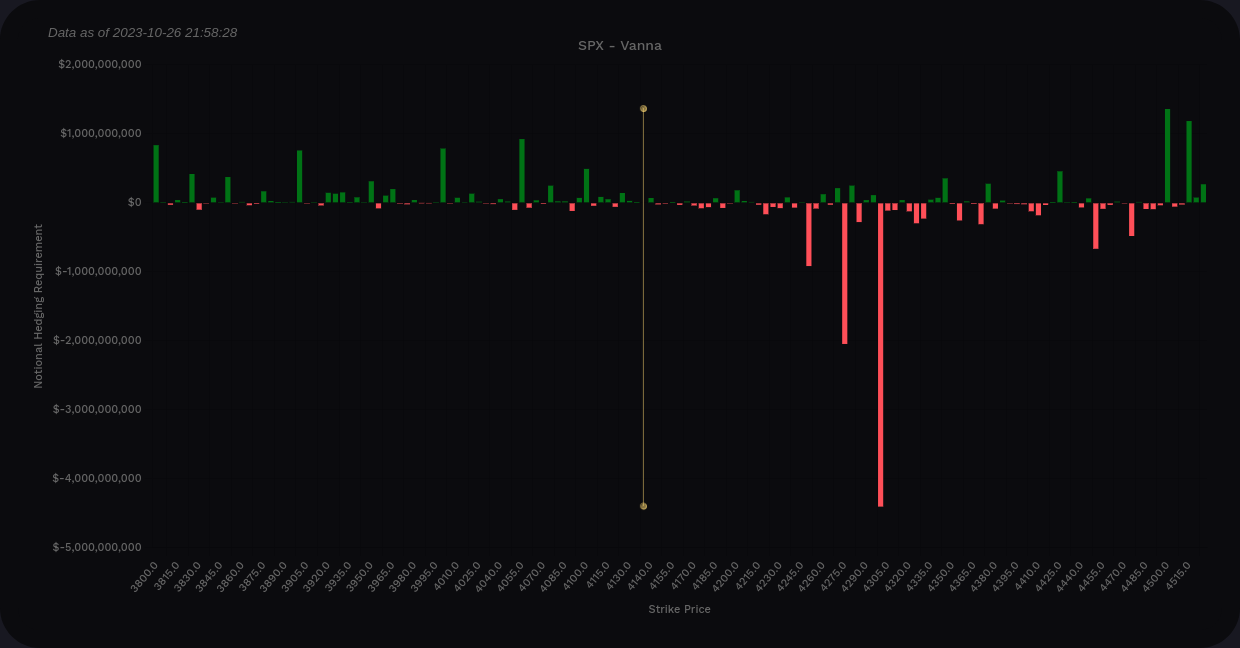
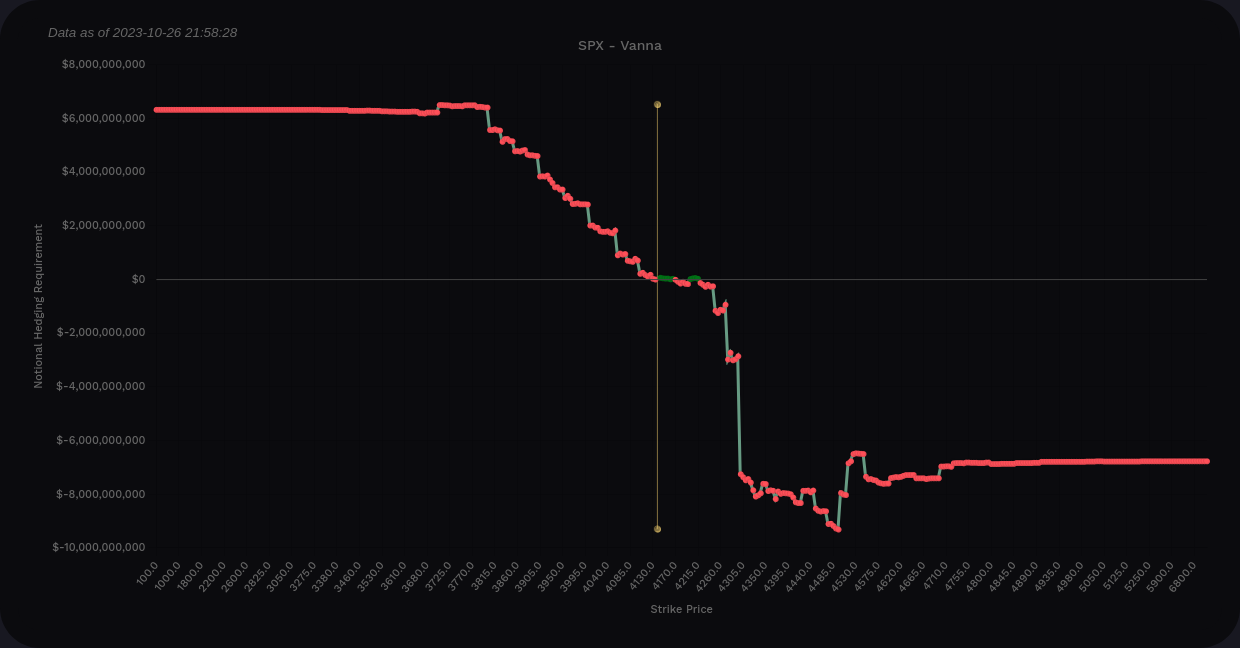
SPX vanna through 12/29
My big question lately is where SPX and SPY might catch some support and consolidate. The chart suggests 4130 to 4050 as some support levels from some old order blocks.
Below the current price, SPX has some support at 4055, 4000, 3900, and 3800. However, these levels are fairly small. 4055 is the bottom of the lower May order block, so this will be a level to watch for sure.
SPY has different trading and hedging characteristics, so let's get a look there, too. Again, I'm only looking at vanna through 12/29.
The curve looks quite a bit different here with positive vanna on both extremes. This looks more bullish than SPX if we see IV contraction.
On the bar chart, our two largest lines appear at 400 (positive) and 421 (negative). I look at these a bit like "bookends" on a shelf where price might be held in for a while.
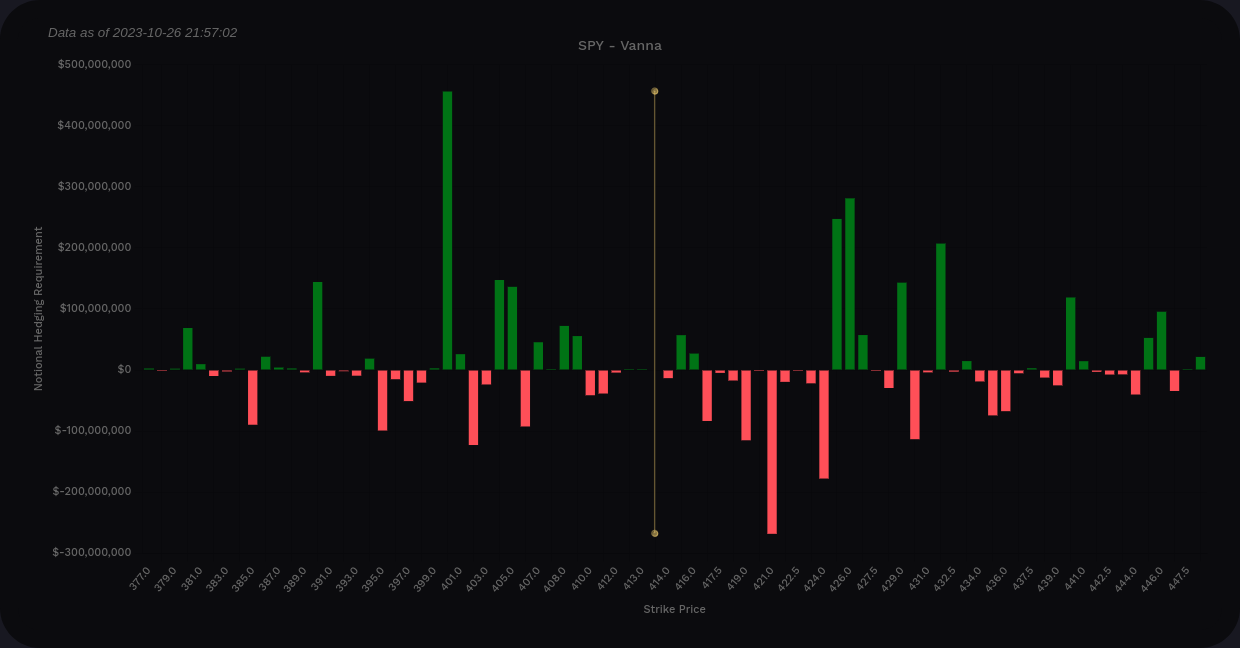
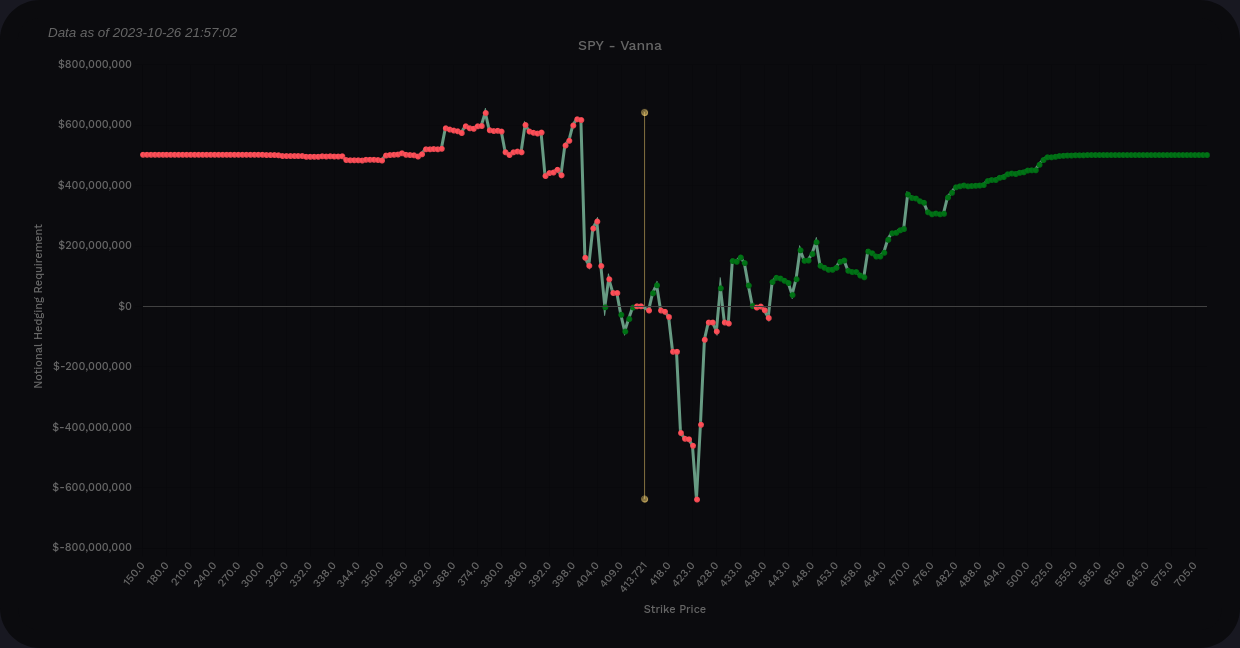
SPY vanna through 12/29
There are some decently sized positive bars from 425-432 that could pull on price if IV contracts, but that 421 level needs some mitigation for that to succeed.
If SPY slides a bit more, we get a little support around 408-409, more support at 404-405, and a huge wall at 400. That's a big psychological level there and crossing it would be a big deal.
SPY's May order block runs from 407 down to 404. Isn't it interesting that we see increasingly positive vanna there? 🤔 This could be our market bottom or consolidation point but time will tell.
TSLA
The vanna profile for TSLA has been really unusual lately. Most of the vanna has piled into a narrow range with only a few levels to consider. The curve tilts slightly positive at the extremes which means vanna may provide a small amount of upward lift if IV contracts.
Negative vanna at $210 will fight upward movement and we have some support at $205 and $200. However, these levels are relatively low to what I've seen seeing from TSLA lately, so vanna might not be having a big impact on TSLA's moves right now.
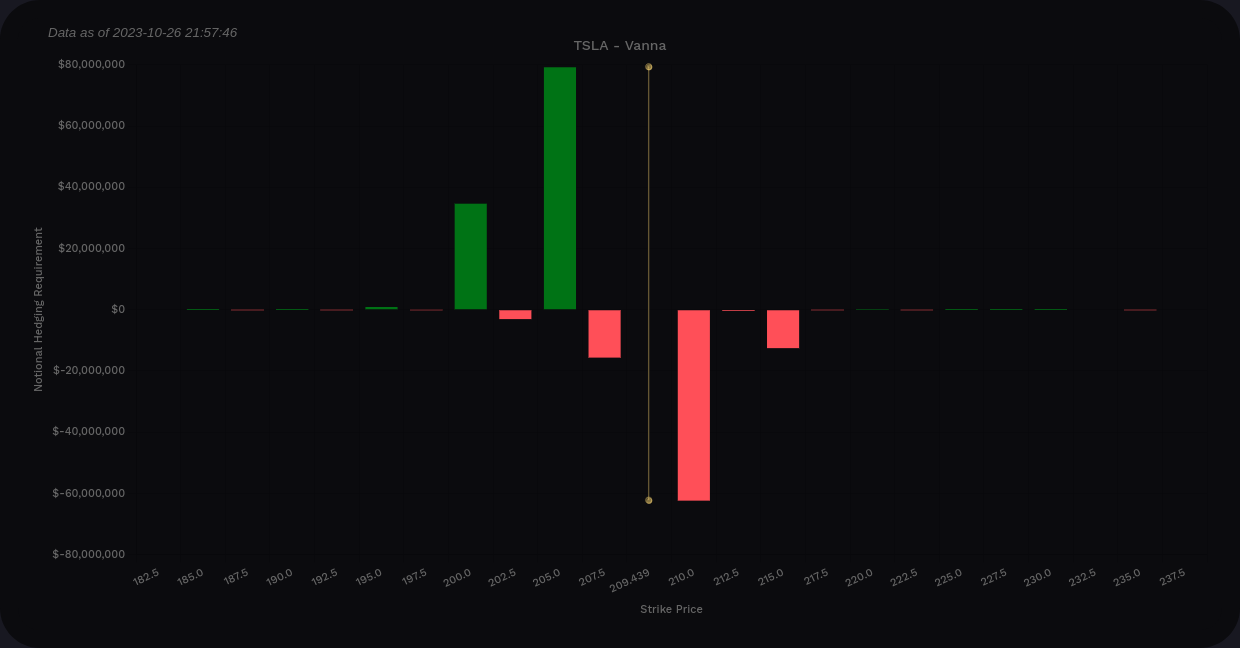
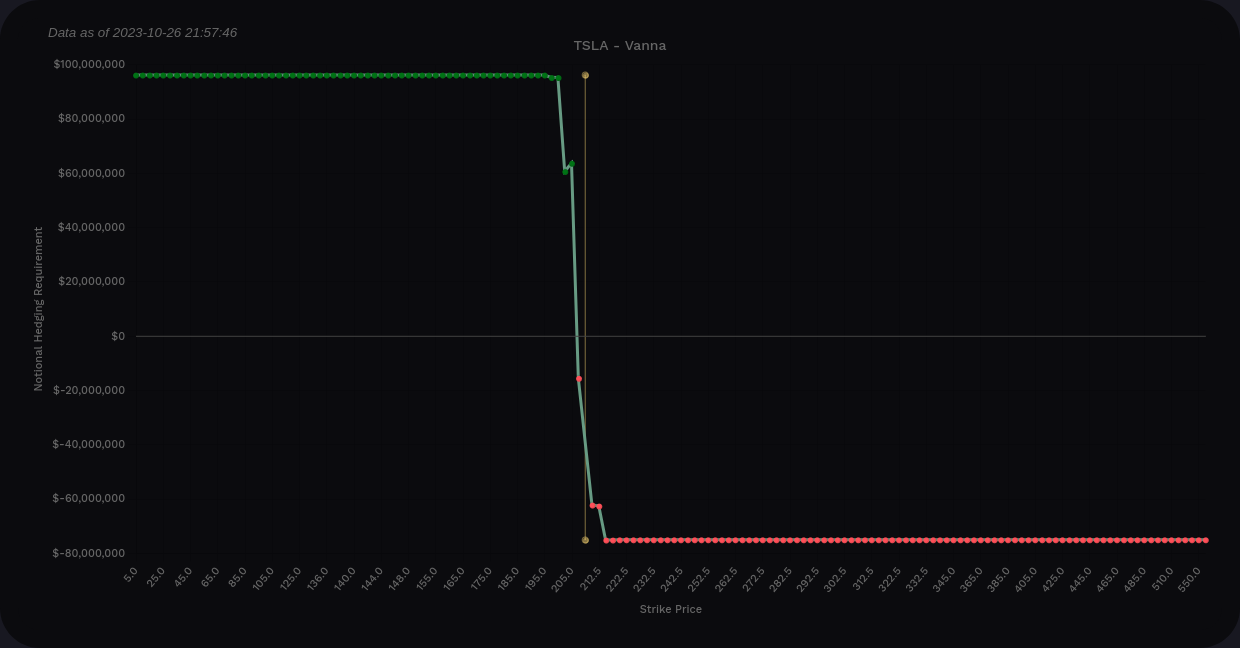
TSLA vanna through 12/15
The only thing I really have marked on my chart right now for TSLA is an order block way down at $160 from May. This vanna chart doesn't help much with trade planning. 🤷♂️
AMD
Earnings are coming up on 10/31! 🎃
The curve is positive at the extremes and our bookends here seem to be $90 and $100. There's a negative vanna line at $95, but we are really close to that price this morning.
Remember that vanna needs room to operate and has the strongest effects on price around 0.15-0.35 delta. I'd argue that this $95 level is pretty much dead this morning and is not having an effect on price.
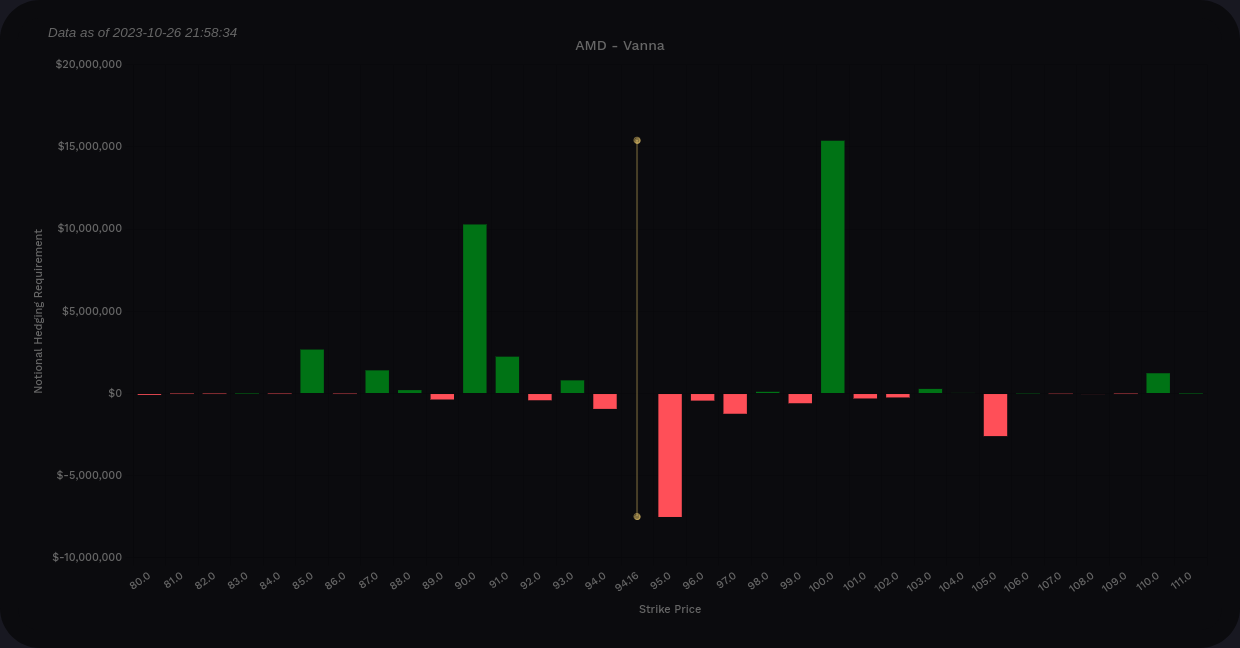
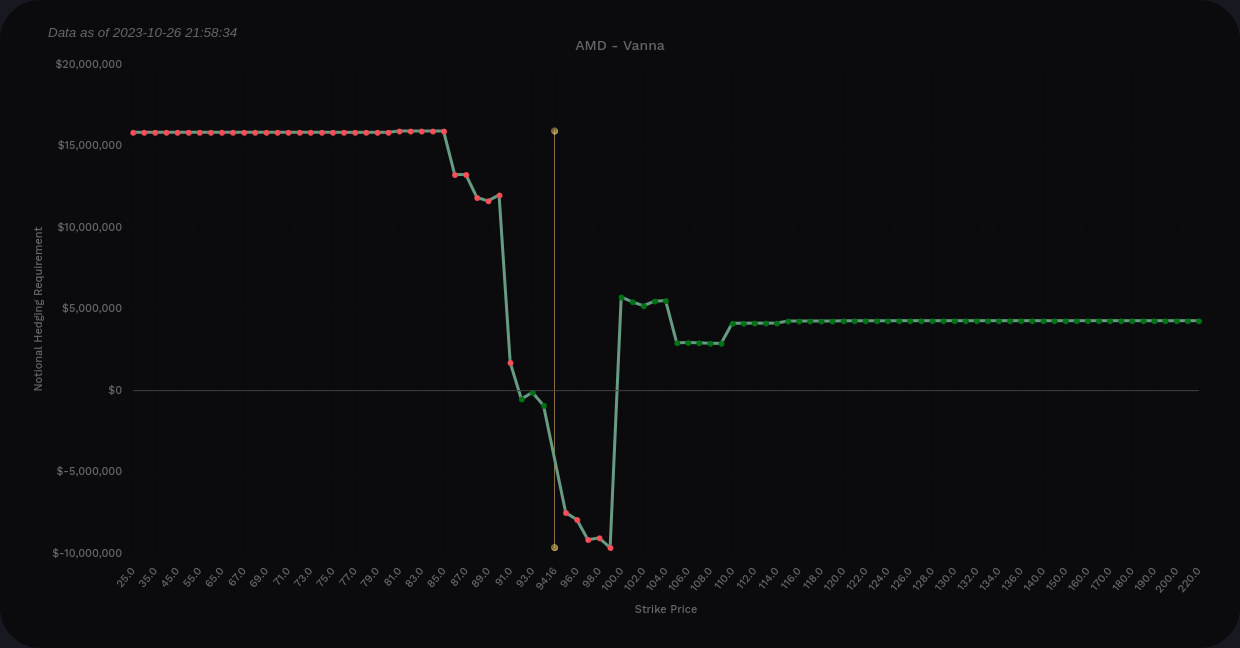
AMD vanna through 12/15
As an added bonus, let's examine AMD's delta-adjusted gamma (DAG) through 12/15. If you remember, DAG is just a regular gamma chart with the gamma levels above the price flipped for your convenience. You can read these as dealers buy on green bars and sell on the red ones.

Our main selling areas are around $100 and $90. We get some buying pressure around $94-95 and that's about it. Traders have really liked keeping AMD held in channels usually $10-$15 wide since the summer highs.
Thesis
We're still knee deep in a mixed earnings season. Companies are posting earnings results that vary quite a bit and traders are treating all of them differently. I've seen these vanna levels shift wildly lately, especially for TSLA, and I'll try to keep these updated every Friday.
I got myself wrapped around the axle on some bullish trades lately thinking we were going to make a turn and I'm beginning to get punished by gamma on the weekly trades. 🤦♂️ These are tough lessons to learn and I'm still assembling a list of things I want to change for next year.
This is one of the main reasons why I log all of my trades including the reasoning that I used to make each one. That helps me go back and understand why a certain trade worked out and why another one did not. If I'm honest with myself as I go into the trade, I should be able to honestly analyze the result later. 🤔
Good luck to everyone today and I hope you have an awesome weekend. 🍀 🌴
Discussion