Monday analysis for 7/31

We receive AMD's earnings report tomorrow. What can the options data tell us about what might happen?

As we bid farewell to July, we're still in the midst of earning season. Check out my Charts and Coffee post from Sunday for some charts-only analysis of SPY, AMD, and TSLA.
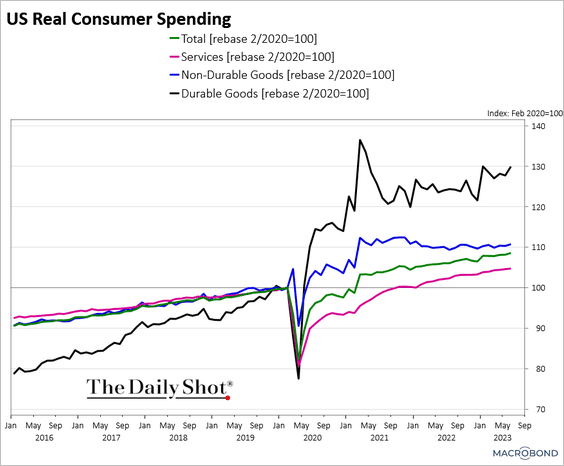
In broader economic news, there's good news and some things worth being concerned about. US consumer spending continues to increase:
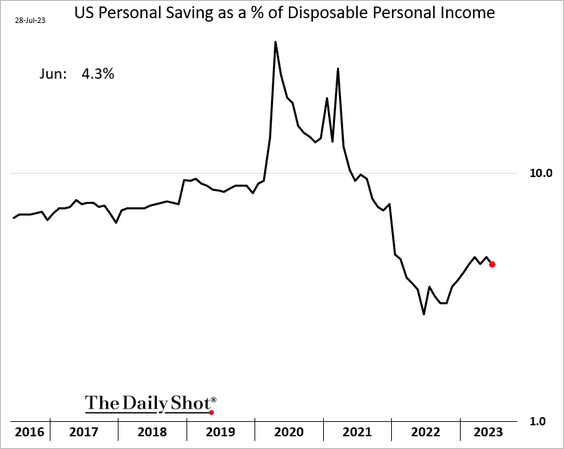
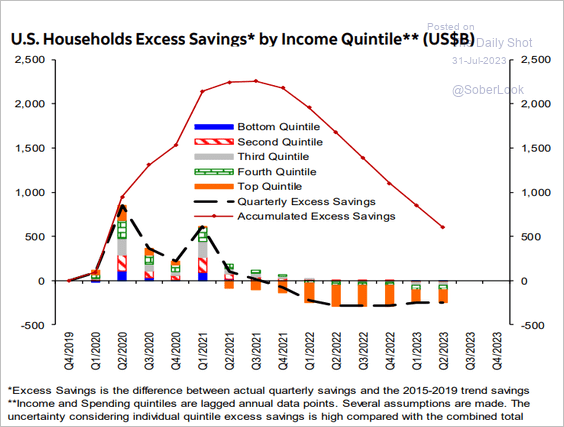
But there's a disturbing trend happening with excess savings.
Retail inventories continue to climb as well. This might be a sign that supply chains are working well again, but we've already seen some companies report excessive inventory in certain areas:

How will AMD and TSLA fare this week? Let's find out. But first:
All investments come with significant risks, including the loss of all capital. Please do your own research before investing, and never risk more than you are willing to lose. I hold no certifications or registrations with any financial entity.
Happy Monday!
AMD
First up, let's get a look at AMD's vanna chart that combines the 8/4, 8/11, and 8/18 expiry dates. This screams bullishness to me, especially since the negative vanna is so small and we have a concentrated positive gamma bar at $115. However, I'm a bit worried that I don't see more vanna past $115 other than the little bar at $120.
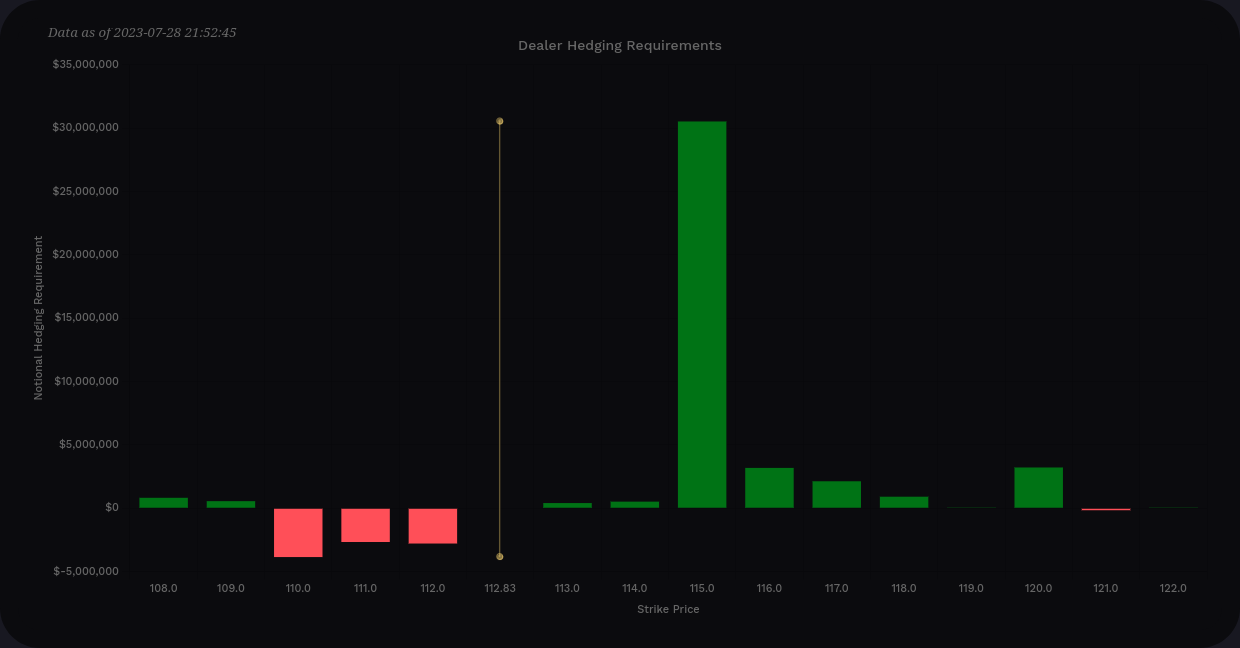
AMD's delta-adjusted gamma (DAG) again shows $115 as being a draw for price, but we need something else to push us further past there.
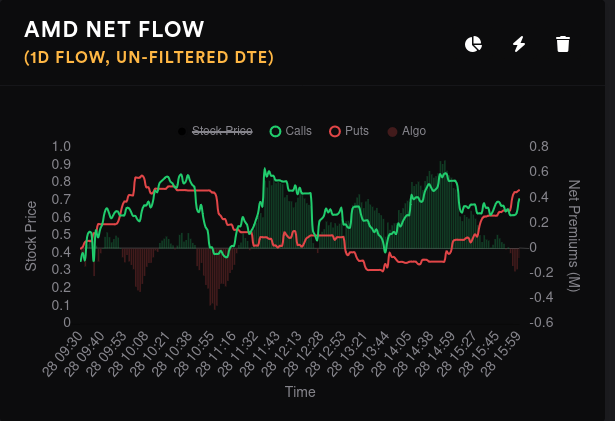
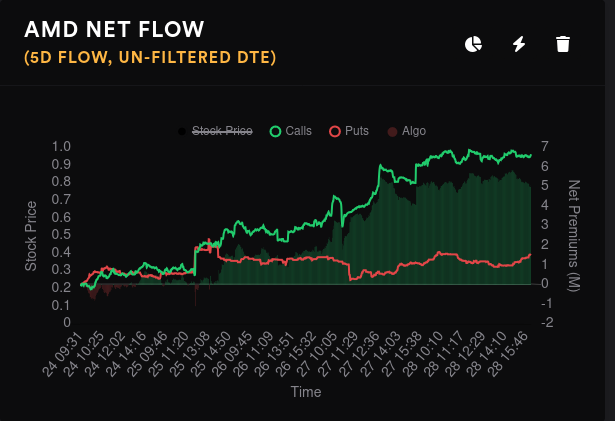
Friday showed a battle between bullish and bearish traders, but we had mainly bullish trading on aggregate for the week:
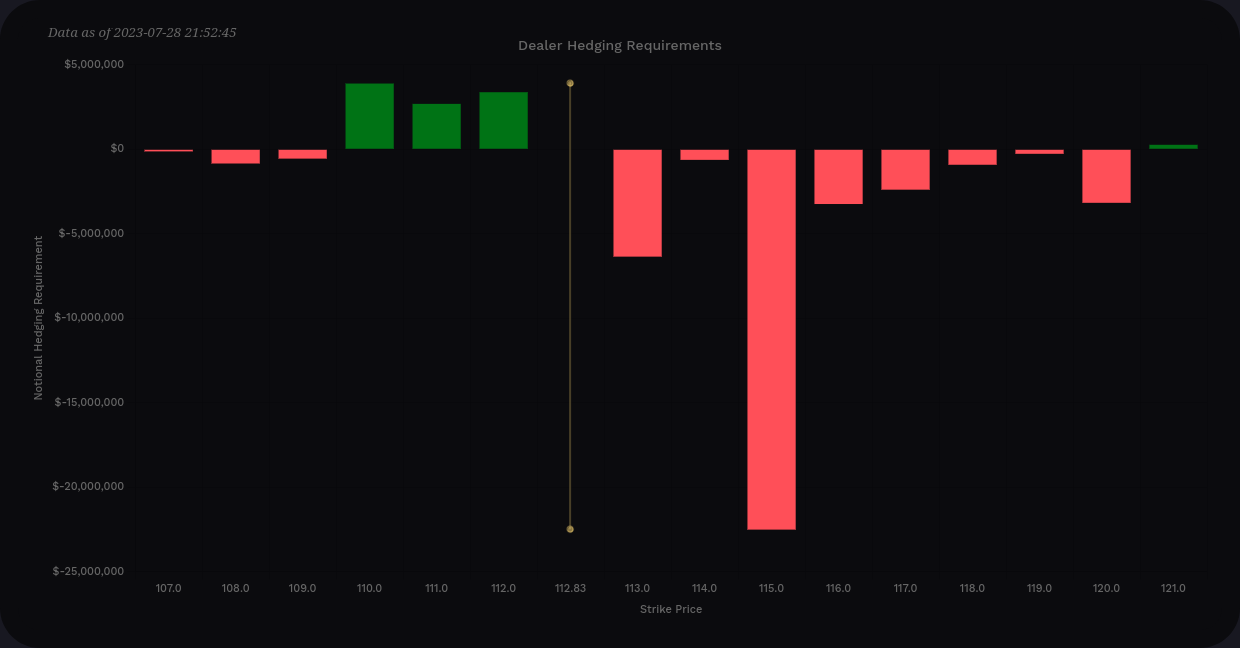
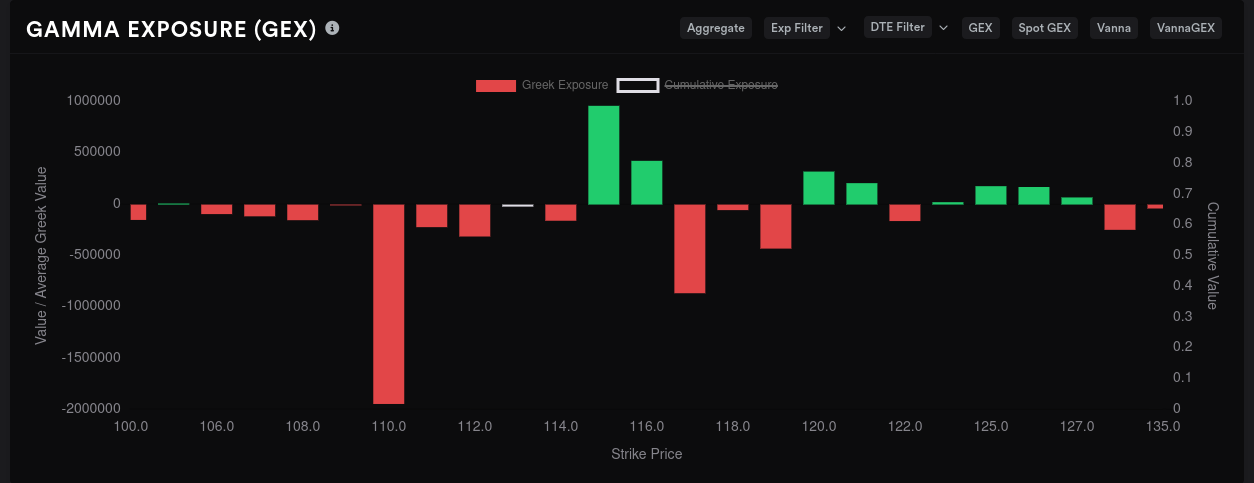
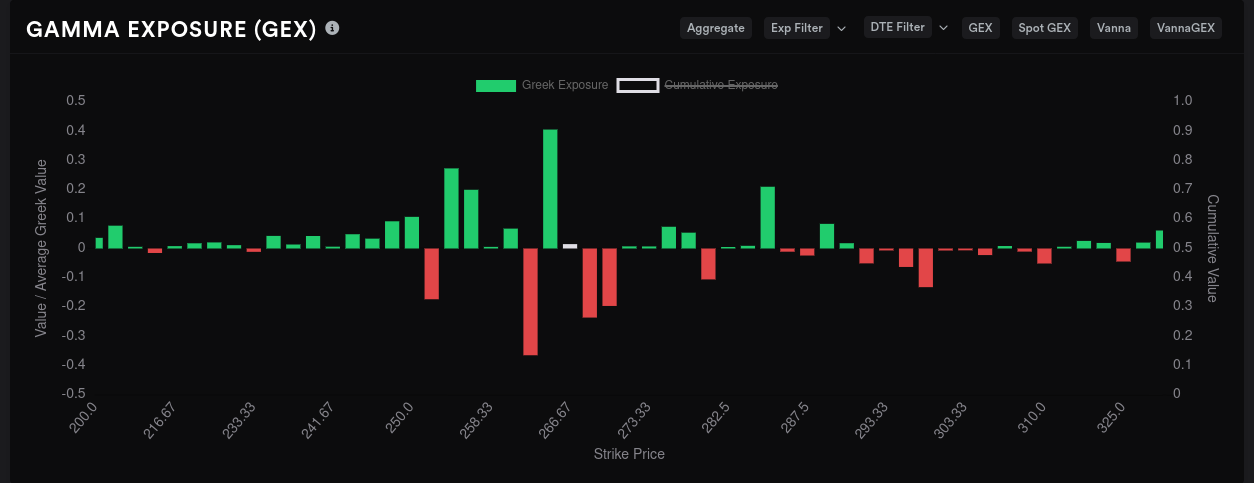
On aggregate, AMD's gamma exposure (GEX) shows the biggest price magnet sitting around $112 with our ever-so-familiar resistance from $113-$115:
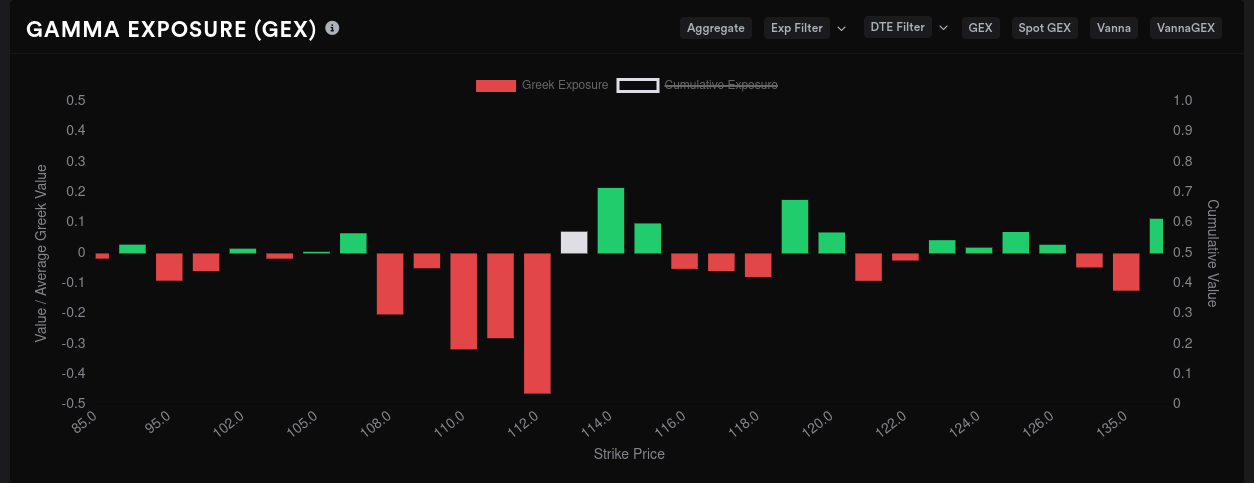
But if we use data from 8/4 only, we see a big draw to $110 with a smaller price magnet around $117-$119. However, we need to find a way over the resistance at $115 to make it there:
And it looks like 8/18 might be our ticket there. AMD's most bullish expiry is 8/18 and we have a GEX chart here that allows for mostly free running of price from $103 to about $125. As a reminder, AMD has wrestled with liquidity issues from $118-$120 in the past.

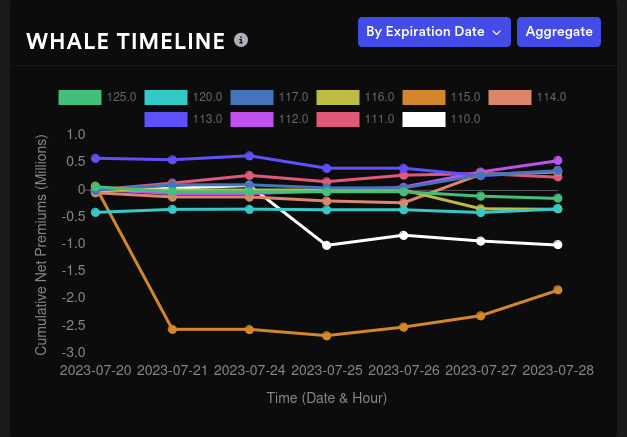
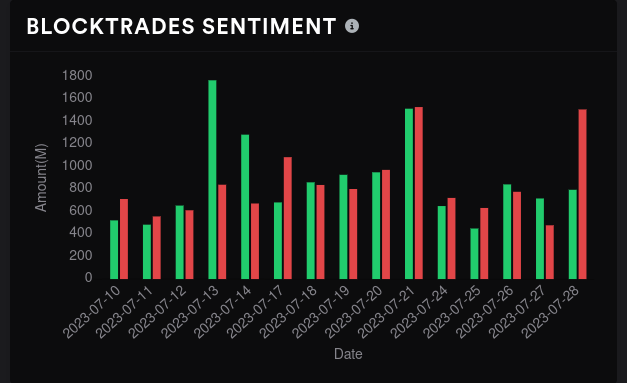
Big money options traders soured on the $115 strike recently but started getting slightly more bullish recently.
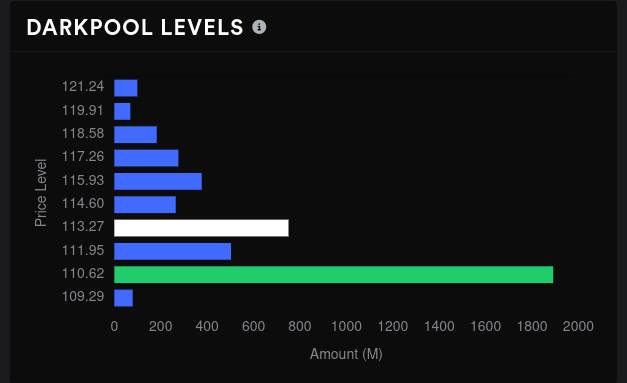
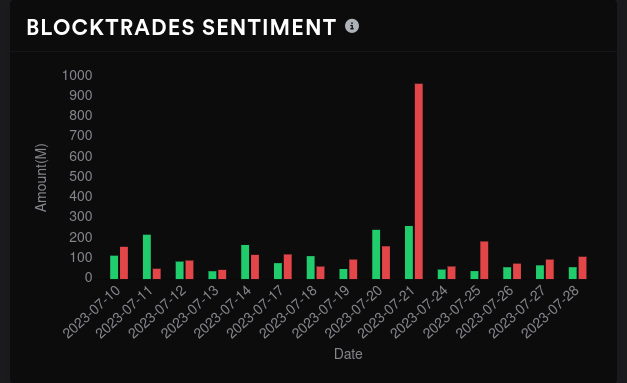
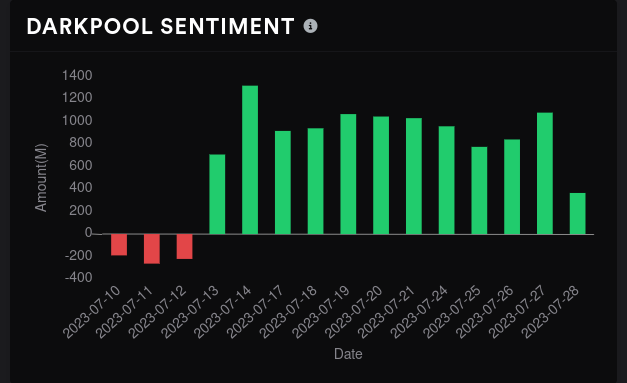
Can dark pool trades help us correlate this data a bit? AMD's been building out a big base around $110 lately, but the $113 level started standing out from the crowd late last week. Dark pools went fiercely bearish on 7/21 and have gone slightly more bearish since then:

TSLA
Vanna for TSLA through 9/15 is tightly packed and looking fairly bearish. Selling pressure shows up at $265 and $270 with a small amount of buying pressure in between:
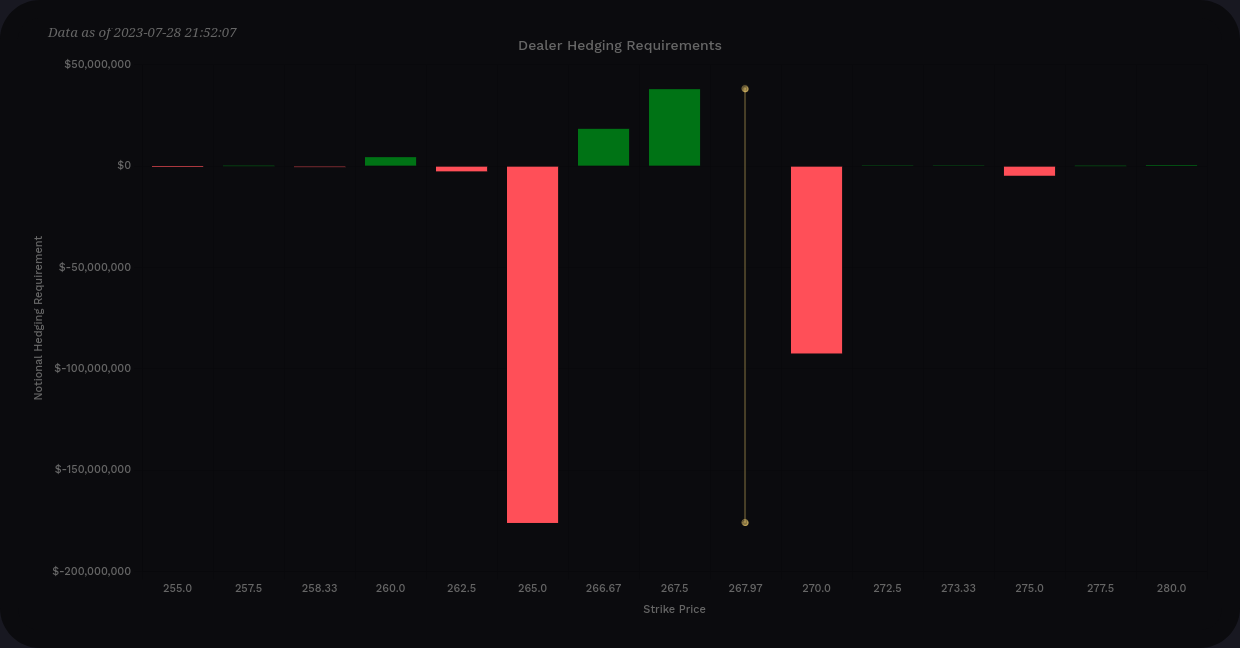
On aggregate, TSLA's GEX looks like it has a little room to run up to $270 before it starts running into resistance from positive GEX. Price could be drawn down to $262.50 since we find the largest negative GEX bar there, but the positive GEX bar at $265 should resist that movement:
Zooming into this week only (8/4) for TSLA shows that we have a free range from $265 to $275. If we get over $275, $280 is the level where price may be pulled. $285 shows up as the next resistance point. We saw last week that the positive GEX bars were respected really well.

As a reminder, TSLA is headed towards a bearish expiry on 8/18 (remember that this chart looks at contracts from the dealer's perspective, not the customer's) with some bullishness returning as we get further along in the year:

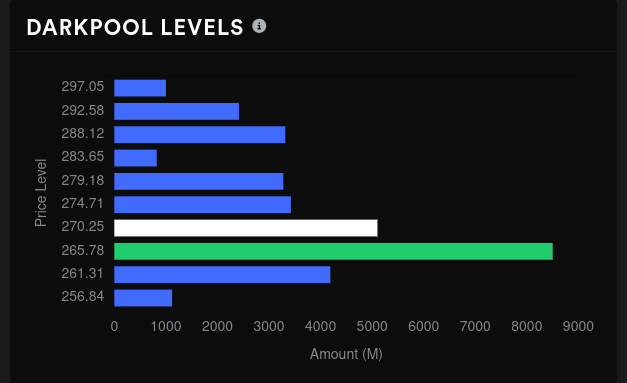
Dark pool trades show $265 as a strong level of support. Trades have been mostly bullish so far, but Friday took an abrupt turn downward on increased volume. These levels suggest we might find ourselves in a $260-$280 trading channel for a short while:
Thesis
TSLA looks like it might trade in a $260-$280 range, at least through 8/18. Big money traders are getting bullish in the $250-$260 range and I might consider selling puts at $260 or below if price wanders down there this week. However, as I noted in yesterday's post, TSLA's chart looks pretty overextended, so taking on a bigger position could be risky at this price level.
Then there's AMD. Earnings are announced after the market closes tomorrow, August 1. AMD seems wedged into a tight range for this week and next, likely from $110-$115 again, but keep an eye on that $113 level that began building last week.
The guardrails begin to pull away as we get into 8/18 and AMD has room to run. Sure, the upper end looks to open up to about $120 which is exciting. However, the bottom end could run down to the $105 area. If you've been waiting to get a position started or add to existing position, a price in the very low $100's would be a great opportunity.
As always, you can follow along with my trade notes over on Theta Gang. I'm starting this week with no options positions but a decent amount of long AMD/TSLA shares.
Good luck out there today! 🍀
Discussion