MSFT analysis for Nov 3

MSFT is wandering in some interesting territory. Are we looking at a break of structure with a move higher or are we dancing around at the top? Let's get some data to have an edge.

Happy Friday! 👋
This is the first time featuring some analysis on Microsoft for this blog. It's a massive player in the overall market as it's over 7% of the S&P 500 index and over 10% of the NASDAQ. Let's take a look at the available data and see where things are headed.
All investments come with significant risks, including the loss of all capital. Please do your own research before investing, and never risk more than you are willing to lose. I hold no certifications or registrations with any financial entity.
Here we go!
Vanna
Our first stop is a look at MSFT's aggregate vanna charts.
The curve is positive overall and it's much more positive above the current price than below. This suggests that MSFT has a good chance of getting bullish price pressure if IV comes down. The positive vanna below the current price is much smaller and is concentrated mainly in one strike.
On the bar chart, $300 and $360 stick out as massive bookends. Price would likely sink to $300 on a VIX increase and we could approach $360 if VIX decreases. There are some vanna levels above $360 that are fairly positive, but I'd expect to see them grow to see price cross $360.
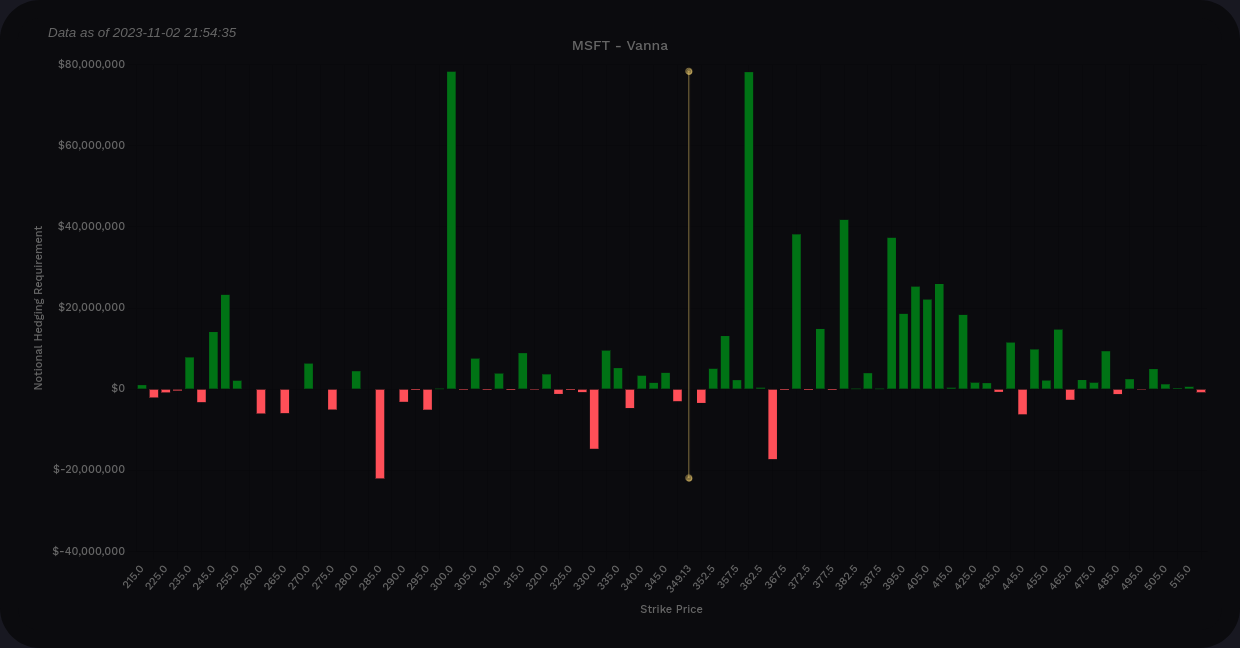
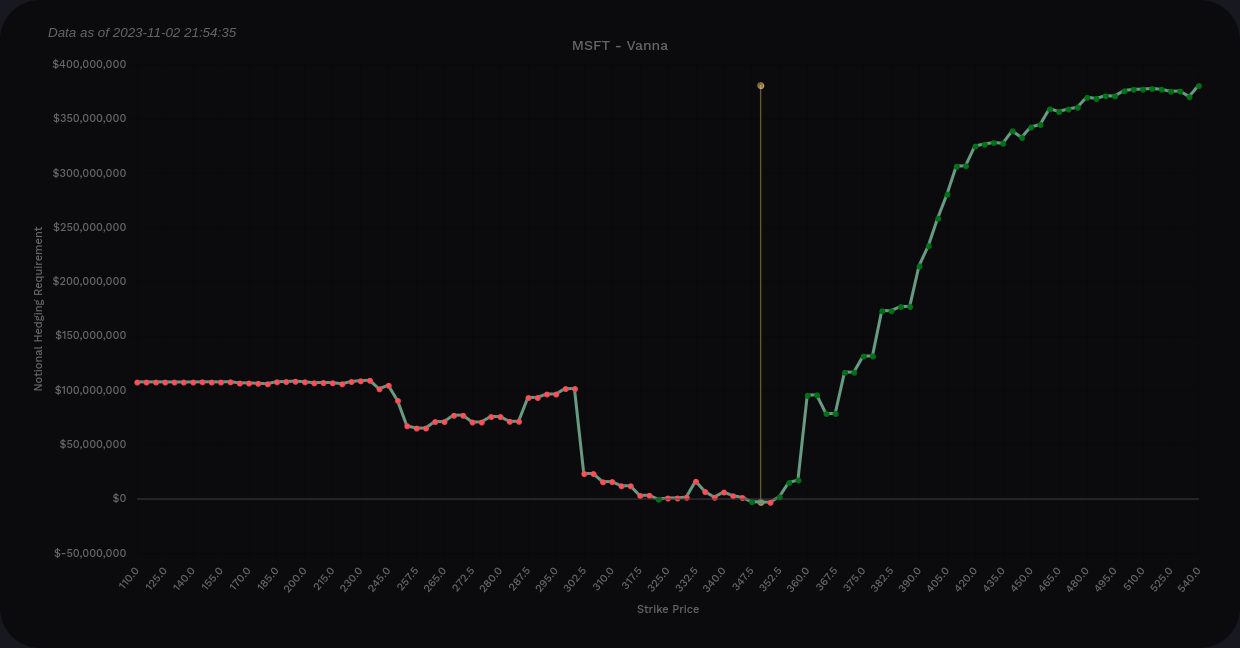
MSFT vanna chart from Volland
Most of my trades are focused on the 12/15 expiration, so let's see what's different for vanna on that date. The curve is still positive on the right side, but it's more negative on the left side. This feels a bit less bullish from a high level perspective.
On the bar chart, the first thing I notice is: Where did the $300 go? It vanished! We lost the support down there from vanna.
$360 is still quite strong here, but there's negative vanna just past it that will fight price movement above $360.
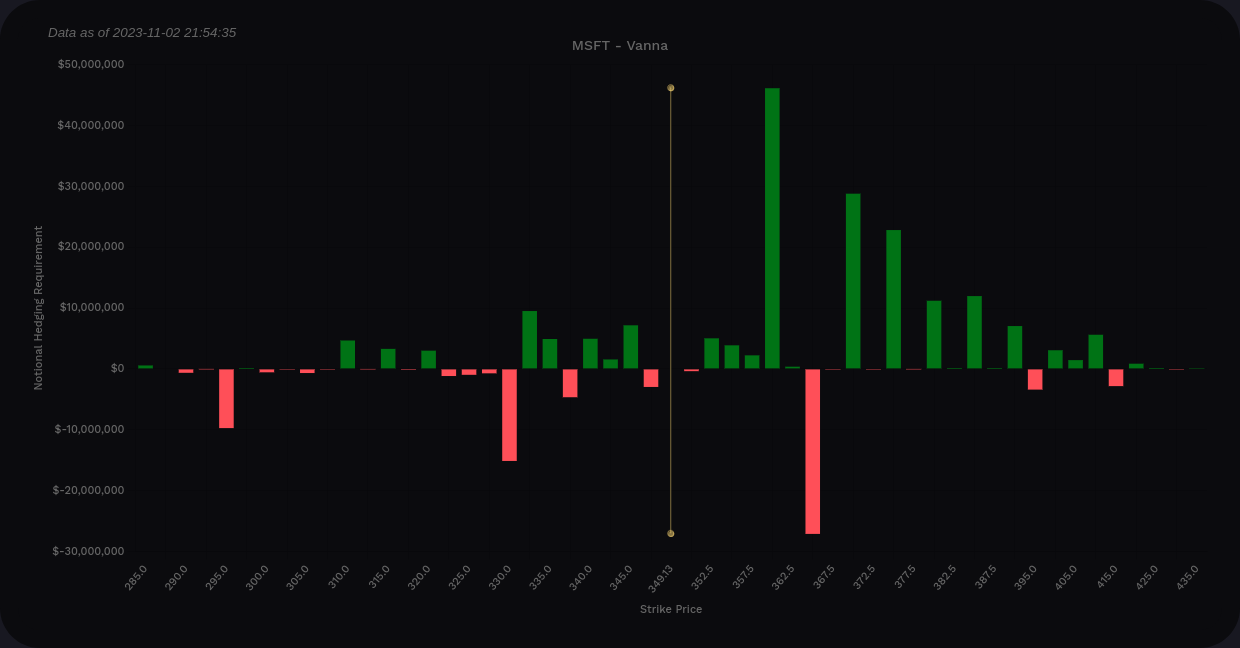
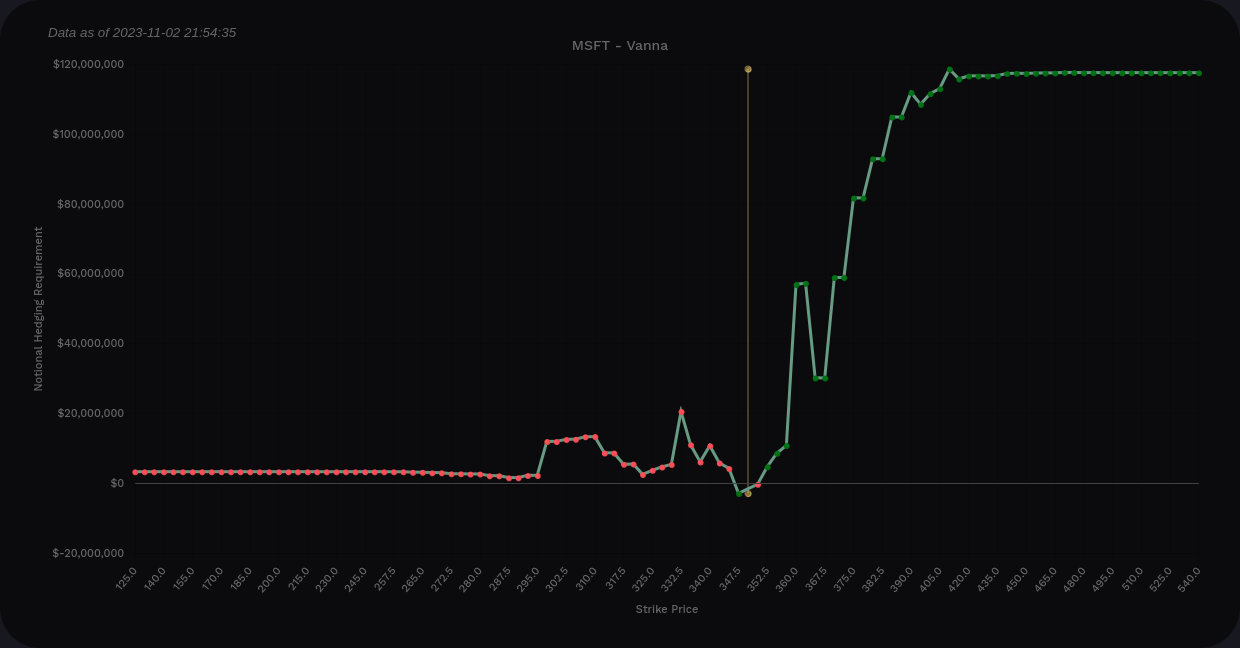
MSFT vanna chart from Volland for now through 12/22 only
Gamma
Volland's delta-adjusted gamma takes the gamma bars above the current price and flips them to make it easier to determine what dealers will likely do. Green bars here indicate areas where price is likely to be repelled and red bars indicate areas where price might be pulled to or accelerated.
I've pulled both the aggregate chart and the chart with data through 12/22 here.
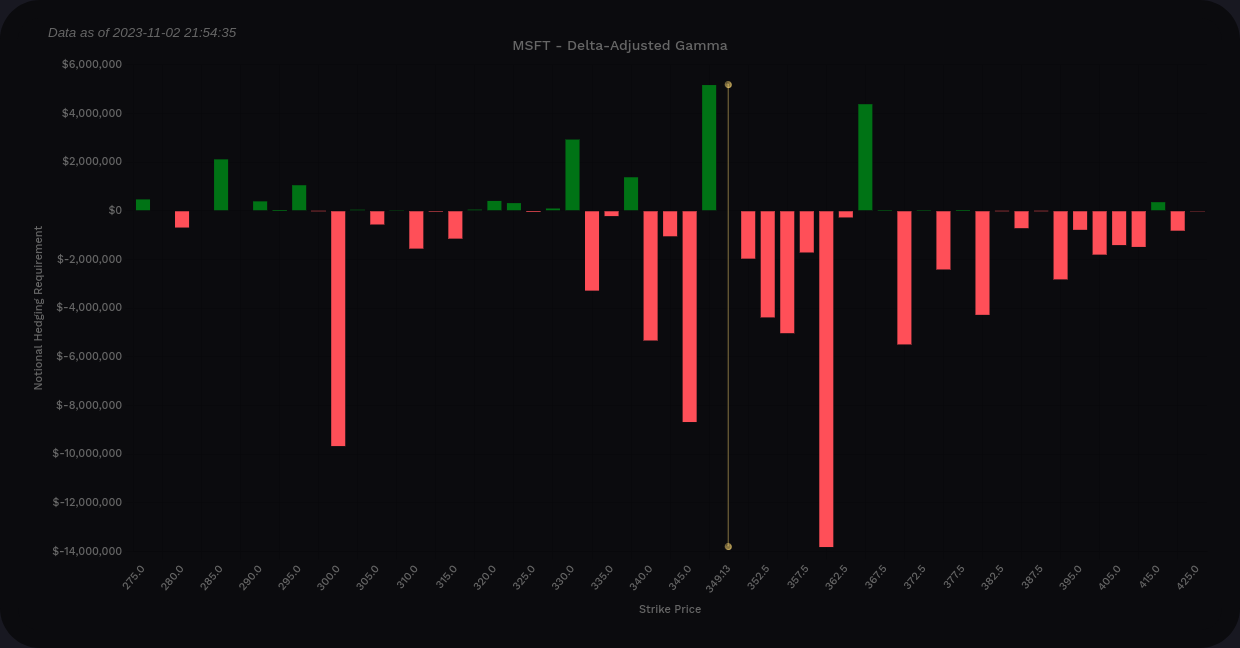
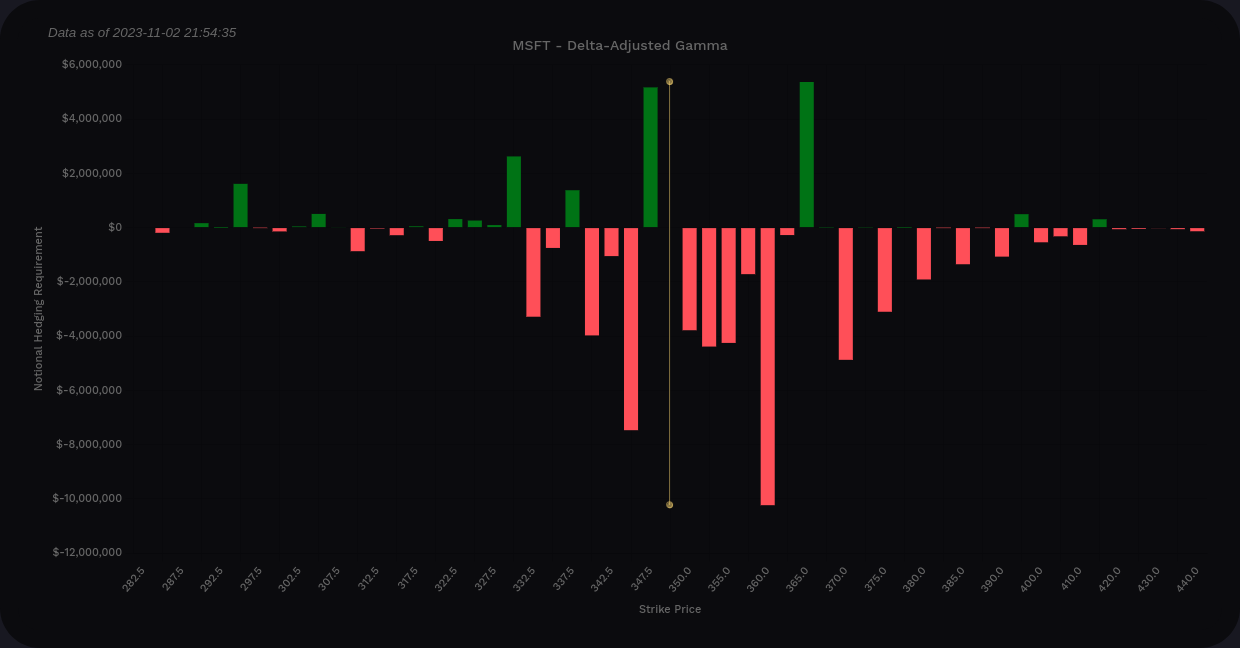
MSFT DAG from Volland. First/left chart is aggregate, second/right chart is through 12/22 only.
$347.50 and $360 look like the two zones where price might bounce. Again, the bets on $300 show up on the aggregate chart, but they're missing from the chart ending 12/22.
Unusual Volume
I'm still doing a trial of VolumeLeaders just to see how it works. It highlights areas of larger than average volume that could be attributed to institutional traders. Note that the charts do not specify the directionality of the trades. You must look at the volume yourself and make a judgement call on whether these traders are going long on short.
Armed with our knowledge of $360 likely being our top for a while based on vanna, let's take a look at a few of these charts. First up, the past week:
Remember: we don't know the directionality. However, since we know $360 is likely a top based on vanna and gamma, we see huge trades of millions of shares as we climb up to the $350 level. If you worked for an institution and knew that $360 would likely be the end of the road for MSFT for a short-term time frame, what would you be doing here?
If it were me, I'd be taking profits and maybe going short.
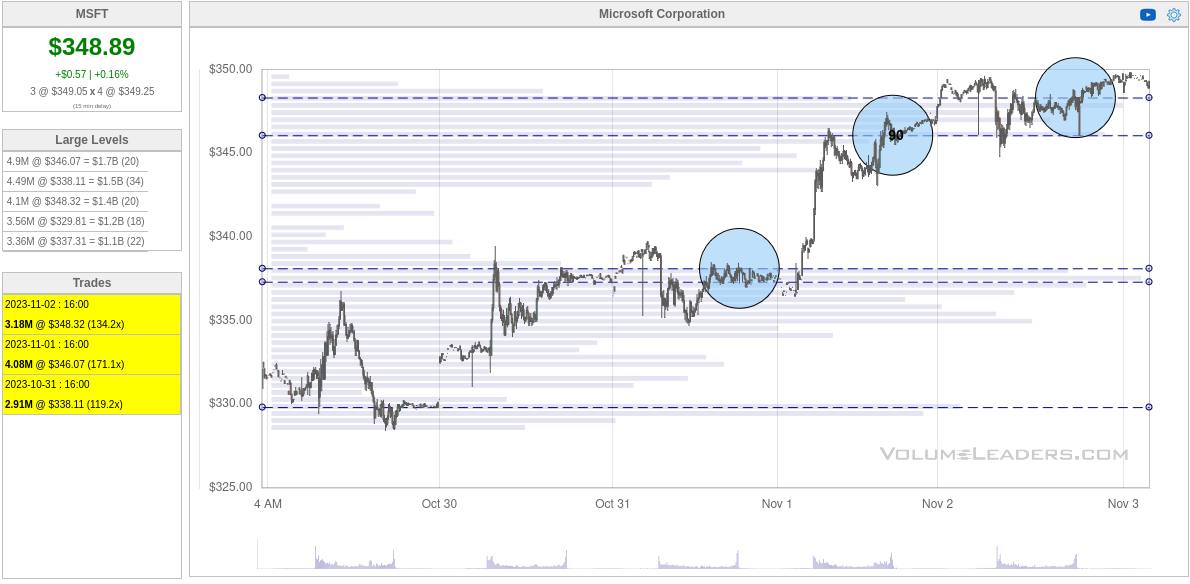
Let's go out to 90 days and look at the top 5 trades:

The numbers inside the circles indicate the rank of those trades. The most recent one is the 82nd out of 100 in size. If we look on the left side, we see the #61 trade on 9/29 for 4.97M shares. MSFT rallied up over $340 and then what happened? Trade #82 on 10/25 was for 4.26M shares. This could be an institution that went long and then took profits.
We don't know for sure, but this reinforces my idea that $360 is a line that can't be crossed yet.
Chart
MSFT's 4 hour chart is firmly buried in the premium zone at the top right. This is an ICT concept that is automatically applied via LuxAlgo's Price Actions Concepts indicator. When price goes into the premium zone, that means it's priced at a premium and the chances for a retrace down are very high. Our most recent two candles (yesterday's price action since this is a 4h chart) have very short bodies and that indicates a battle between traders at this level.
Wednesday's price action had some bearish cues in it. The morning saw a bearish liquidity grab up to the recent higher high that was quickly knocked back down. The afternoon candle went into the premium zone and came back down. LuxAlgo's Signals & Overlays indicator placed a blue X on the last candle as an indication that exiting a long was recommended.
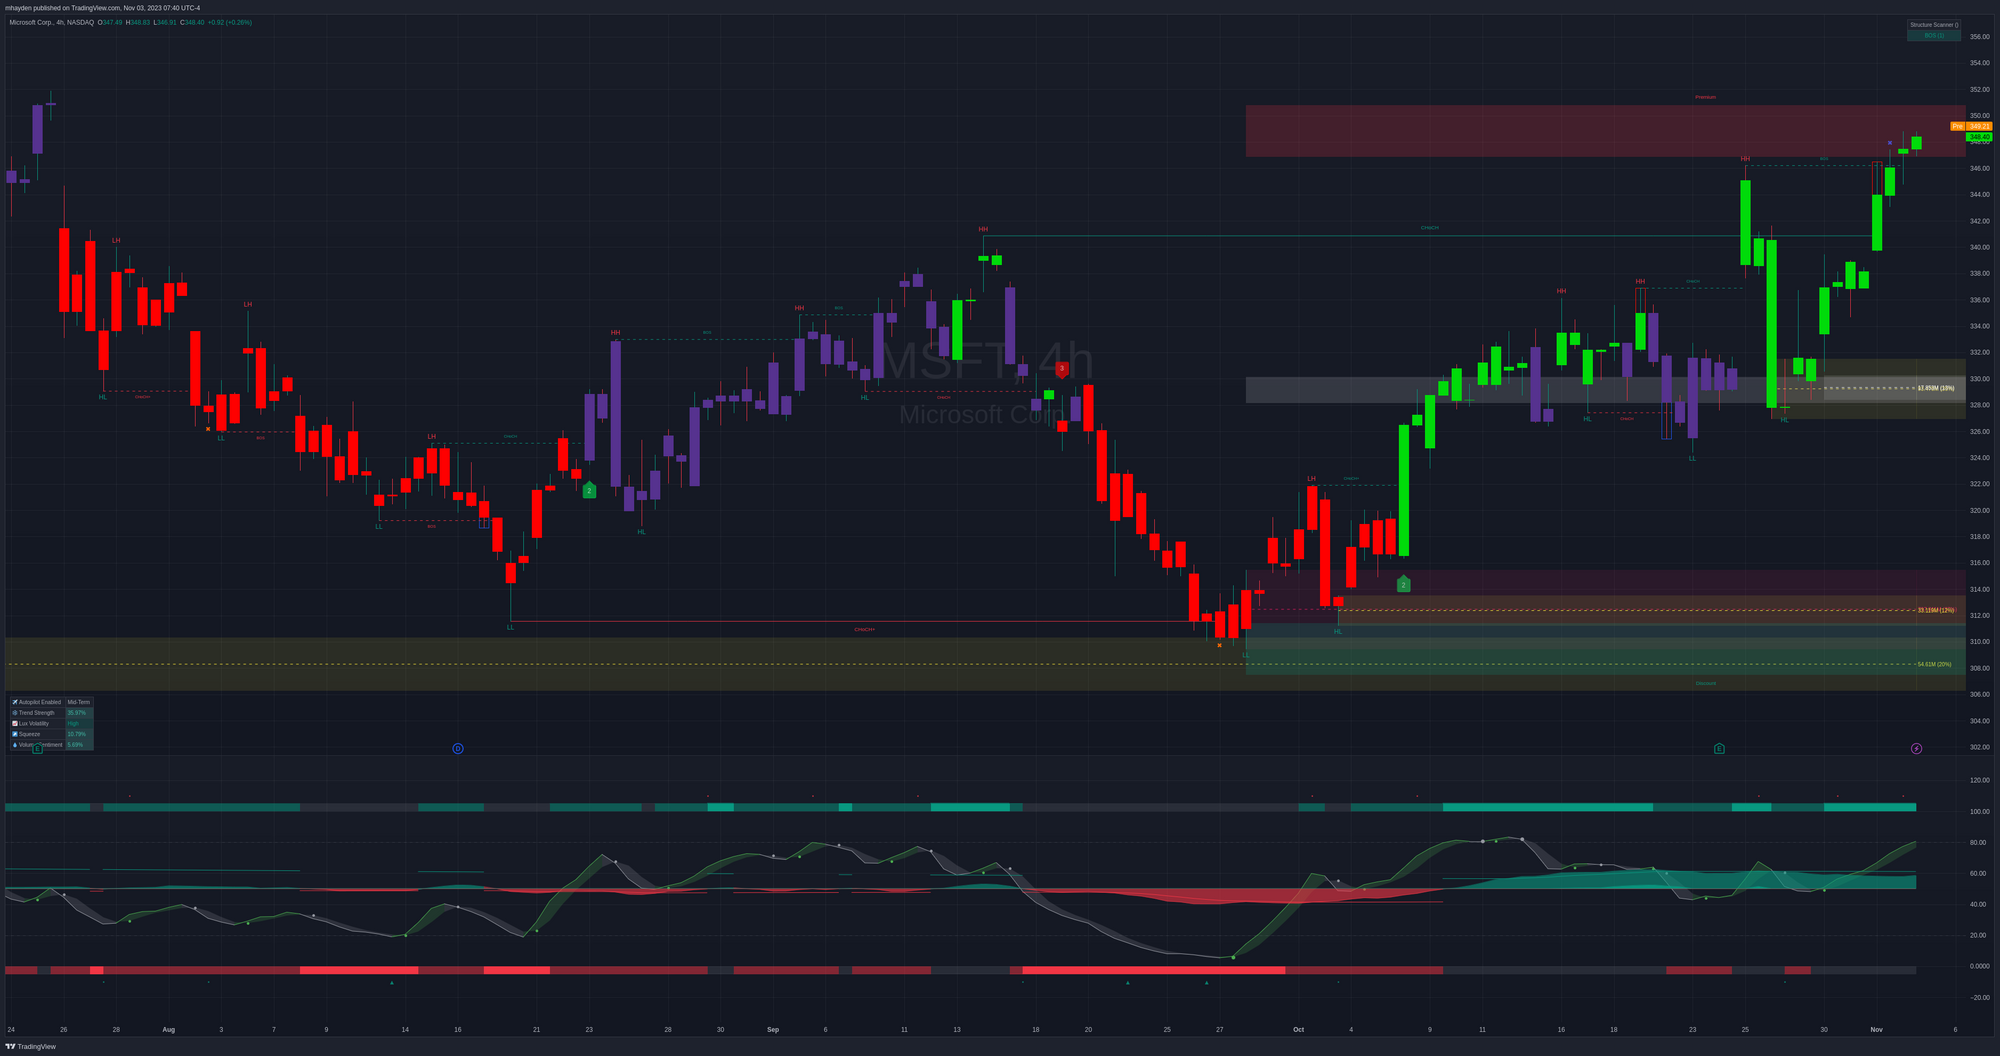
The oscillator at the bottom shows the wave and money flow as still being positive. However, the money flow has retreated from the threshold line. Also, the three red dots above the solid green line indicate that some parts of the oscillator are seeing bearish hints in the price action recently. We haven't seen any red triangles yet signifying a stronger confirmation, but when you get more than 2-3 of these small dots together, it hints a move down.
Thesis
Let's make a list of what we know:
- Vanna and gamma suggest $360 as a top end for the remainder of the year as well as on the aggregate time frame.
- $300 seems to be a big level, but not in 2023. Perhaps it will be something to watch next year.
- Institutional traders hammered MSFT with trades yesterday afternoon at its highs, including the 90th biggest trade out of the last 100.
- The current price hasn't been seen since July 25 and we're in the premium zone right now with some recently weak candles.
Could we go higher? Sure, anything is possible. However, there's a stack of evidence here that we're either going to consolidate or retrace a bit. That retrace looks like it could land around $300 in the longer term, but the shorter term suggests something around $330-$340 and we have a recent order block there on multiple time frames. That's also very close to the equilibrium zone for price.
As for my trades, I have two on right now for MSFT:
- Short strangle $305/$365 for 12/15 (delta neutral with a goal of trading the boundaries for price)
- Short call spread $360/$365 for 12/15 (short delta since I think $360 is going to be a top)
I'm still trying to do a better job picking boundaries for directional trades, hence the spread. That allows me to try a strategy while also knowing that my risk to the upside is defined. I sold the spread for $1.40, so my maximum loss is $360 ($500 wide spread minus $1.40 credit received).
Good luck to everyone today and I hope your weekend is awesome! 🍀
I'll be back for Charts & Coffee this weekend. ☕
Discussion