Another look at MSFT on December 6th

MSFT looks fantastic for the year but as we pull back from all time highs, what's next for this mega cap? Let's build an edge through data. 👷

It's been a while since I had a good look at MSFT and I figured today was a good time to dig into the data. It's been on an absolute tear lately and up 55% for the year so far:
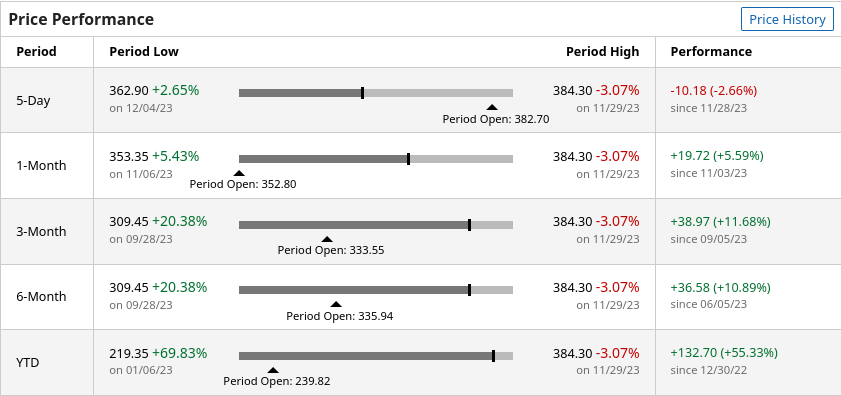
But where does it go from here?
All investments come with significant risks, including the loss of all capital. Please do your own research before investing, and never risk more than you are willing to lose. I hold no certifications or registrations with any financial entity.
Let's find out with some data. 🔎
Vanna
As usual, my first stop is the vanna chart.
The vanna curve here looks almost perfect for a bullish move in an environment where IV is coming down. We have positive vanna above price, some positive vanna below price, and very little negative vanna.
The biggest positive vanna level sits at $395, but there's a wide range of big bars running from $375-$420. That gives plenty of price targets for MSFT above the current price. We pick up some negative vanna around $360, so let's keep that in mind for later to see if other data correlates with that level.
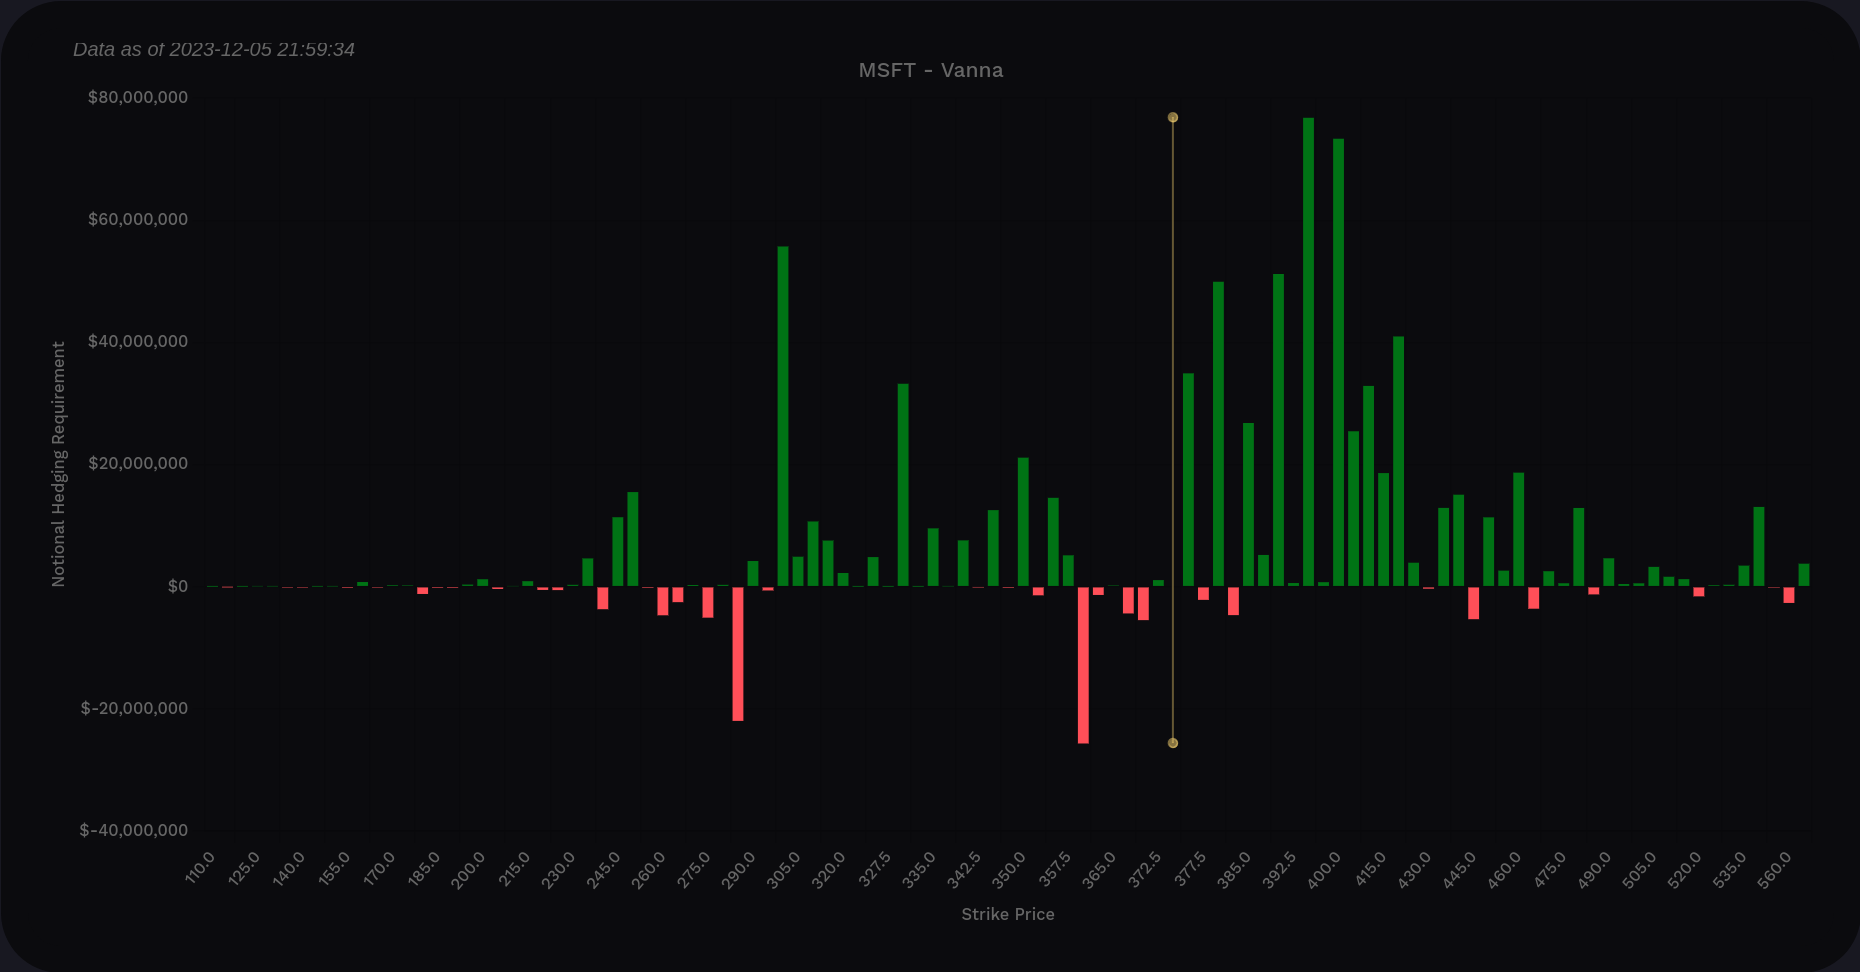
MSFT vanna chart across all expiration dates
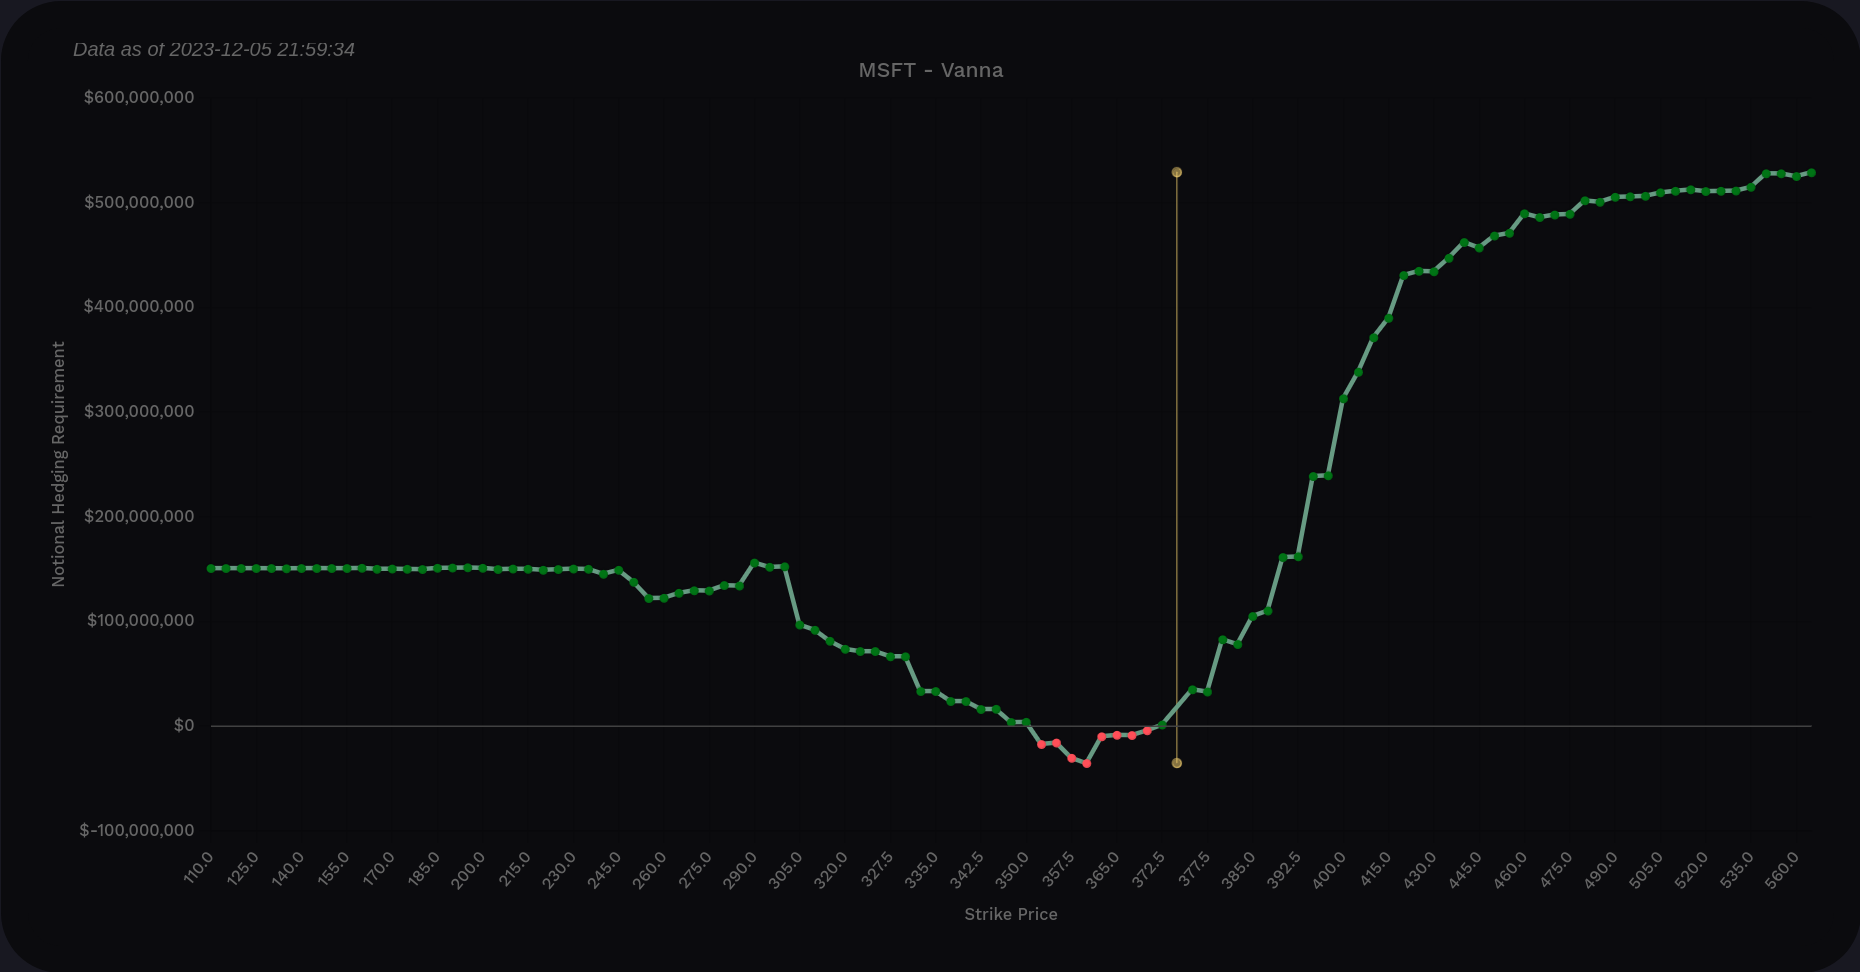
Scanning downward, $300 is a huge positive vanna level below the current price and would likely be support if we somehow made it down there. That would be one heck of a drop, though.
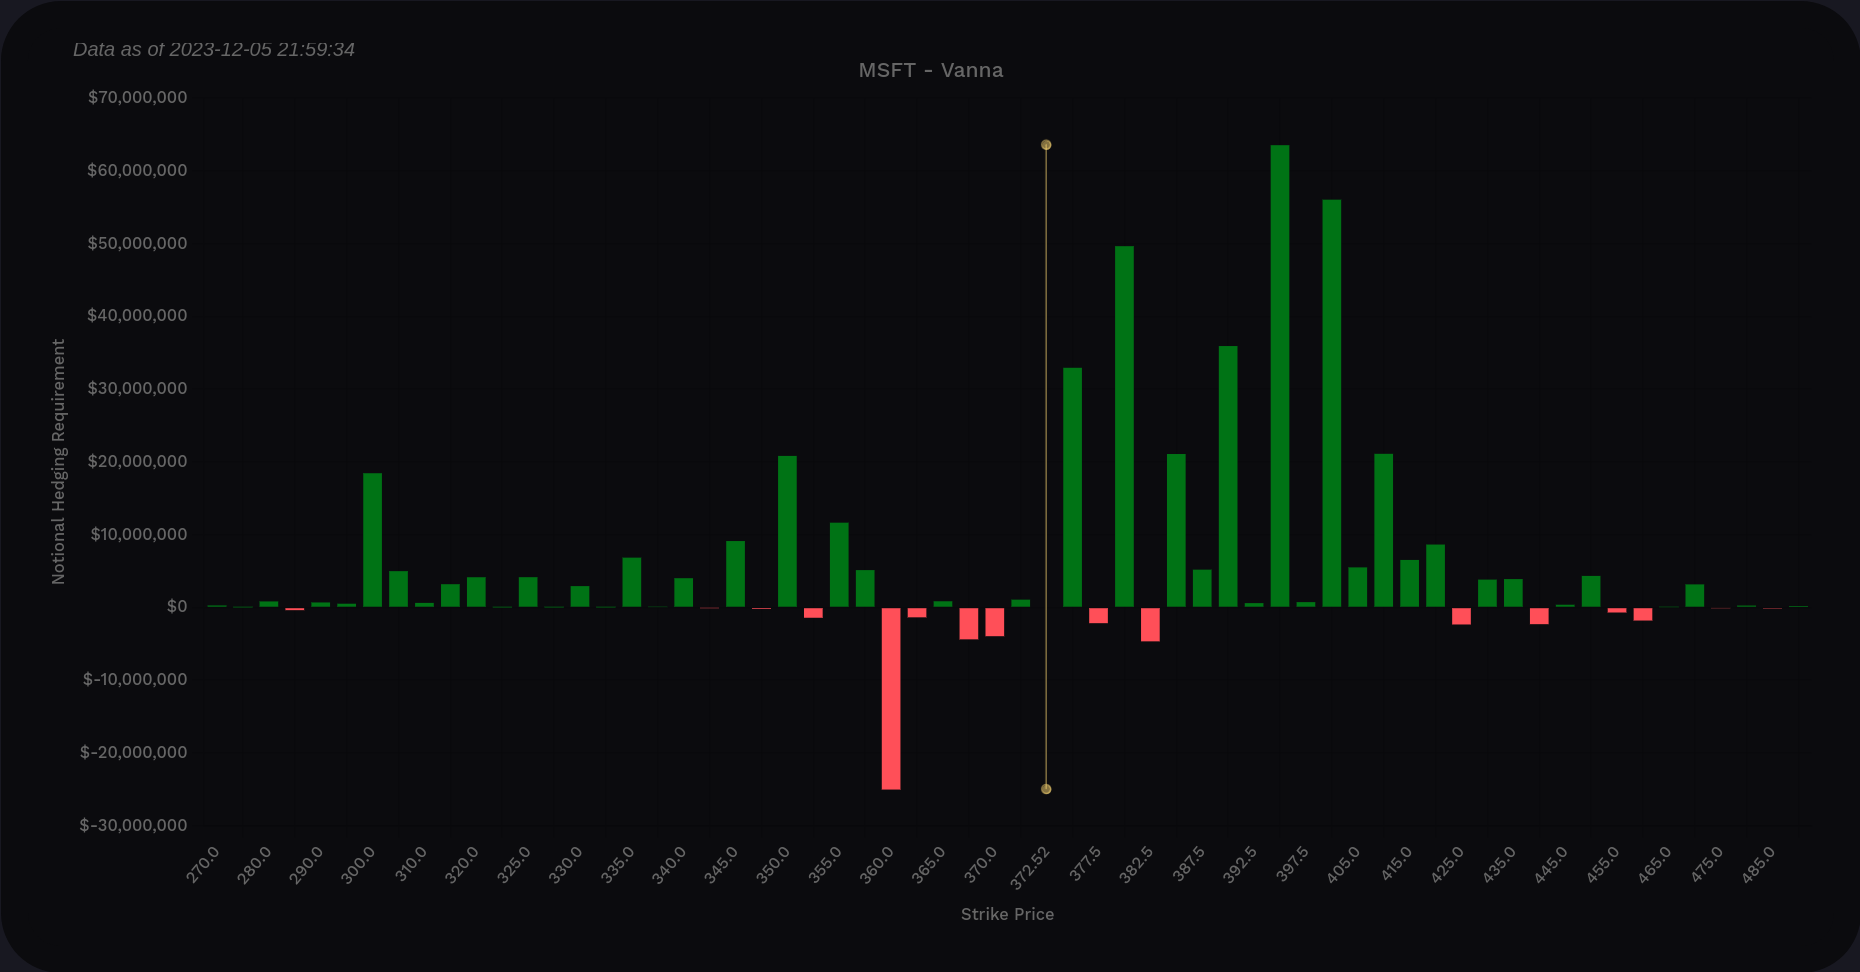
I'm interested in options expiring on or before 1/19 right now, so how does that data look?
Short answer: very much the same. $375-$410 shows up as a good magnet for price and the only negative level shows up again at $360. That $300 level is much smaller here.
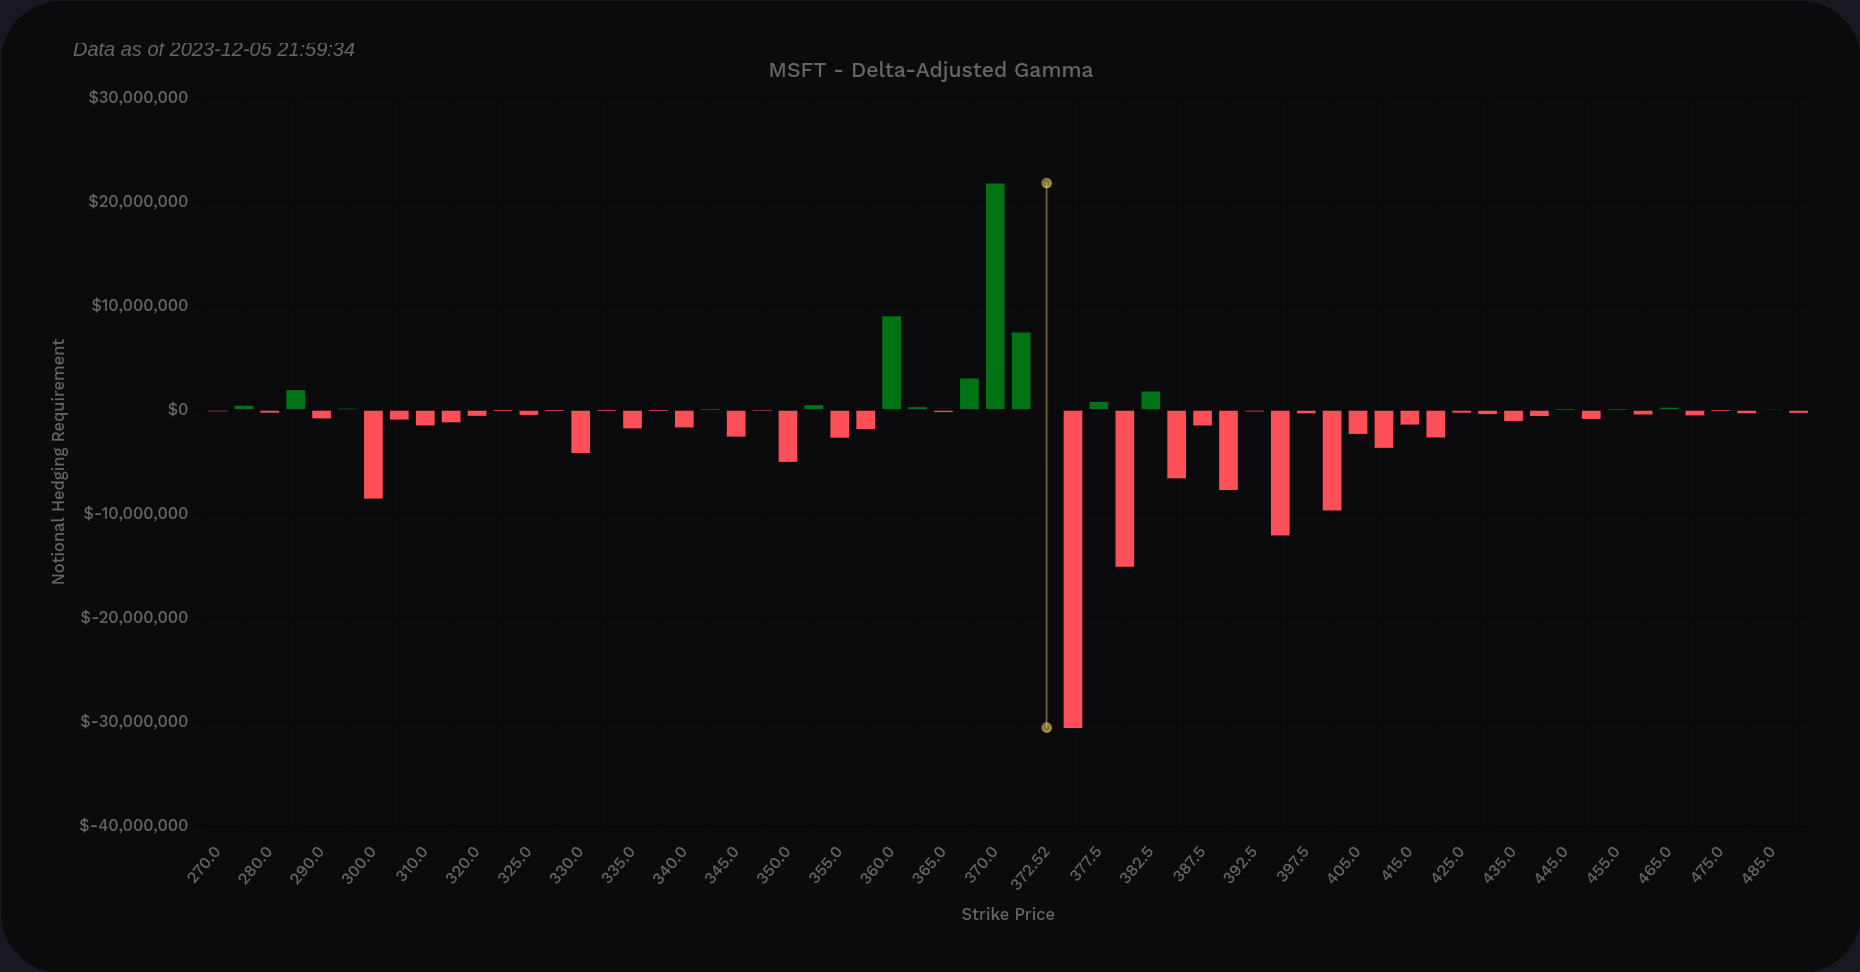
Gamma
Volland's delta-adjusted gamma (DAG) suggests that dealers will apply selling pressure heaviest at $375 but that pressure lightens up as price passes $380. We get some dealer buying pressure around $360.
Institutional trades
Volume Leaders provides charts that help us find where institutions are actively trading shares in various ETFs and equities. The biggest institutional trading level based on dollars spent sits around $244 and we haven't seen that level since early 2023.
It's clear that there is a ton of interest in MSFT around the $320-$340 range. We have some massive trades in there, including several in the top 10 trades of all time. The biggest trade ever for MSFT came in around $344 on July 21st. We just saw #6 within the past week.
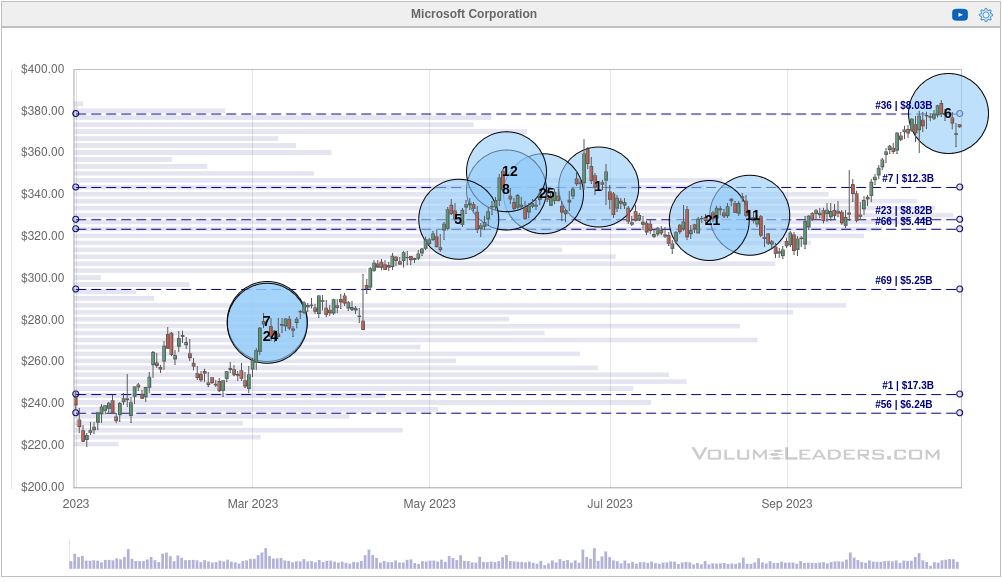
This tool doesn't tell us the direction of the trade, but the magnitude of these trades says a lot by itself. I see many situations where institutions begin "nibbling" on a stock and make large trades that aren't huge. Then, when they feel confident, they send through a massive trade to seal the deal.
That #6 trade looks like the price traded right through it, and that's quite a large trade to be sitting by itself up there. It looks like MSFT is primed for a pullback, possibly to that $320-$350 range where institutions were trading it previously.
Chart
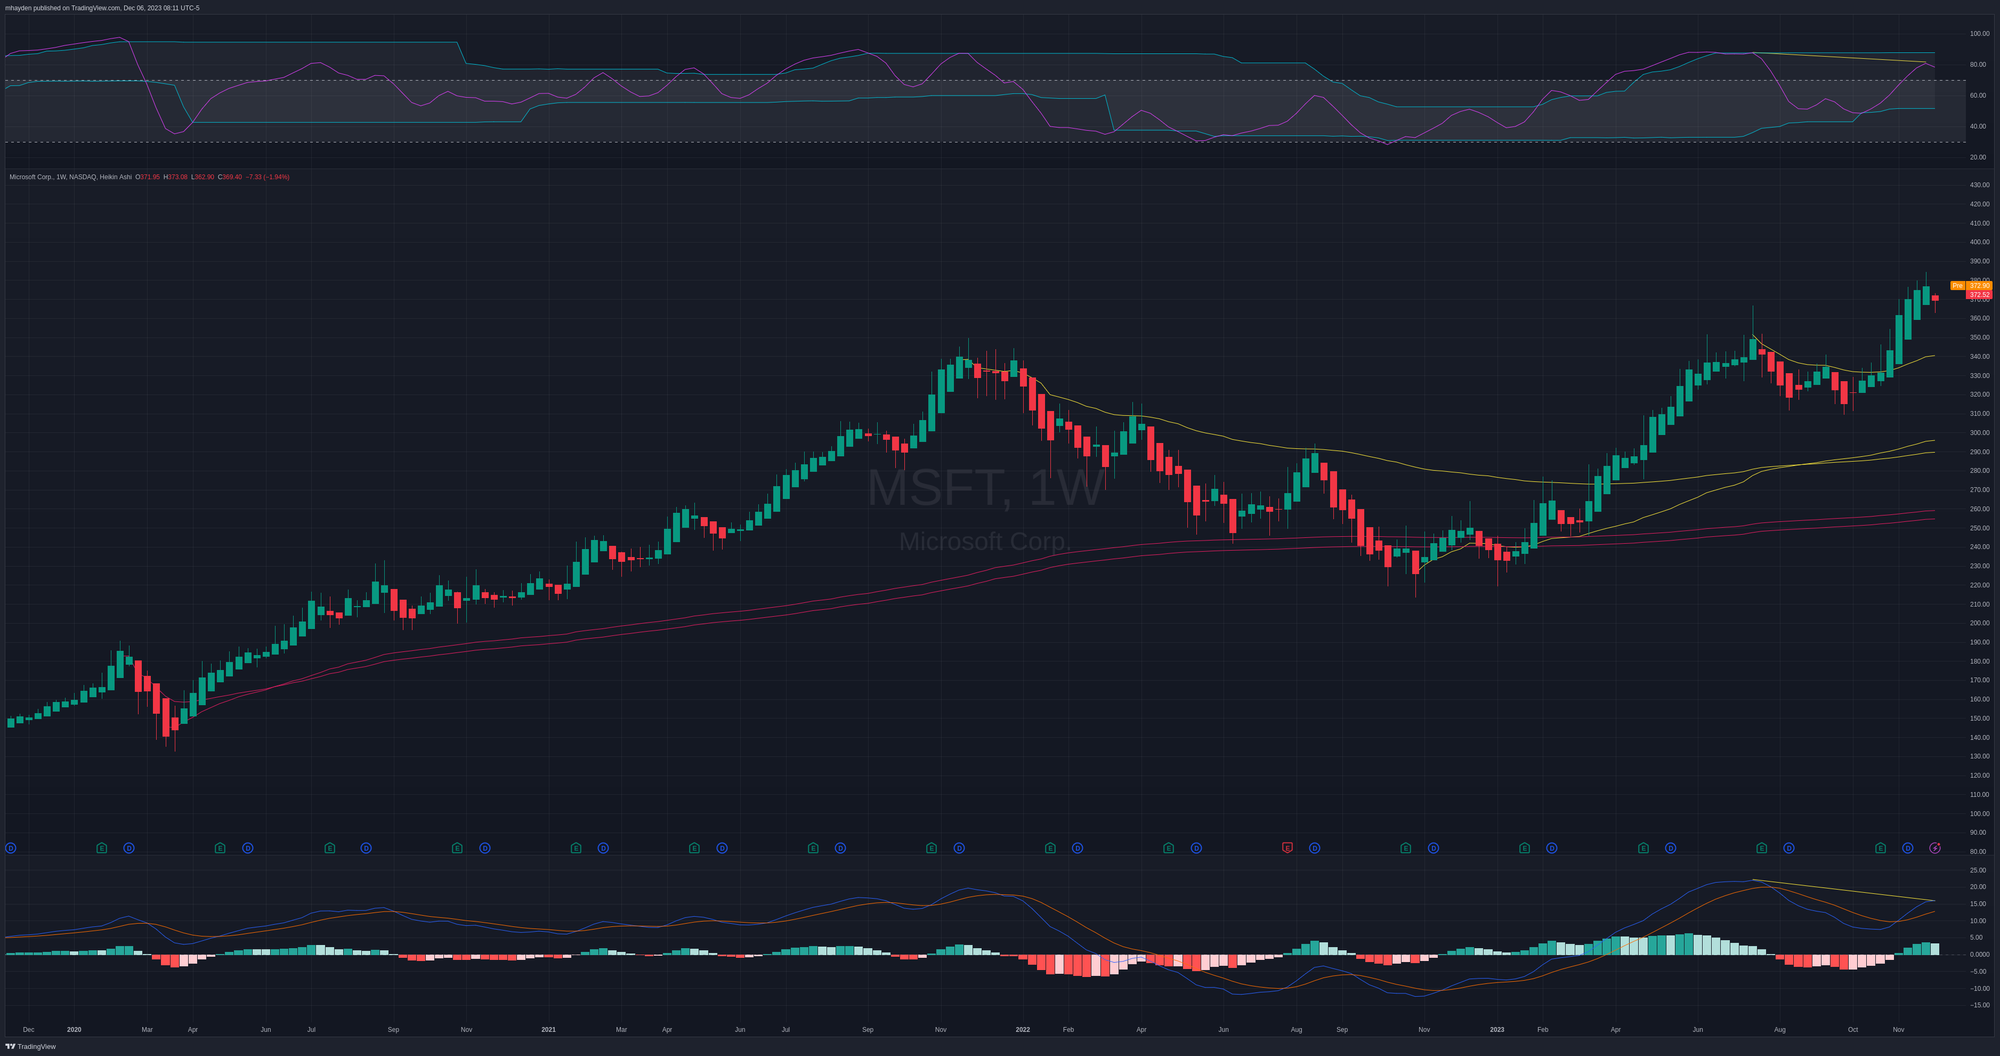
MSFT sits well over all of the VWAPs I could draw from highs and lows going back to the COVID drop. $340 is our nearest VWAP support level and then comes the $290-$300 range. COVID VWAPs are far away in the $250-$260 range.
The weekly RSI didn't make it to the top of the channel and it's headed back down. There's a bearish divergence there as the RSI failed to make a higher high as the stock price made a higher high.
The MACD is well over zero but the strength seems to be dwindling. If the MACD makes a lower high, this is a bearish divergence as well.
Thesis
Multiple signs point to MSFT taking a breather here. We have a #6 institutional trade at the tops, a bearish divergence on the RSI, and possibly a bearish divergence forming on the MACD. Vanna suggests we have the potential to head higher if IV remains steady or drops.
If we do come down, $340 looks like a potential first stop based on the chart. Institutional trades suggest something in the $320-$350 area. If we lose those levels and drop below $320, then $290-$300 is our next level of support.
We're already near all time highs, so it's difficult to tell where MSFT might go if it moves up. Vanna effects dwindle before $420, so that seems like a hard cap for now. Through 1/19, the likely top is around $400 based on vanna.
Although I don't have any trades on the board now, I managed to escape my MSFT short strangle with a profit. Although I took a loss on the final trade, my defensive put rolling trades gave me enough profit to mark the overall trade down as a winner. That one wasn't fun to manage, however. 🥵
I'd be really interested in selling a put in the $340 area or perhaps just below that level. That requires a little bit of "wait and see" for now, though.
Good luck to everyone today! 🍀
Discussion