NVDA pre-earnings stock and options analysis

NVDA is roaring into earnings on 11/21, but what happens after that? Betting on the top looks a bit scary, but support levels could be challenging to pick as well. 🚀

Happy Thursday! ☕ I'll take a look at NVDA today and see where it might be going before and after its earnings call on 11/21. Bear in mind that NVDA is an incredibly wild stock to track and earnings add even more difficulty to predicting NVDA's directions. Long story short: use caution when trading this one around its earnings. ☠️
All investments come with significant risks, including the loss of all capital. Please do your own research before investing, and never risk more than you are willing to lose. I hold no certifications or registrations with any financial entity.
Without further ado, let's check out some data!
Vanna
There's plenty of disagreement about NVDA's valuation and that means options are heavily traded and quite liquid. This also means there should be a decent amount of vanna for us to examine.
I'll start with the vanna across all expiration dates. Starting with the curve chart, we have positive vanna on both sides of price and it's difficult to find any negative vanna there. Positive vanna is steep above price. Put all of this together and I'm thinking NVDA gets a decent amount of bullish price pressure from decreasing IV (which normally happens after earnings).
Where might NVDA go? Well, the tallest bar by far is at $550 and NVDA is trading at $465 at yesterday's close. $500 and $530 are also strong levels ahead of $550. I'm just blown away by the levels beyond $550 on this chart. There are some serious outliers.
$600 shows up as a level that might repel price, but that's nearly $140 from where we are right now. NVDA would definitely need a breather there. 😜
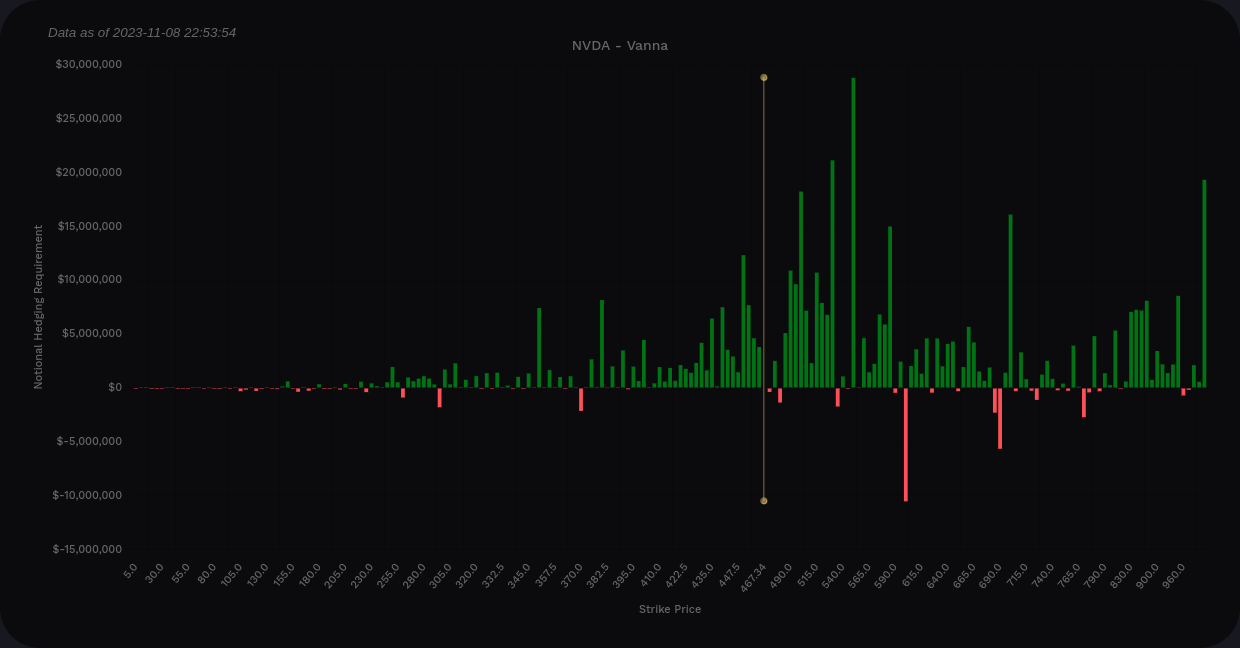
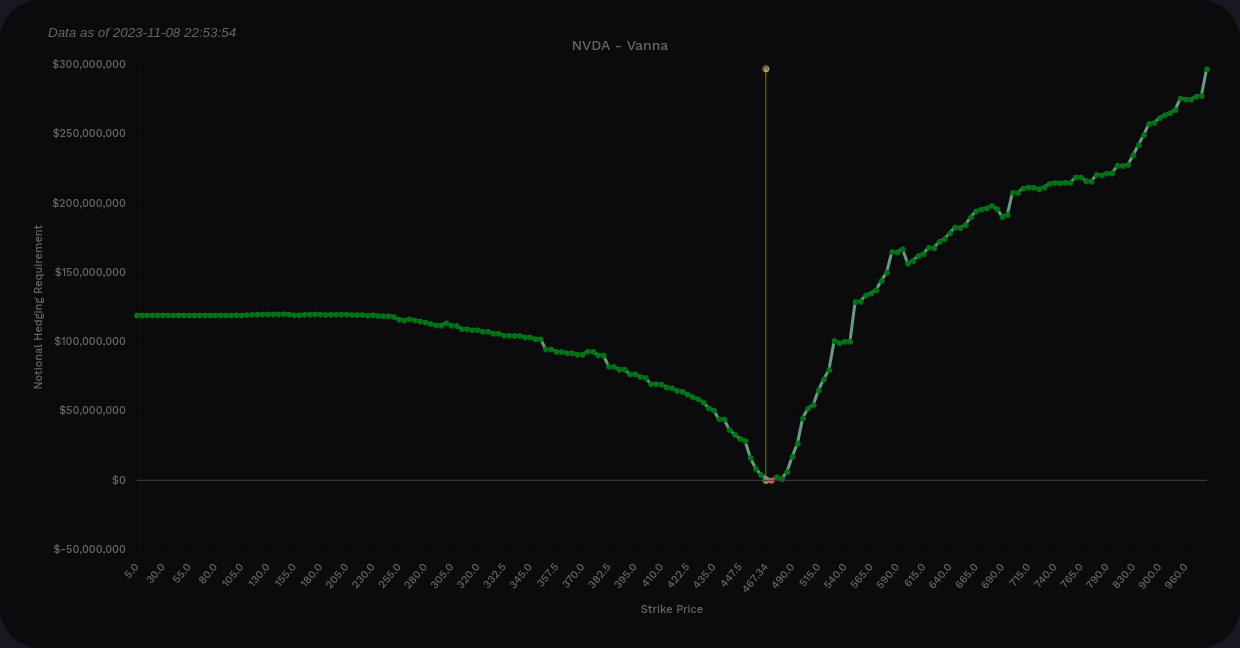
NVDA vanna from Volland (all expiration dates)
I'm trading 12/15 right now, so how does NVDA look going into that OPEX date?
Again, the curve is almost entirely positive with a very steep line above price. $500, $530, and $585 are strong levels on the chart ahead of price and we don't run into much negative vanna until after $600.
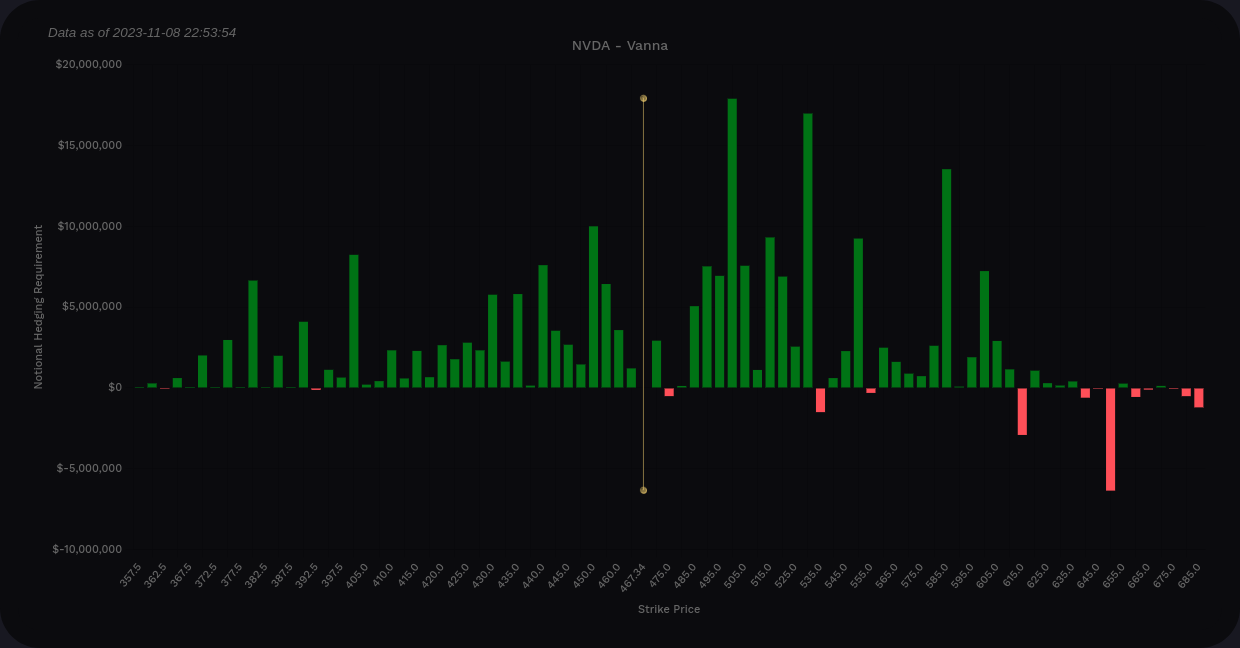
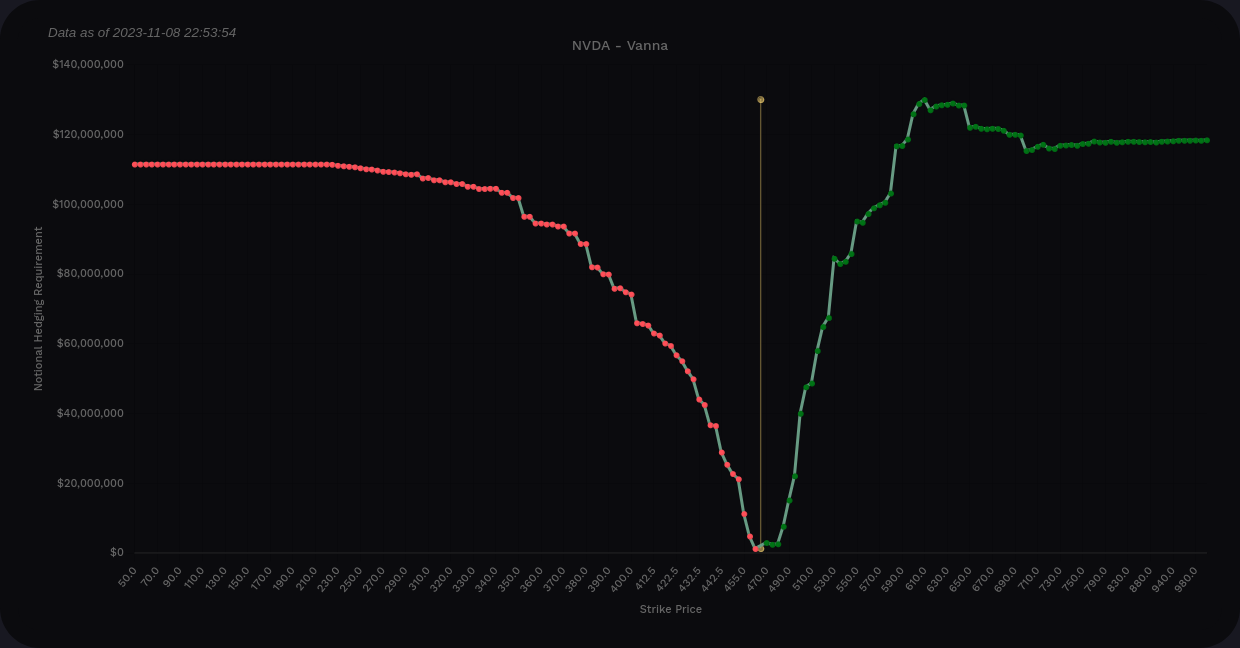
NVDA vanna from Volland (now through 12/15 only)
If we look at puts in isolation, we see heavy put selling below the current price with another big short put level around $585? That's an interesting strategy. 🤔

On the call side, there are a ton of long calls here with some light short calls just under the current price and out in the $600's.

So far, NVDA looks very bullish in an environment with decreasing IV.
Institutional Trading
NVDA has been a fan favorite among various funds over the years, but what are the big traders doing with NVDA lately? Let's get a look at the last 30 days:
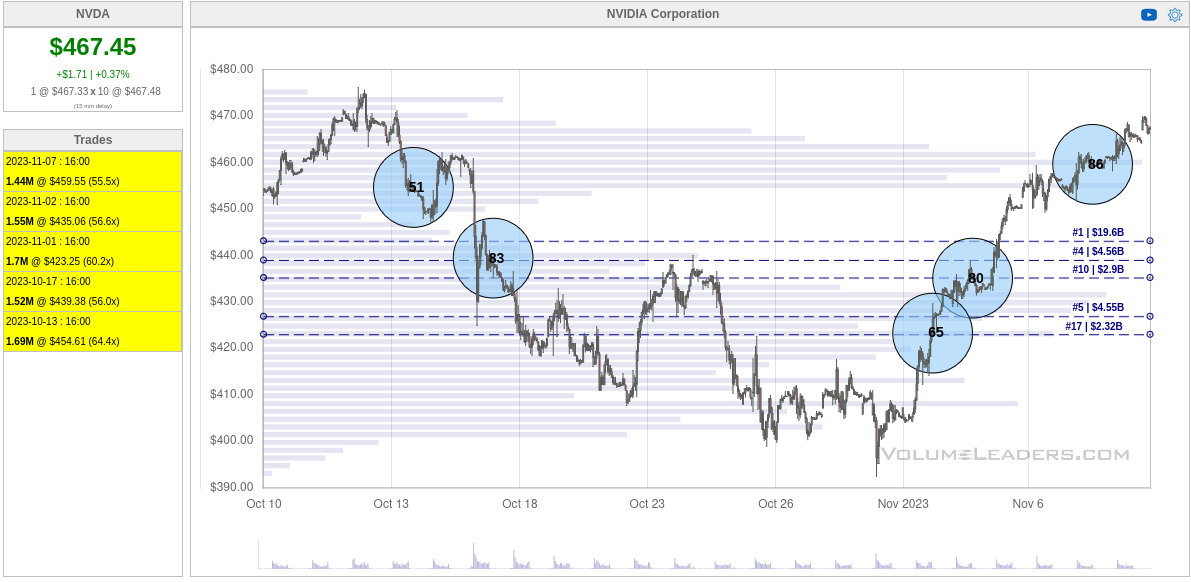
As a reminder, the numbers inside the bubbles indicate how that trade ranks among all trades since NVDA began trading. The rightmost bubble has an 86 in it, which means it ranks 86 out of the 100 biggest trades for NVDA.
We can't get directionality from this tool, but the two left bubbles look like profit taking or short entries perhaps. However, the ones on the right look more like long entries. The big question is whether that last one, #86, is a sell or a buy.
NVDA is above its #1 volume level around $445 right now and some might argue that it's overrunning its volume a bit. They might argue that the latest trade is a short. Others would say that we're in unique economic times and NVDA leads the AI race, so this is surely a buy at a support level as we move higher.
Let's see if we can narrow it down with more data.
Chart
NVDA's weekly chart is up near the all time highs and well above a daily gap from $320-$360 (doesn't appear on the weekly chart, of course). It has some support from a weekly order block around $420 and the all time high is just over $500 from August 21.
Our market structure has one bullish break of structure (BOS) that ran from November 2021 to May 2023 when the AI rally kicked off. NVDA shot up like a rocket and that BOS is still in effect. That's a bullish market structure, even if we got it on a wild, wild week back in May.
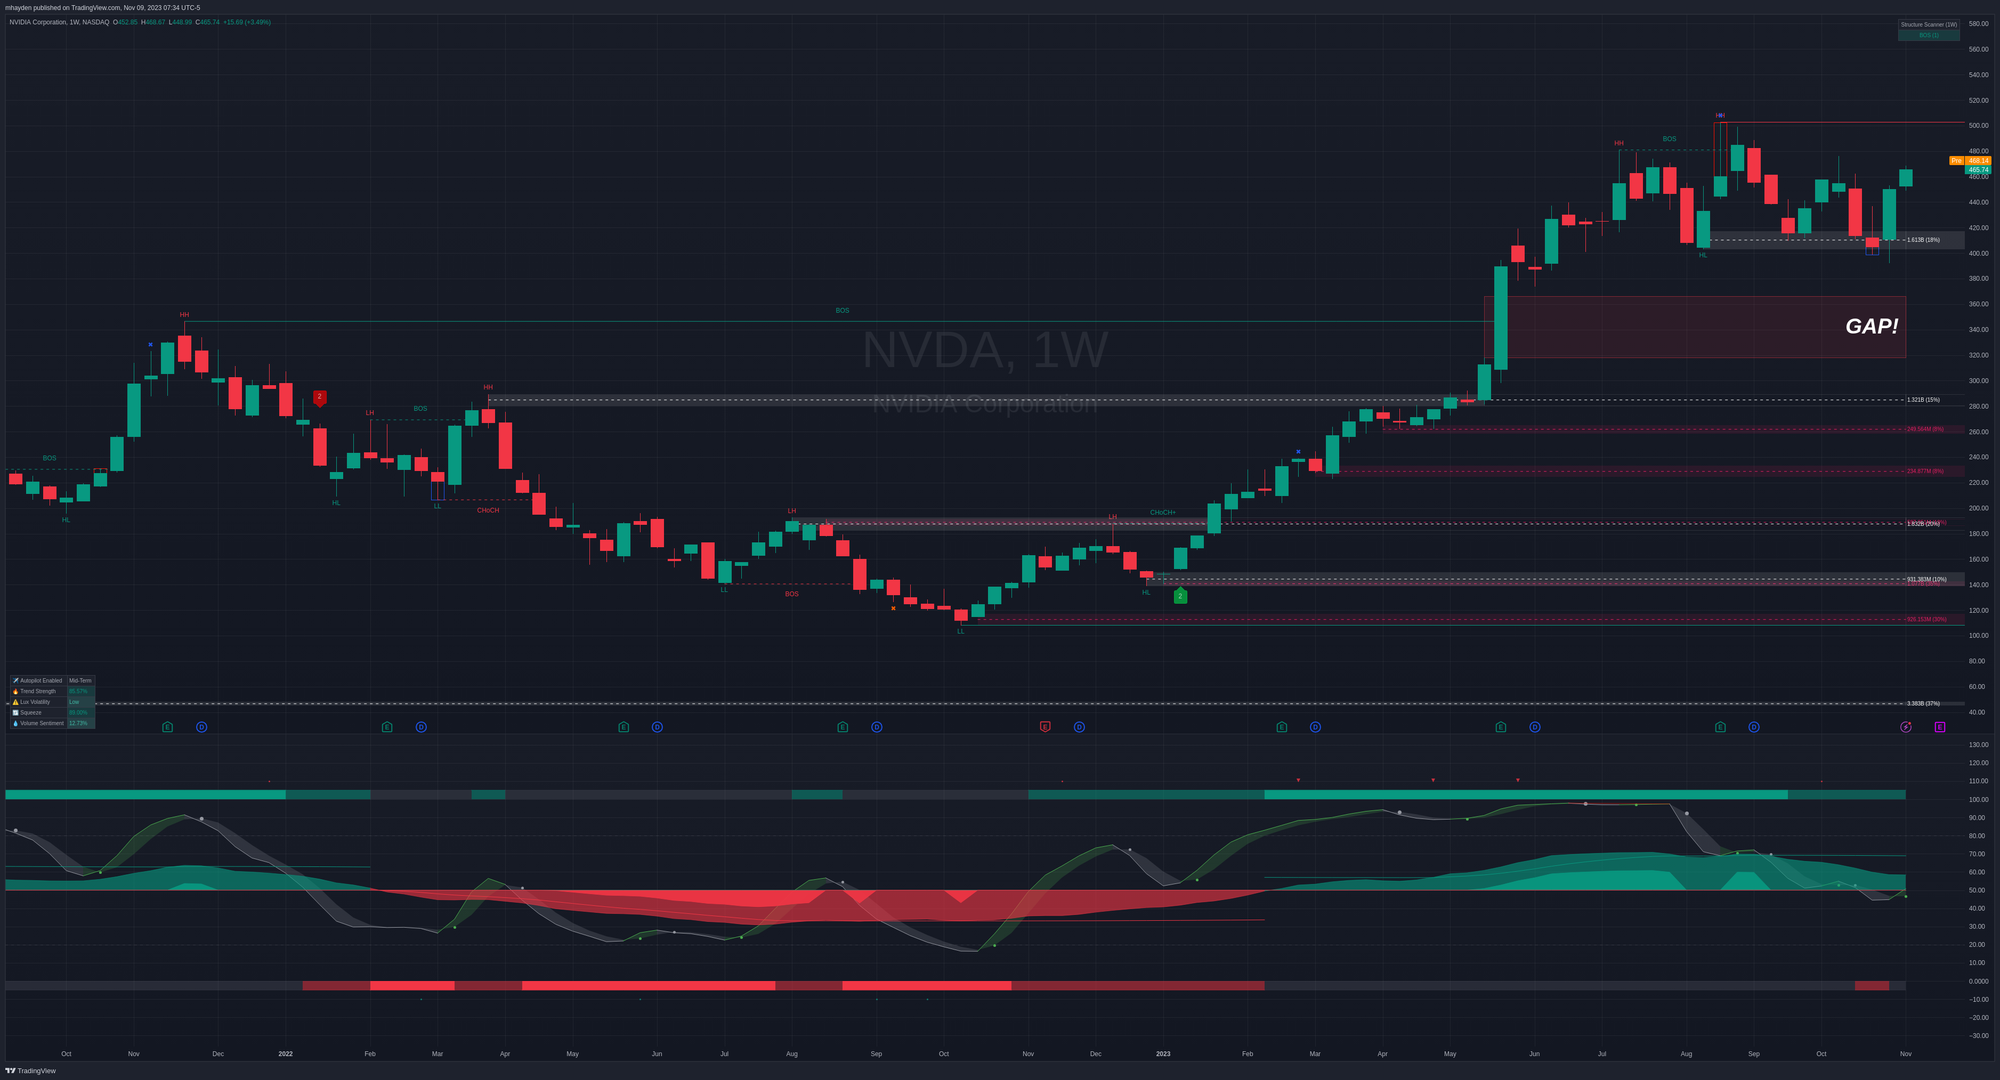
At the bottom of the chart, we can see that NVDA's money flow has been bullish since February 2023 and has been strong since then. It's pulled back a bit lately, especially after the hyperwave slammed into the top of the range and held there for two months. That's incredible. 🤯 It shows a lot of strength here.
Lately, NVDA has caught a breather, and although the money flow is still positive, the hyperwave has drifted below the zero line. It's turning back up now just in time for earnings.
Thesis
NVDA has a ton of bets that it will go higher and that's clear from the vanna charts. Institutions are also making plenty of trades as we head into earnings and that adds fuel to price movement in one direction or another. Recent moves make picking a top here really dicey.
If I had to look for support levels, $420 is the nearest one (from a weekly order block) followed by the top of the May gap around $366. If NVDA falls through $366, that could get ugly fast. However, there aren't many traders betting on that scenario at the moment in the options market.
$502.66 is the all time high and we're a little over $40 from that now. That would require about a 10% move. However, options pricing for the 12/15 OPEX is pricing in a potential move of $65 in either direction. Wow.
NVDA looks like it's best set up for a directional trade right now rather than something neutral, but it's a risky trade. If I could have a do-over (more on that in the next paragraph), I might have gone with a defined risk trade or a butterfly of some sort.
I made a bet on NVDA's top with a 400/505 short strangle for 12/15 and that top end bet is making me sweat right now. I fear that I'll have to defend this one pretty aggressively if NVDA gives the market some great earnings results. 🥵
Good luck to everyone today. 🍀
Discussion