OPEX week kickoff

So many announcements and earnings are headed our way this week. AMD and TSLA are at critical resistance levels. Here's my trading plan. 📝

I did a deep dive into charts yesterday but now it's time to dig into options flow and dealer positioning as we head into the 7/21 OPEX.
We have VIX expiration on Wednesday along with TSLA earnings. There's also the beginning of earnings season with some highly anticipated financial earnings coming up. Here's a run-down for the next two weeks courtesy of Theta Gang:

In addition, we have GDP growth rate, retail sales, unemployment rate, and other announcements this week. It's going to be wild. At least the Federal Reserve meetings aren't until next week. 🥵
All investments come with significant risks, including the loss of all capital. Please do your own research before investing, and never risk more than you are willing to lose. I hold no certifications or registrations with any financial entity.
Let's get a look at the broad market and take a look at two of my favorites: TSLA and AMD.
Overall market
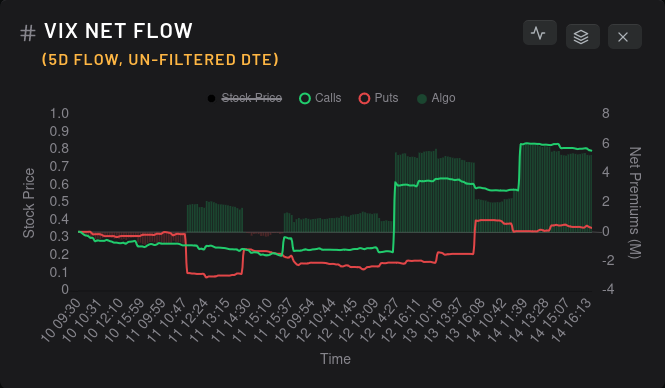
Bullish options flow for the overall market continued last week but bullish for for VIX also appeared:
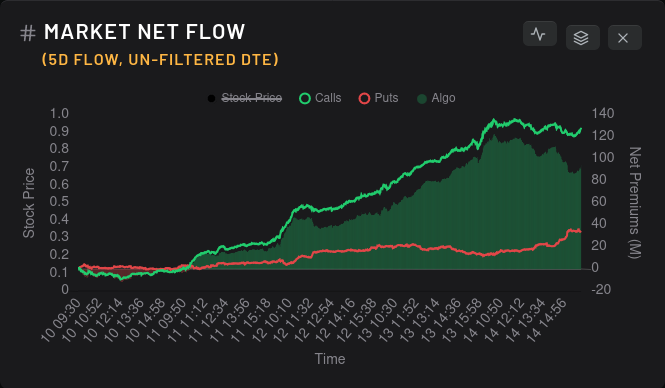
We saw some good upwards movement across the broad market last week which suggests there's stronger pressure for upwards price movement. SPX is sitting at 69.73% RSI and that's very close to the overbought range. SPXEW (SPX if each stock was equally weighted) was outpacing SPX for a couple of weeks but it slid down to 65.84% by Friday afternoon.
Some might say that a reduction in SPXEW's RSI number is a sign that it's cooling it a bit to leave room for another bullish run. Others might contend that it's losing strength and that the largest market players are taking control again. That remains to be seen, but Friday's bullish options flow leveled off a bit with puts on a steady increase.
SPX vanna is quite weak relative to its normal levels, and there's a ton of positive vanna underneath the current price. As a trader with a bullish bias, I don't like to see that.
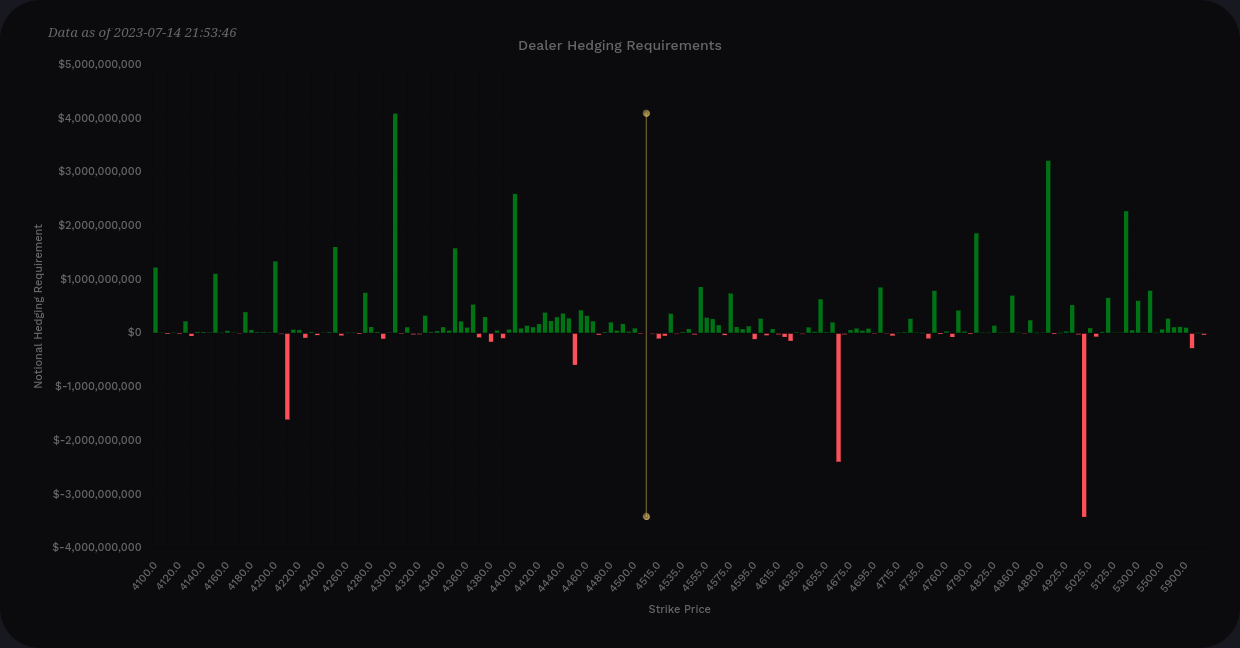
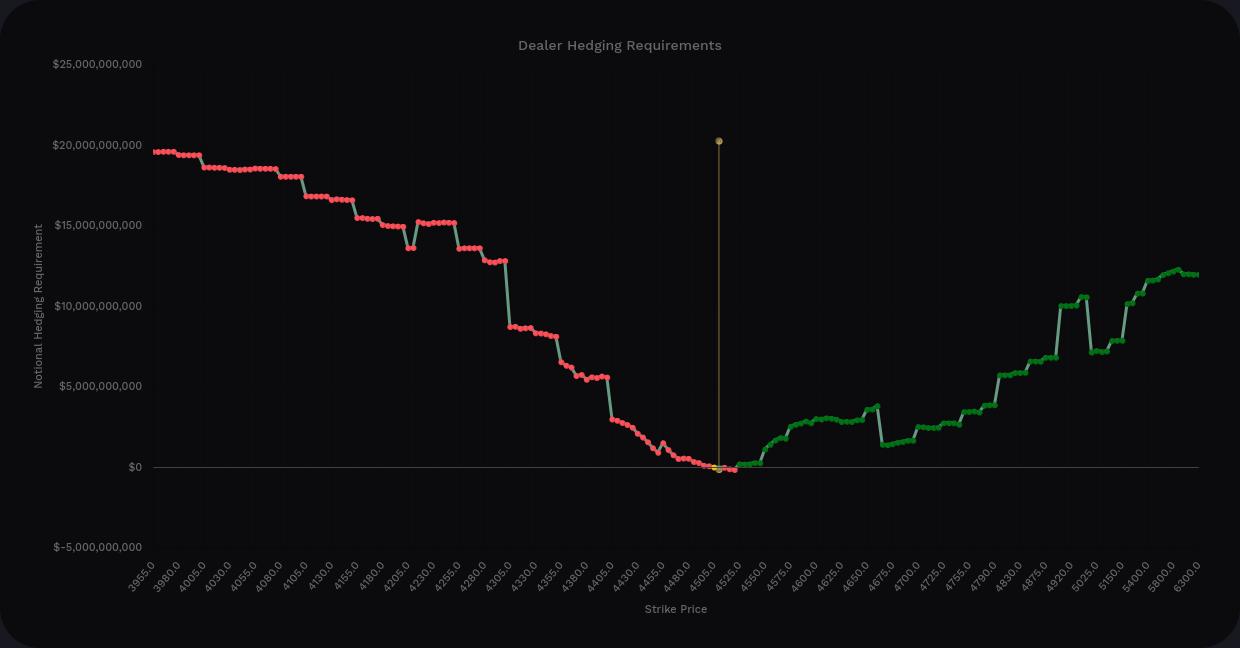
The first real selling pressure from vanna shows up around 4665 above the price, and 4300 is the largest nearby positive vanna below price. SPX delta-adjusted gamma (DAG) is very weak and has selling pressure across the board.
TSLA
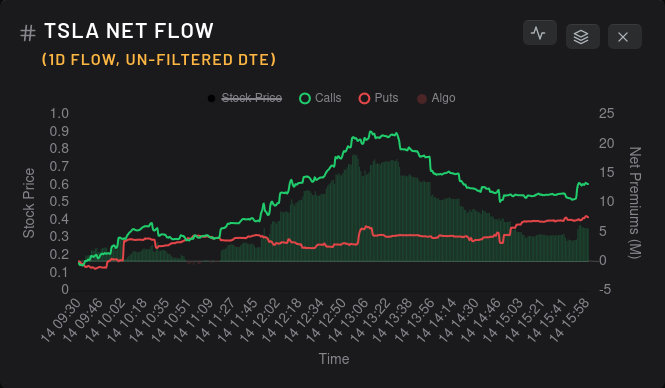
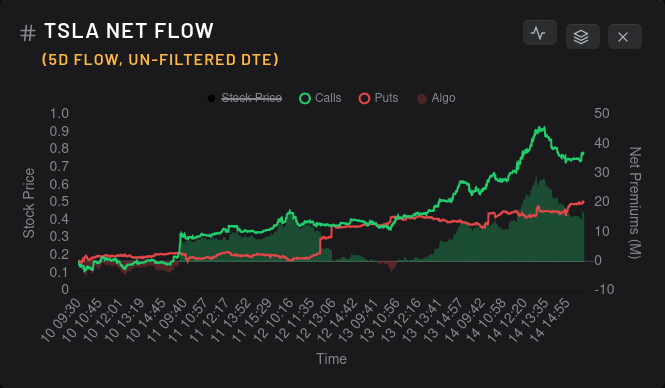
Let's tart with options flow data. Flow was mixed last week with a mid-week slump, but Friday was back to a fairly bullish flow again:
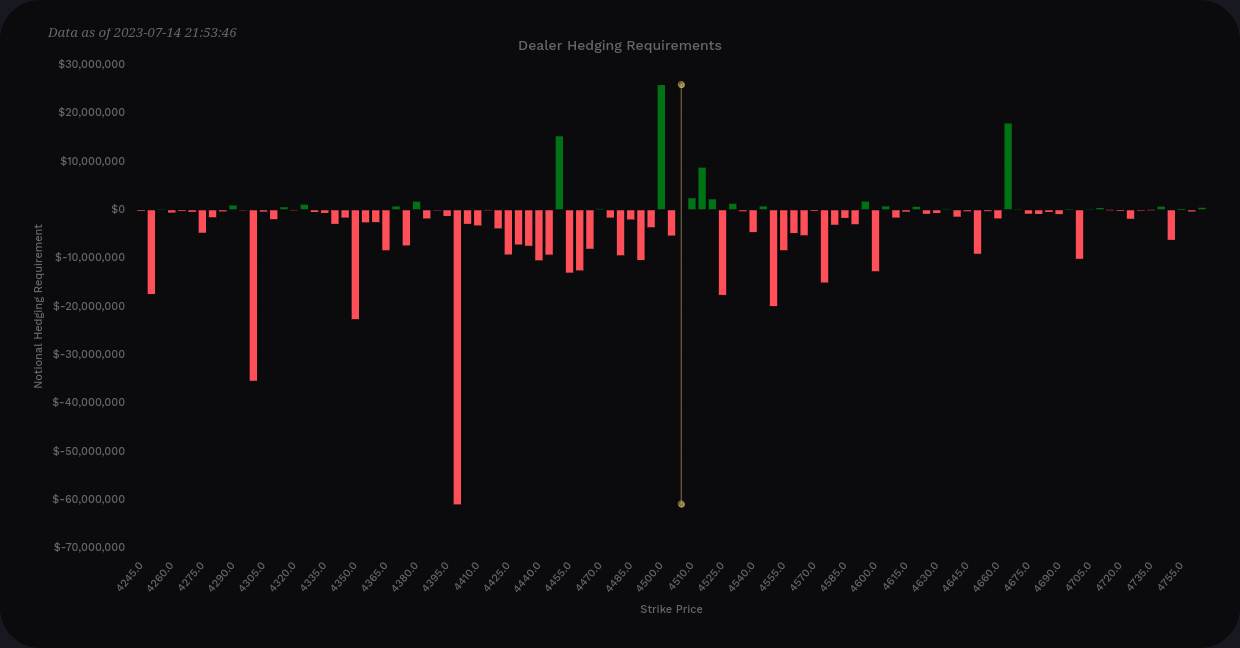
TSLA's vanna is packed into a tight range, which makes sense with earnings so close. If price were to drop under $280, that big negative vanna bar would flip positive and apply more buying pressure as price moved further below $280.
At the moment, TSLA's vanna curve looks quite bullish to me. Positive vanna is mostly above the current price.
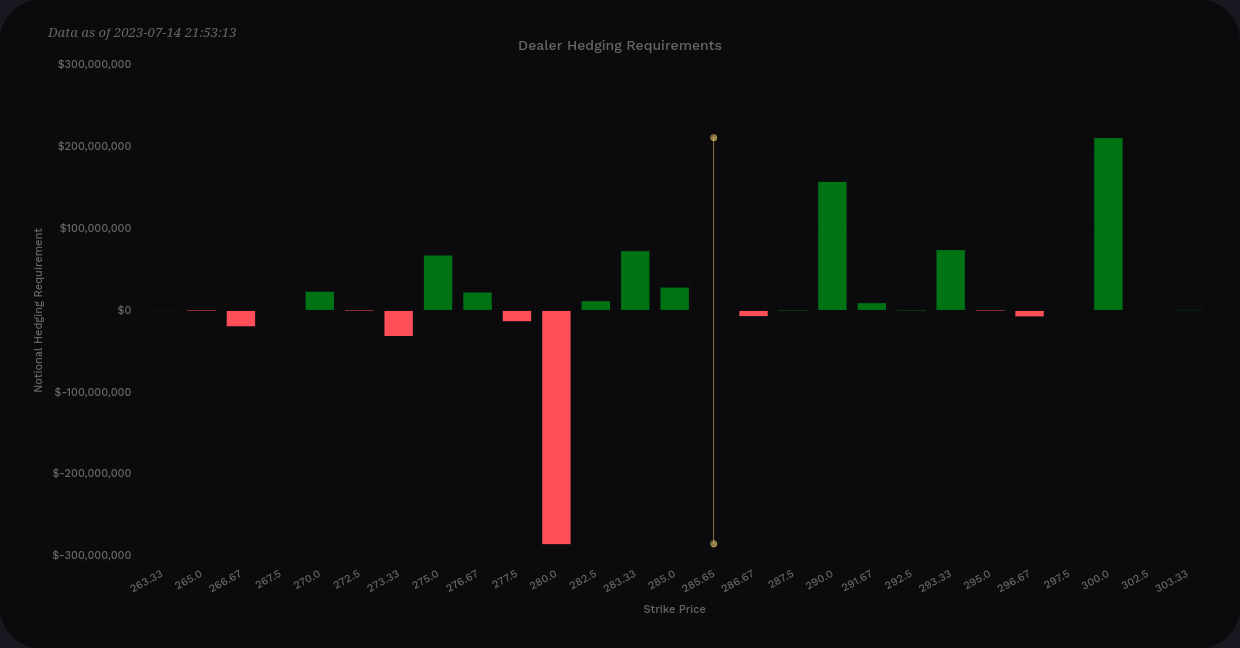
TSLA DAG seems centered around that $280 strike. If we drop to $280, this should apply some localized buying pressure that might slow price movement temporarily.
Keep in mind that with overall market IV this low, gamma and vanna effects are massively weakened.
Dealer greeks buildup has been flipping back and forth on a 15 day momentum measurement, but it abruptly swung short on Friday. This suggests that market participants are taking a bullish position on TSLA. If you remember from yesterday's charts, TSLA is right on the cusp of a critical resistance level.

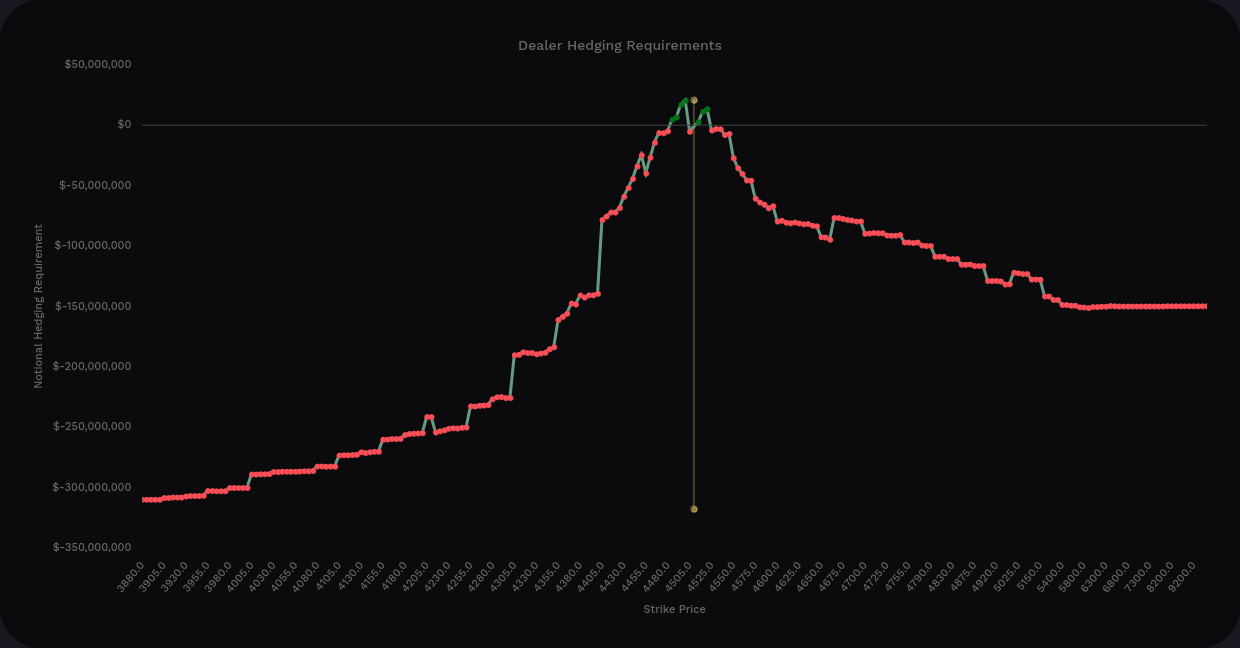
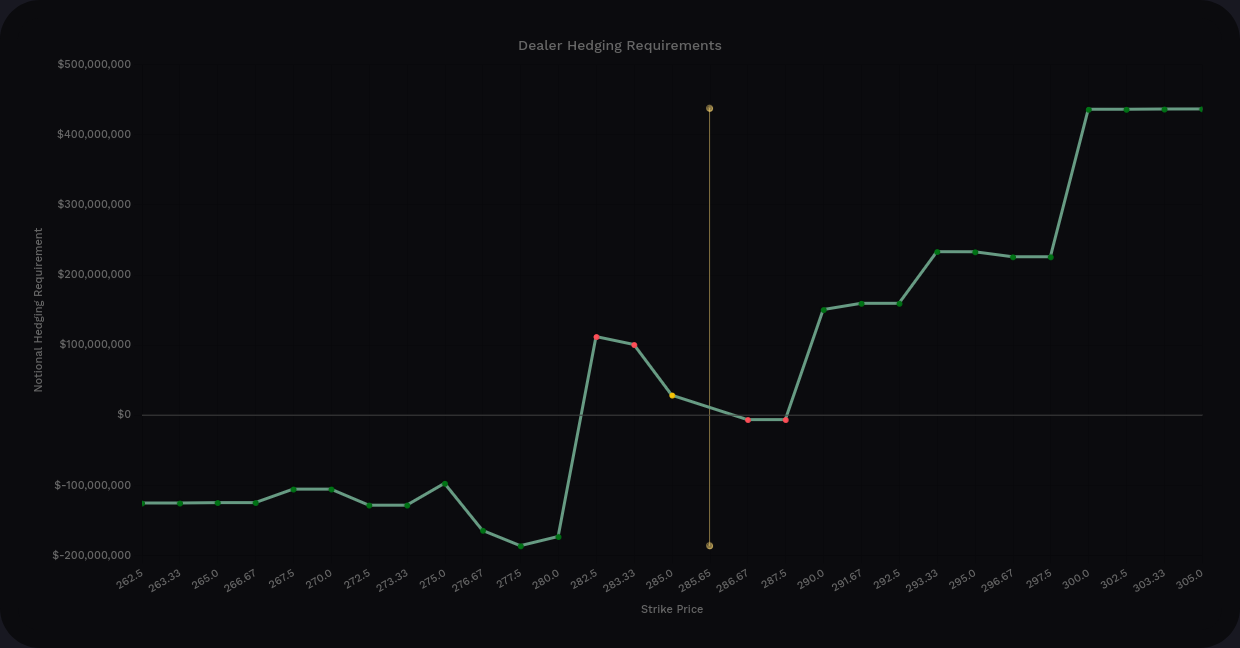
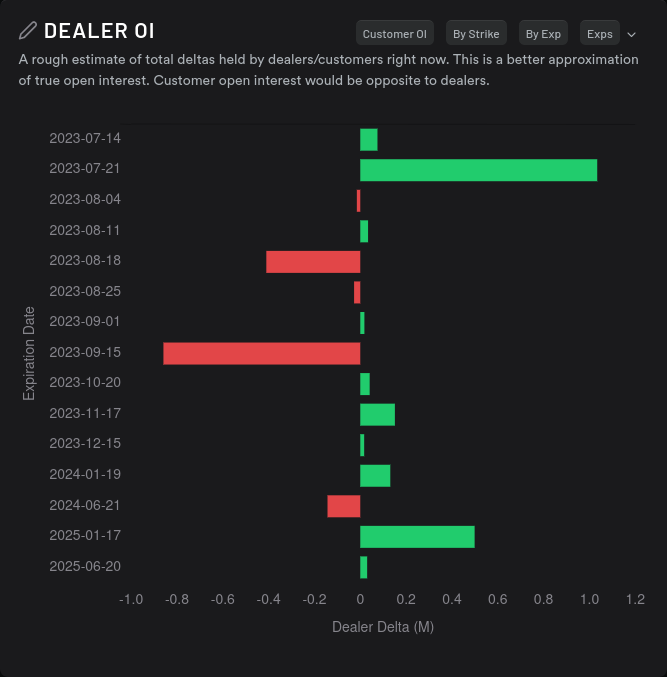
Dealer open interest for TSLA looks bullish until we reach 7/28:
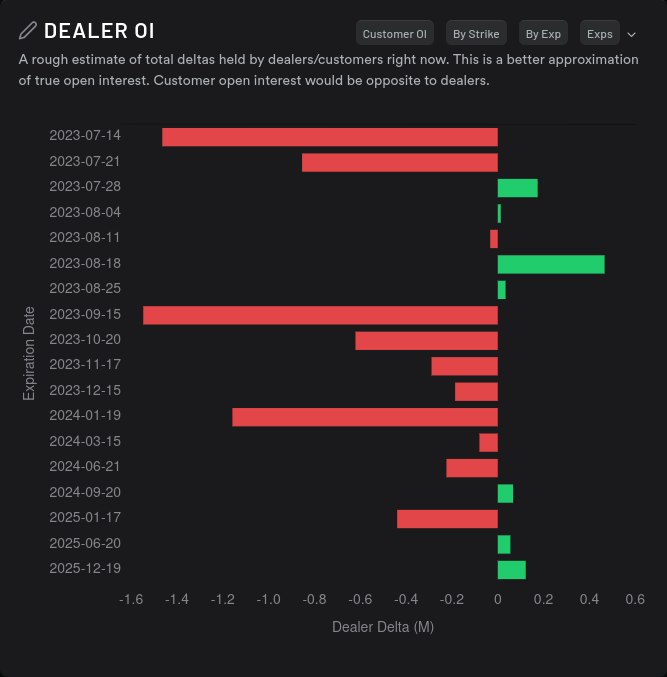
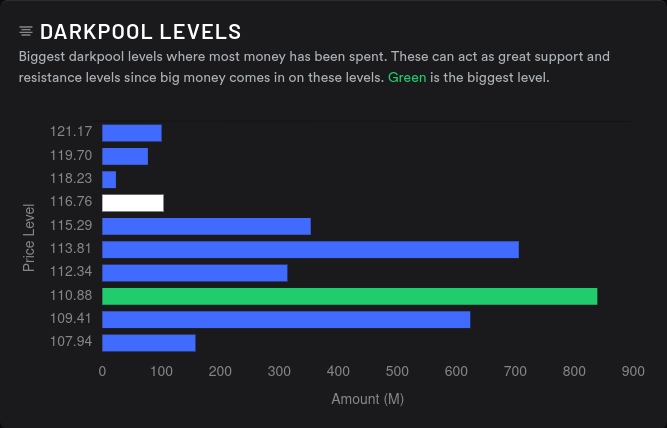
The $280 level looked critical yesterday in the charts and the options data suggests it's a critical level. What about dark pool trades?
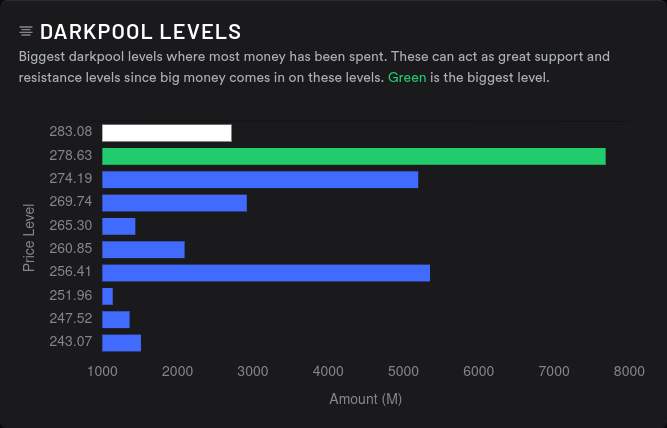
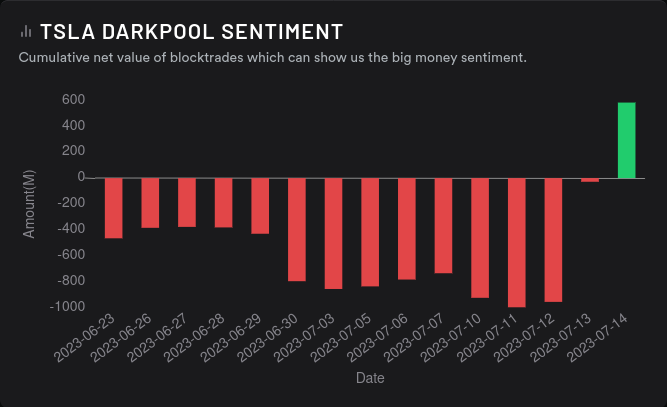
We have correlation! The dark pool volume at ~ $278.63 is massive and sentiment flipped positive on Friday. We broke above the $280 line after the market closed on Friday. Let's see if that holds today.
AMD
Earnings for AMD are on 8/1, yesterday's charts show we're at a critical resistance level around $117, and options flow flipped incredibly bullish on Friday:
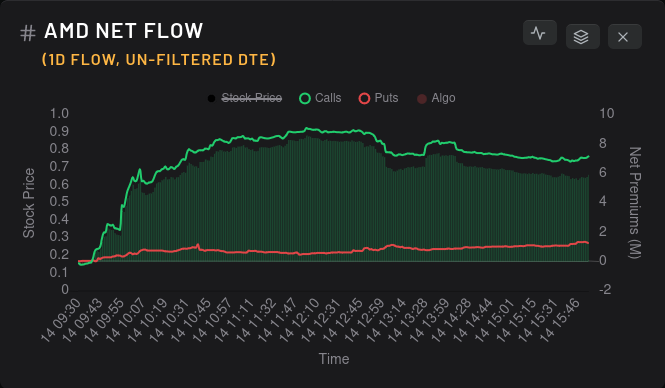
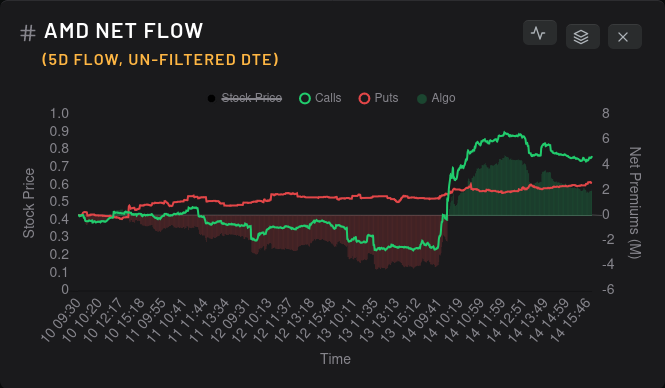
Friday really caught me on my heels. Sure, vanna charts looks bullish for AMD, but vanna was incredibly weak. Something else had to be driving Friday's rally.
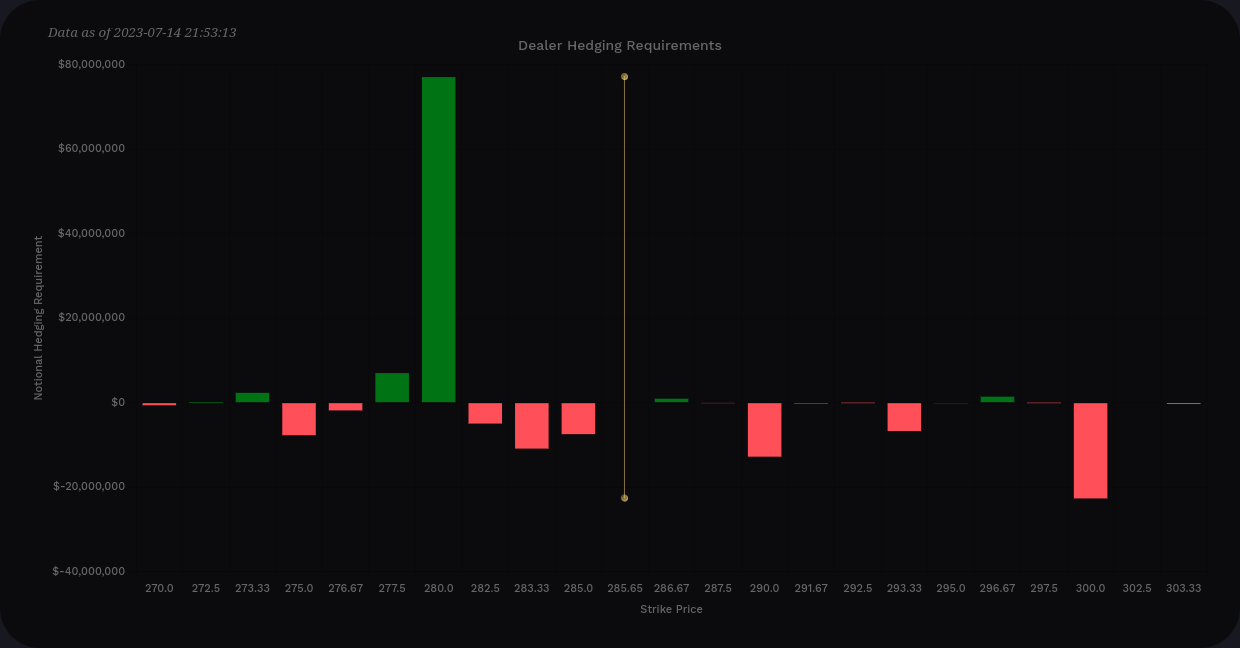
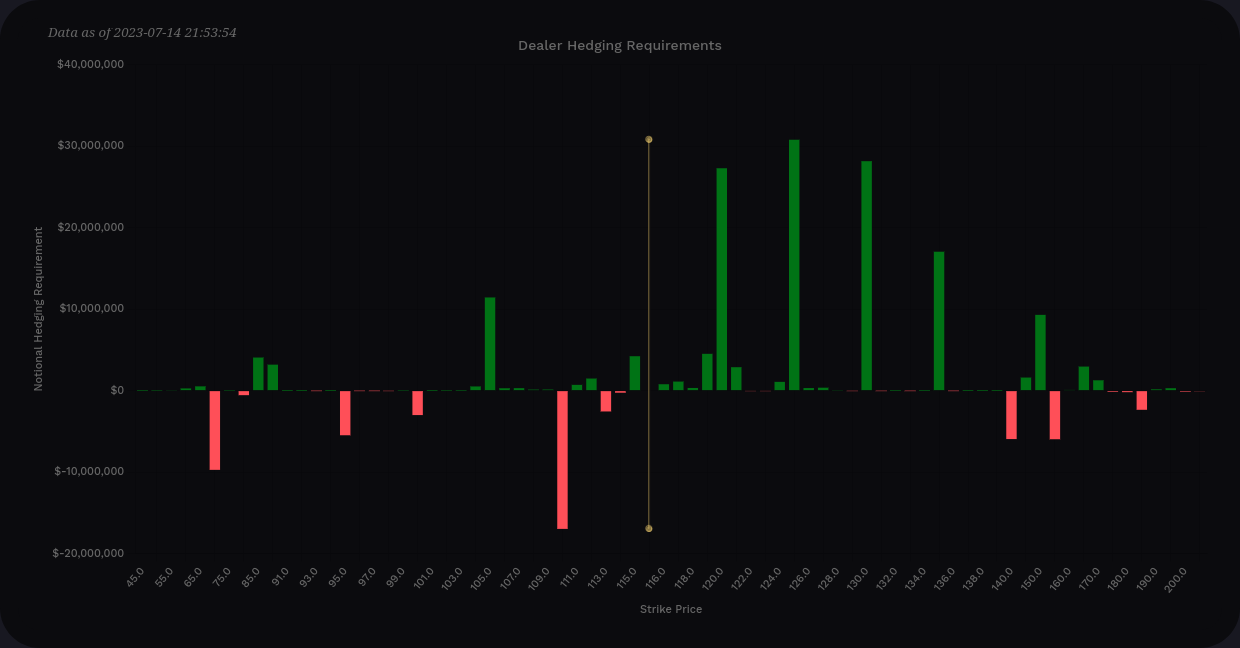
AMD's vanna charts look about as bullish as they get, but vanna remains weak. There's a decent amount of positive vanna scattered above the current price with $105 being the only area of concern on the downside. $125 seems to be the target with the tallest vanna bar there:
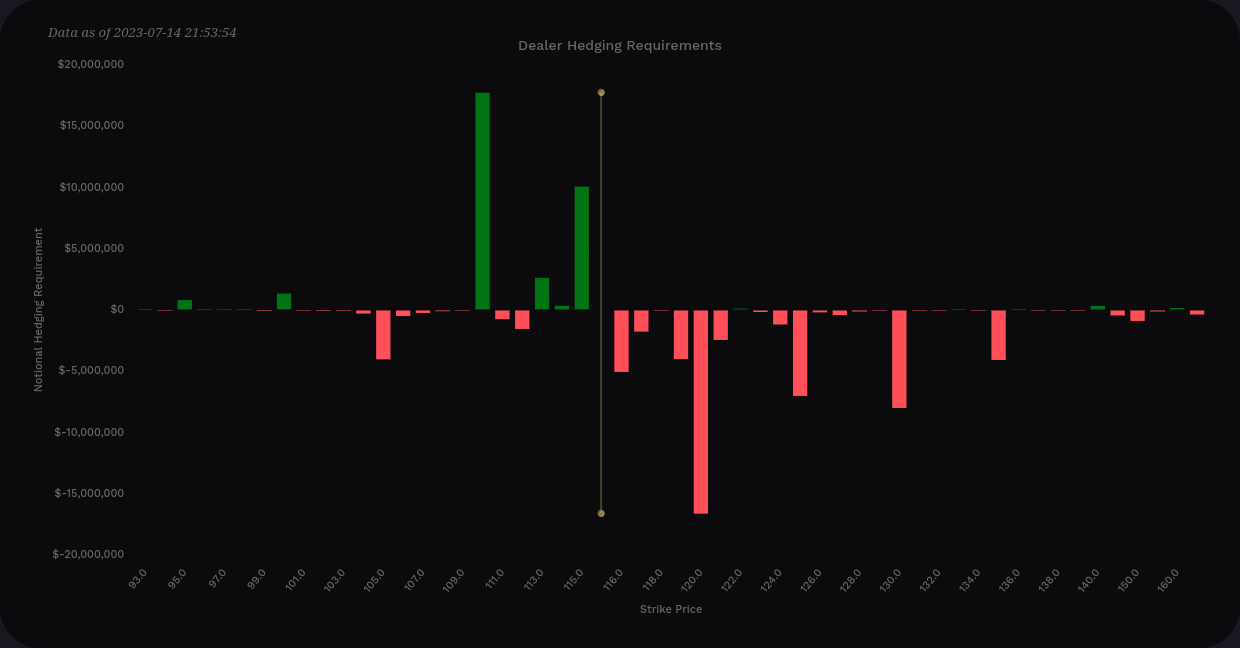
AMD's delta-adjusted gamma shows support at $110 and $115 with a selling pressure wall at $120. However, the tallest bars for gamma are under $20M, so don't expect big effects from any of these.

Dealers are still stacking up short contracts in slow, steady amounts for the past four days. This suggests that market participants are making steady amounts of bullish bets that are outpacing the bearish ones. As a bullish bias trader, I like to see this as we move towards earnings.

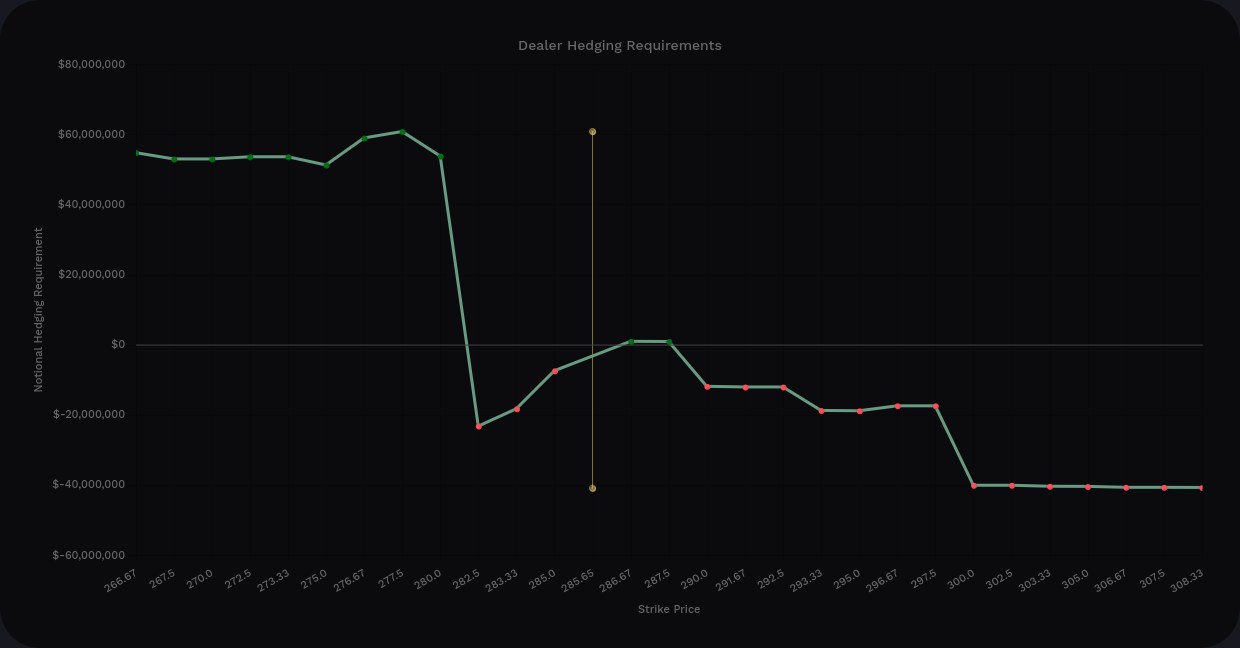
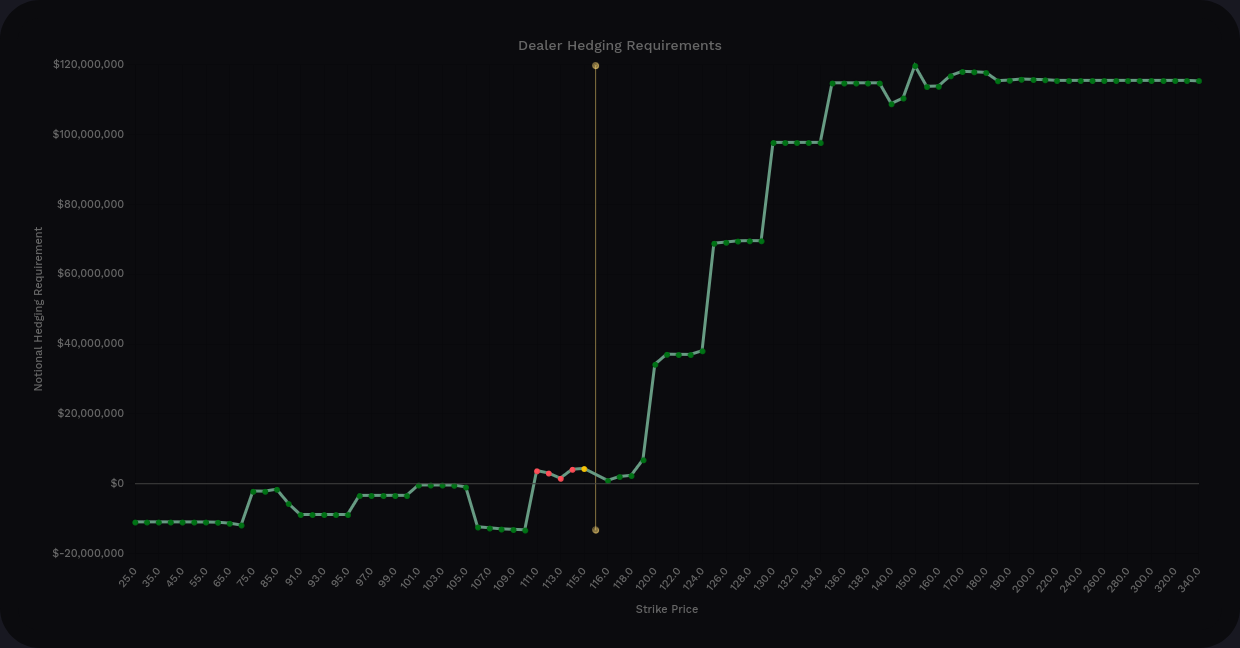
Dealer open interest suggests that AMD might take a dip this week and return to strength in August and September, but note the size of the x-axis.
I noted yesterday that AMD's $117 resistance level will be critical to watch. We can see buying pressure from vanna above that level and support from gamma at $110 and $115, but will dark pool data correlate with the charts and options data?

Maybe not. Sure, sentiment is still bullish, but it's leveling off. There's not much volume up around $117 where I'd like to see it, but $110-$115 looks quite solid. This looks less bullish than TSLA's setup, but I'm feeling quite confident that $110-$115 should hold as support unless a binary event throws a wrench into the gears. My next support line on the charts is around $109.
Thesis
First off, there is an incredible amount of data and announcements over the next two weeks. No matter how you trade, add a little extra caution as you make your moves. Remember position sizing, stay liquid, and stick to your trading rules.
For TSLA, bullish movement over $280 makes me hopeful, but I don't know if we see anything past $300. Earnings could destroy all of those levels – to the upside or downside – so take that with a grain of salt. I still have shares with a $255 cost basis and a short $295 call expiring 7/21 and I plan to keep those around through earnings. I'll exit the short call with a 50% gain (those are my trading rules) if I'm able to. I don't plan to add on any other TSLA trades this week.
I took a strong bearish approach to AMD last week and loaded up on covered calls from $115-$119. Those are definitely being threatened right now, but my cost basis is around $97. Getting assigned Friday would set me up to take profits on these and that's not bad, either. If AMD can creep over $117 and hold, I might consider a short put through earnings depending on premium.
Good luck to all of you this week. 🍀
Discussion