Options analysis for September 5

Time for another look at AMD and TSLA. Let's examine vanna, gamma, dark pool data, and charts to see where we're going. 🤓

Welcome to a new (short) week in the market. 🌄
If you missed yesterday's Charts and Coffee, go back and have a quick read. I did a deep dive into SPY's chart to see where the overall market stands.
I'll dig into AMD and TSLA today, but first:
All investments come with significant risks, including the loss of all capital. Please do your own research before investing, and never risk more than you are willing to lose. I hold no certifications or registrations with any financial entity.
On to the nerdy data! 🤓
AMD
Friday was a little rocky for AMD, but it came out with a slightly bullish tilt be the end of the week. The five day flow is definitely bullish, but that y-axis is a bit smaller than I like to see.

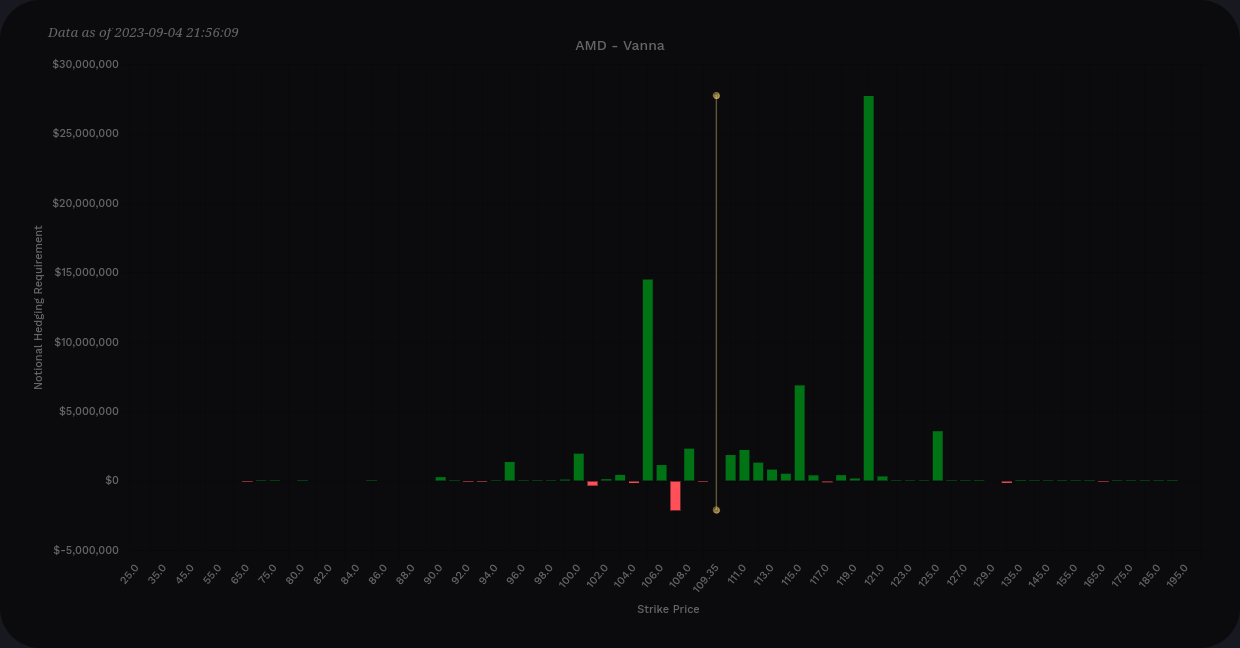
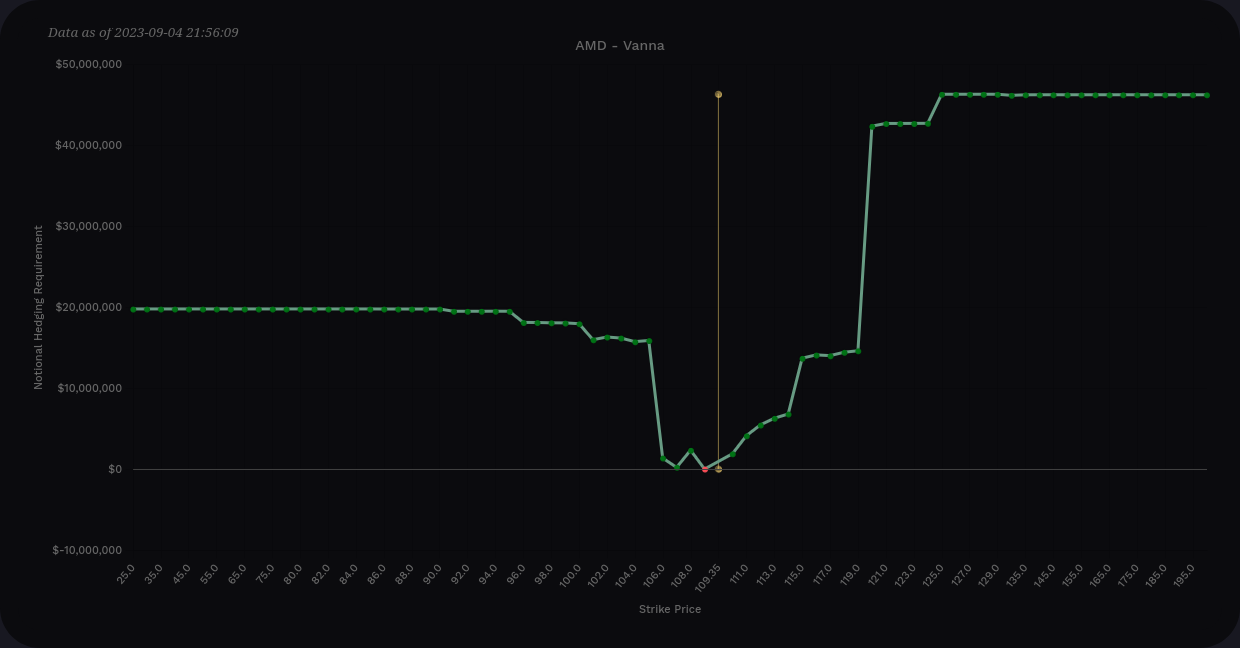
AMD's vanna is net positive on aggregate, which means it's set up for bullish price action as long as implied volatility (IV) remains steady or comes down a bit. Looking specifically at vanna from this Friday through 10/20, it's clear that something around $120 is a target.
Remember that the effects of vanna are strongest from 0.15-0.35 delta, so these effect will start to weaken around $117-$118. This has been one of AMD's troublesome liquidity zones for a while. Expanding IV could push us down to $105-ish based on this chart:
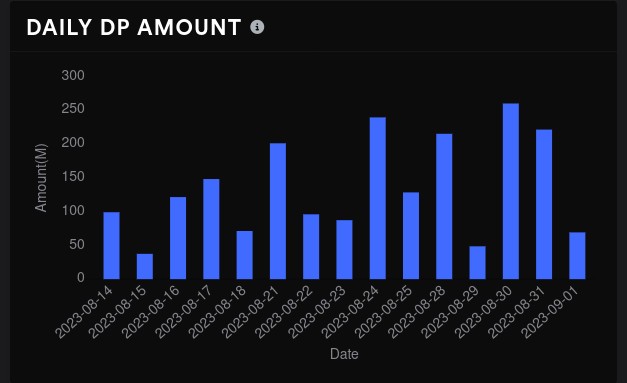
AMD's daily options volume and open interest are both climbing again.

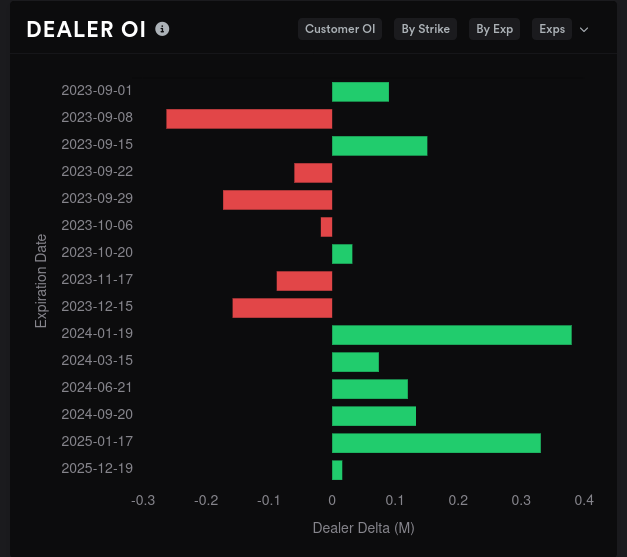
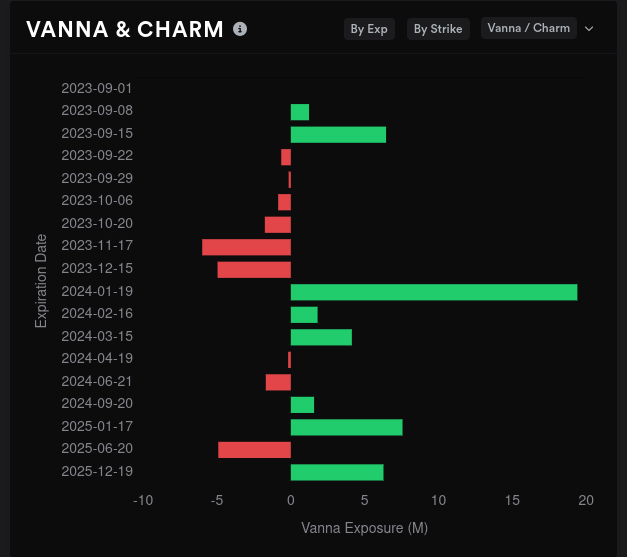
Dealer greeks still show dealers long (customers short/bearish), but the line is moving back to the middle slowly (a bullish move). Dealer vanna buildup is negative and this has been a bullish sign for AMD many times over the past 18 months.
Vanna remains mostly positive over all expirations and dealer open interest is scattered in both directions. Be sure to look at the x-axis on the OI chart. None of these expirations look very decisive one way or the other.
Aggregate GEX suggests a battle between $95 and $115 as the biggest price magnet with a big point of resistance around $110. This is a very high volume level from the chart, too.

9/15 is the expiration with the most gamma expiring and a run to $115 looks like a high probability here. The $110 resistance barely even shows up on the chart for 9/15.
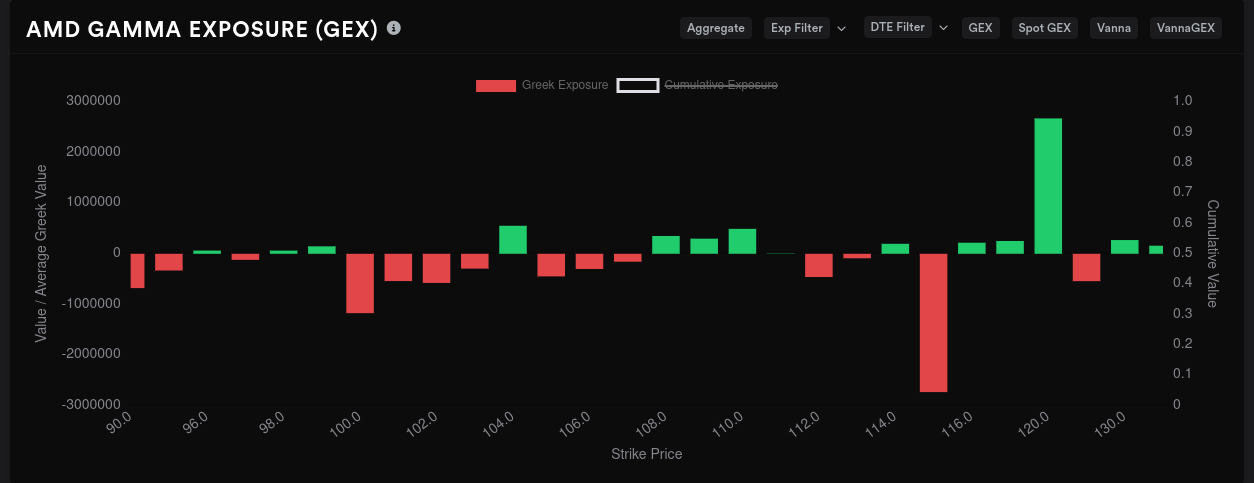
The reason for this discrepancy for $110 is because Tradytics still has data for 9/1 in the aggregate chart. So my takeaway here is that the $110 barrier was extremely strong for 9/1, but it has disappeared for 9/8 and 9/15. 🎉
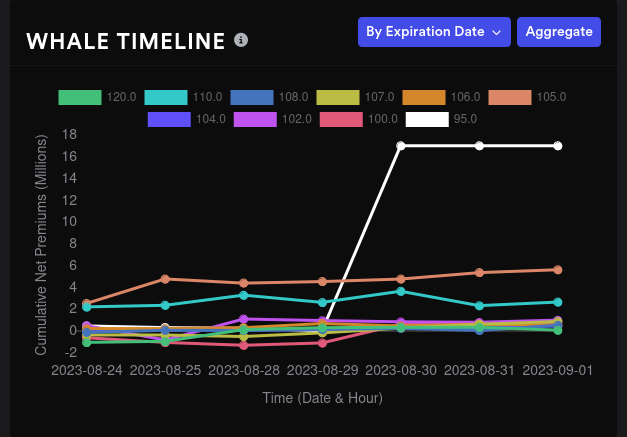
Whales went crazy bullish on $95 on aggregate last week and they held through the remainder of the week. Almost all of this big bet was made for 10/20's expiration.
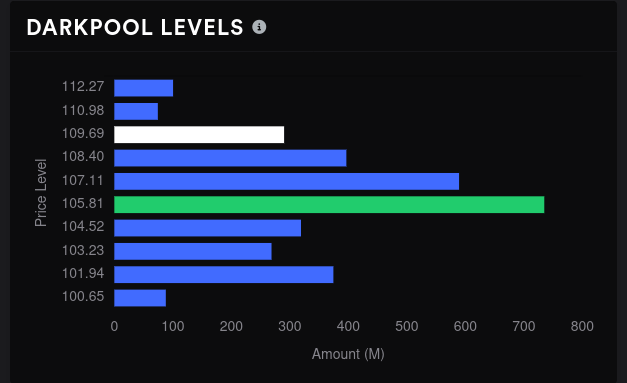
The chart tells us that $110 is a high volume zone, but $110 is absent in the dark pool data from Tradytics. I'm not entirely sure what this means, but I lean towards trusting the chart since I have all the data there at my fingertips.
AMD's dark pool sentiment is firmly bullish now with the biggest level around $106. Bulls have won the battle of the dark pools five days in a row.
TSLA
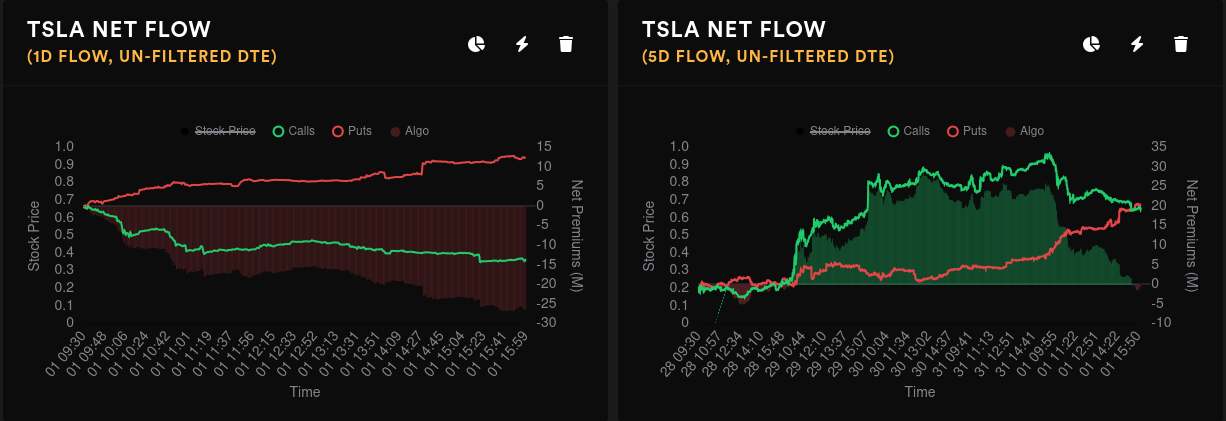
Friday wasn't a great day for bullish TSLA traders and the five day chart hit a critical point where the bull/bear lines crossed:
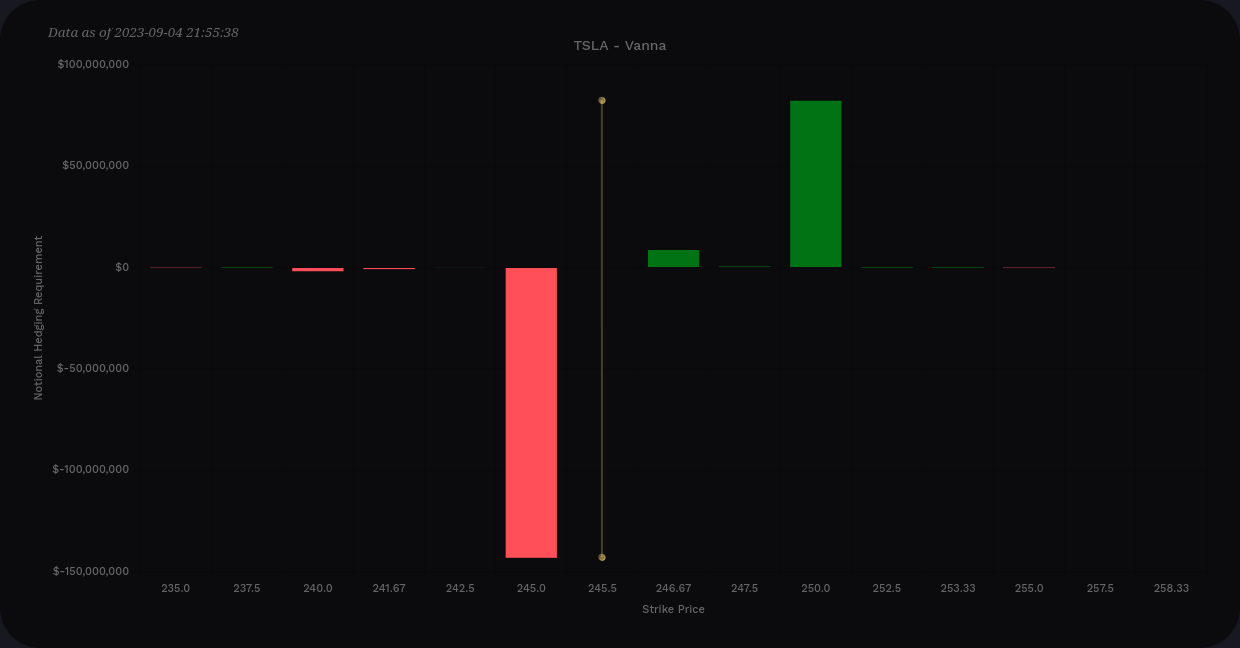
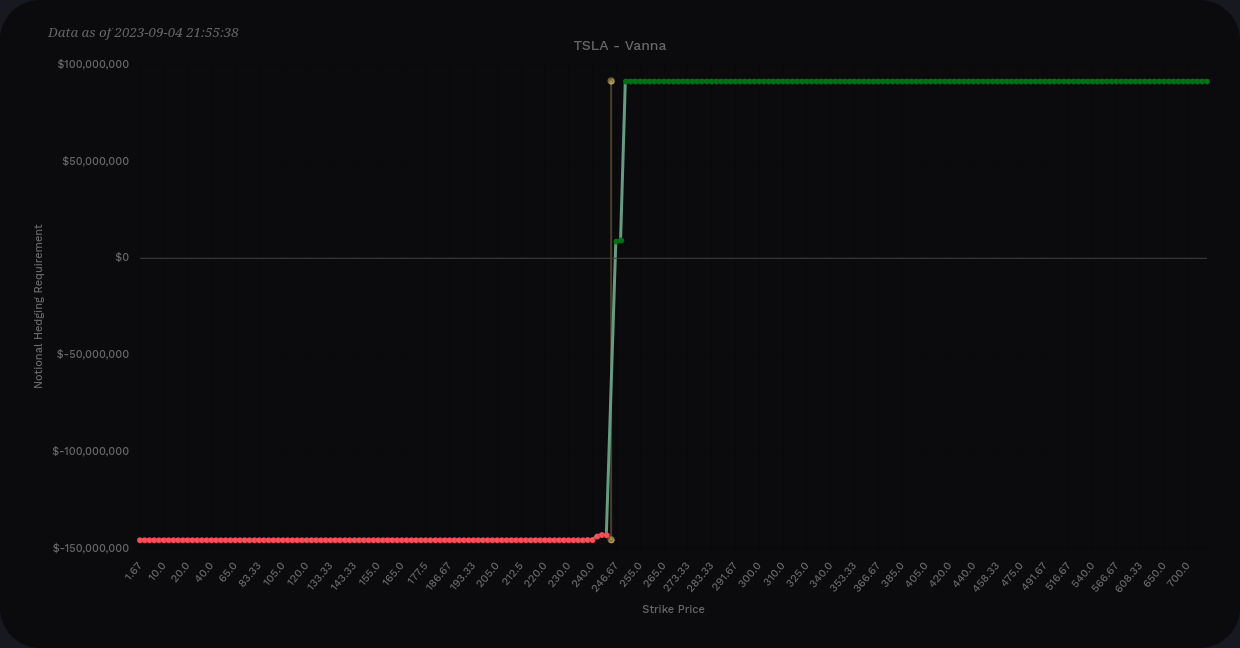
TSLA's vanna chart is incredibly concentrated on just two strikes through 10/20. $245 to $250 appears to be the range. Remember that if we fall below $245, that bar flips positive and we have positive vanna across the board.
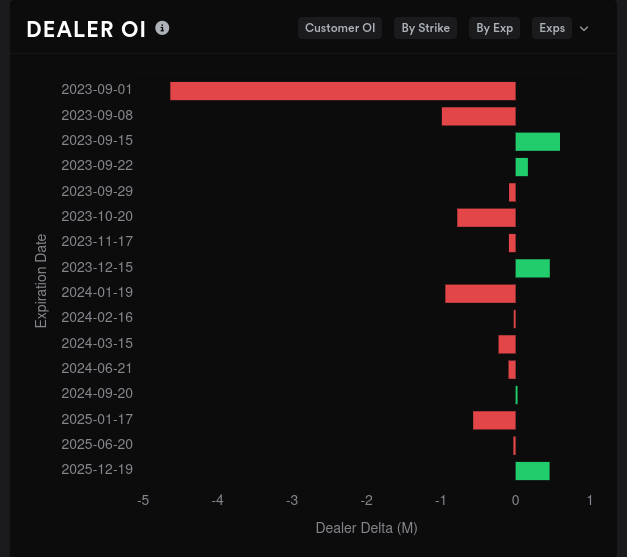
TSLA's options volume increased drastically on Friday and TSLA's IV rank is barely over 50%. Dealer greeks show large amounts of short contracts piling up on dealers and that suggests customers are long.
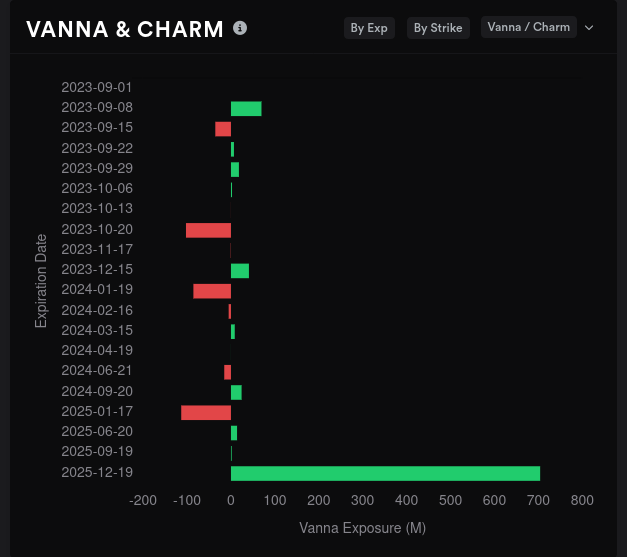
TSLA's vanna is quite light until 2025. Dealer OI was incredibly bullish last week for 9/1 and it throws off the scale for the entire chart. This week still looks quite bullish with dealer deltas almost to 1M deltas. The y-axis here isn't as strong as I'd like to see, though.
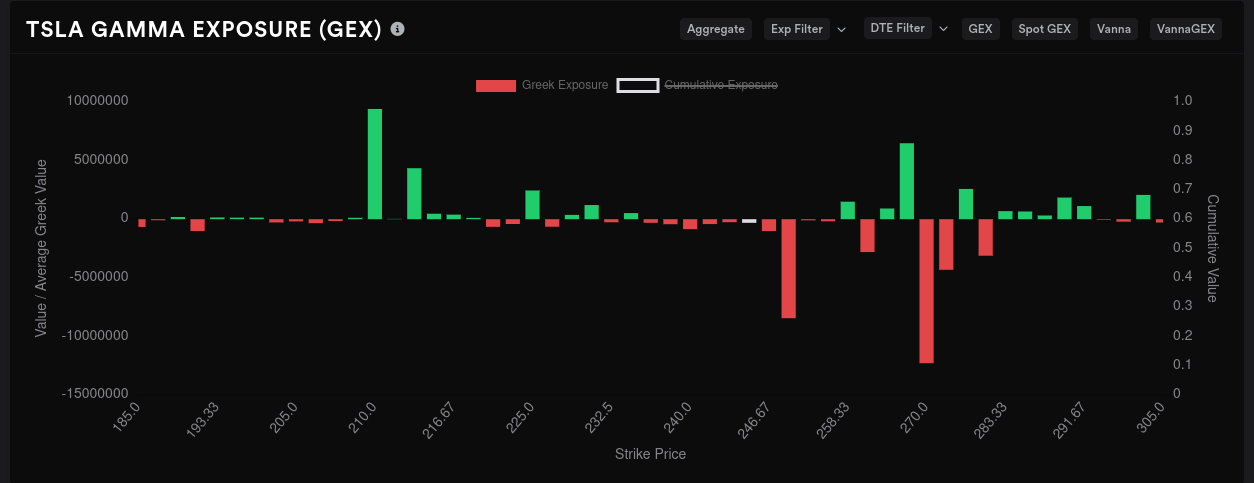
GEX is tough to measure here because 9/1 had so much gamma expiring. I'll be interested to see if traders rolled to 9/8 or 9/15. This will be good to examine tomorrow.
However, we can still get a good look at the next two OPEX dates to get an idea of where we're headed. Remember that our two vanna areas were at $245 and $250.
9/15 suggests $270 as the most likely target for price with $250 also being a high probability strike. There's a decent amount of resistance just under $270 that needs to be breached. If price falls, there's not much to slow the vall until we hit $225 and $210.
10/20 is still a bit far out, but our two biggest price magnets sit around $230 and $290. There's plenty of downward resistance at $220 that would slow a downward move.

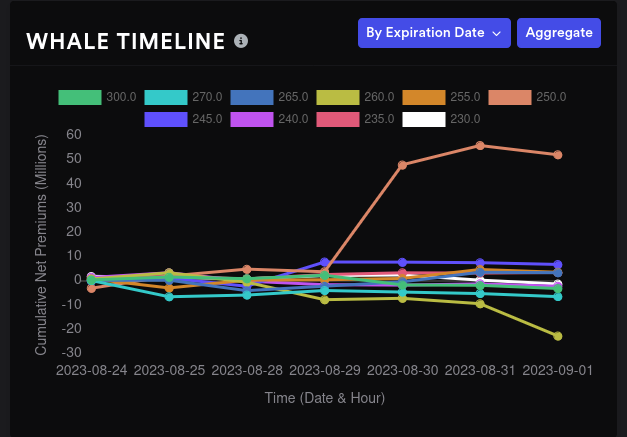
Whales have gone quite bullish on $250 on the aggregate chart:
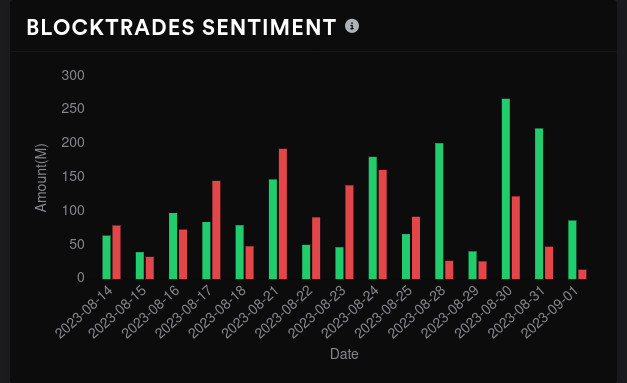
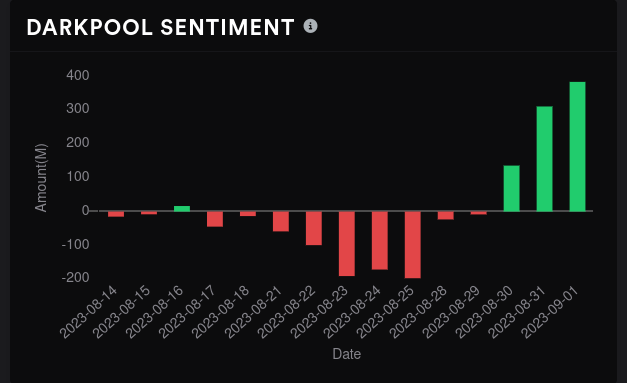
TSLA's dark pool data remains tilted bearish with some decent volume last week. Bulls won the battle two days in a row (barely) and our heaviest volume is a bit below the current price at $234. Much of the positive GEX sits just below this level in the $220's.

I didn't look at TSLA during yesterday's Charts and Coffee post, but if we examine the price action since the last high, we're perched right on top of the VWAP line comine down from that day.
Also, the volume by price indicator says our highest volume appeared around $265. That could be a point of resistance for price movement. The $245 and $235 levels have nice, rounded waves of strong volume there that should support price if it begins to fall. There's also another VWAP line up from a recent low that sits just over $230 which may provide support.

Thesis
AMD's run to $115 looks more and more possible lately with bullish options flow plus the disappearance of the $110 resistance. $117-$120 has been a rough area for AMD for a while and it's going to take some serious volume to push past that point. We have a positive GEX wall there as well.
I'm a bit wary, though, because on the downside, it looks like a return to the $90's is definitely possible. That's an area where I'd likely go bullish if the broader market still looks good.
To recap, I'm bullish on AMD from $95-$100 and I'm bearish if it gets into that $115-$120 areas. All of my shares are covered right now from $108-$114 with calls.
TSLA looks like it has all the underlying mechanics for a decent rally, but it just needs a spark. A run to $260-$265 seems possible, but I'm doubtful for much past there. If we pull back, I'm thinking $230-$235 is where we might stop.
Half my TSLA shares are covered at $255 and I have two short puts at $245 and $250. All of those expire on 9/15.
All my trades and trade notes are updated on Theta Gang. Good luck to everyone today! 🍀
Discussion