Thanksgiving week pre-earnings analysis of NVDA

NVDA's earnings call is coming up tomorrow (11/21) after the close. Let's take apart options data, institutional trades, and stock charts to make some predictions on where it might be going. 🤔

This holiday week has an added bonus: NVDA earnings. The much-anticipated earnings call happens after the market closes tomorrow, Tuesday, November 21st. Earnings are estimated to be $3.367/share with $16.191B in revenue.
What does all of NVDA's stock and options data tell us about this earnings call? Let's try to find out.
All investments come with significant risks, including the loss of all capital. Please do your own research before investing, and never risk more than you are willing to lose. I hold no certifications or registrations with any financial entity.
On to the nerdy data! 🤓
Vanna
Market volatility is quite low right now with the VIX futures resting below 15 as of this morning. Could vanna go lower? Sure. Could it go higher. Certainly. Keep that in mind as we take a look at NVDA's vanna data.
Aggregate vanna data across all expiration dates shows a curve that makes me bullish and nervous at the same time. On the bullish side, I like seeing a ton of positive vanna above price without too many negative vanna dips. If IV remains low or decreases further, this should become a magnet for price action.
However, I don't like the look of the downside here. There's not a lot of vanna on the chart so slow down any potential moves to the downside. There a big wall around $460 that might repel price action if we drop down there, but if we cross it, I really don't know where we might stop.
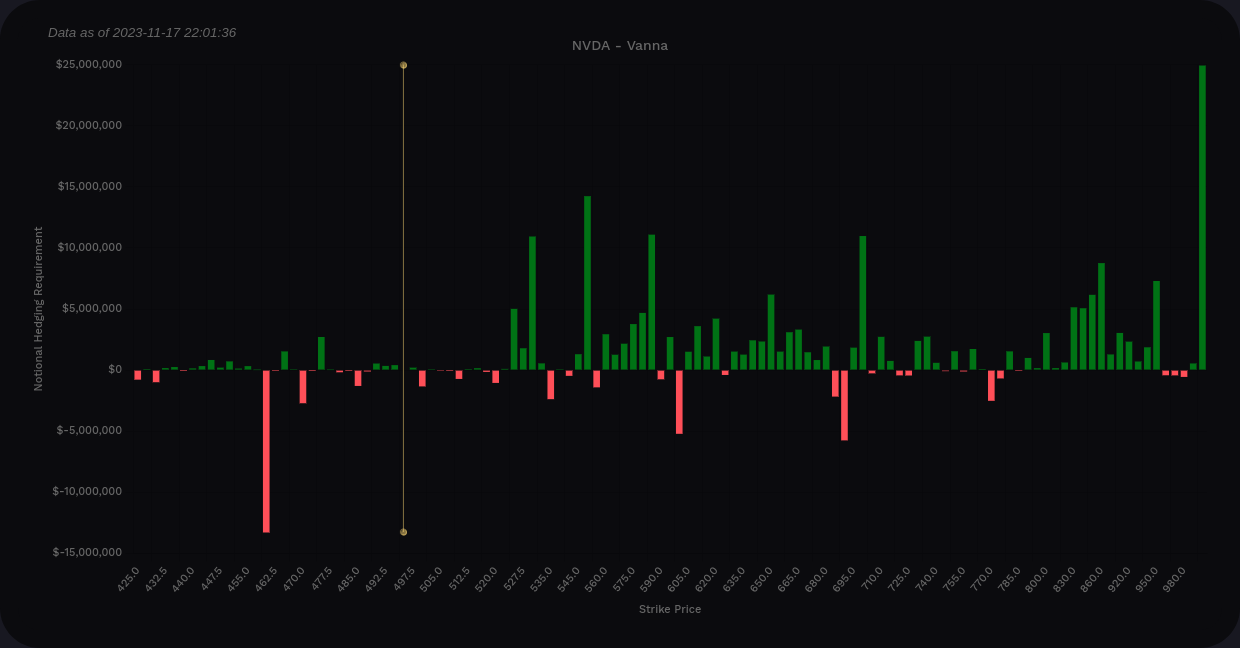
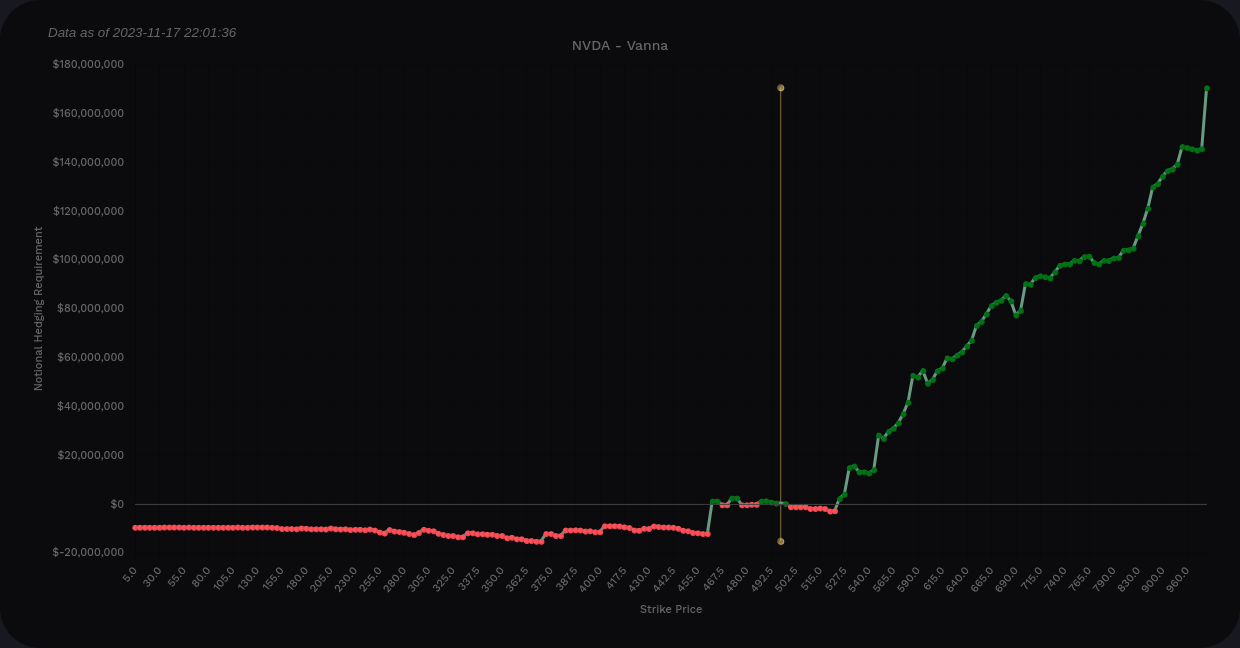
NVDA vanna across all expiration dates
On the upside, we have a number of big positive vanna levels to choose from as potential magnets for price. The tallest bar within a reasonable price range is the $550 and that has been a standout level for quite some time. The $1,000 bar is enormous but some of these outlier plays are bets on volatility mean reversion and not an actual bet on the equity price.
What if we take a shorter-term view through the next OPEX on 12/15?
The curve shows plenty of positive vanna above price again, but I like the look of the downside a little better since there are some weak support levels that give an idea of where price might stop if it moves lower.
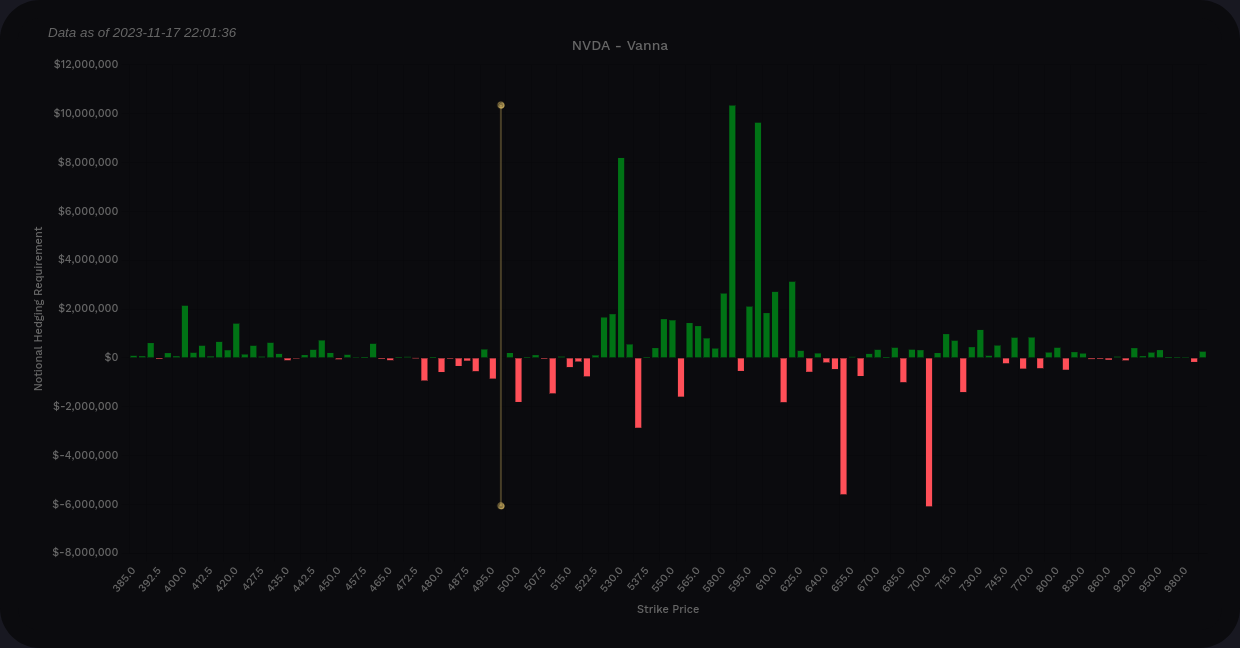
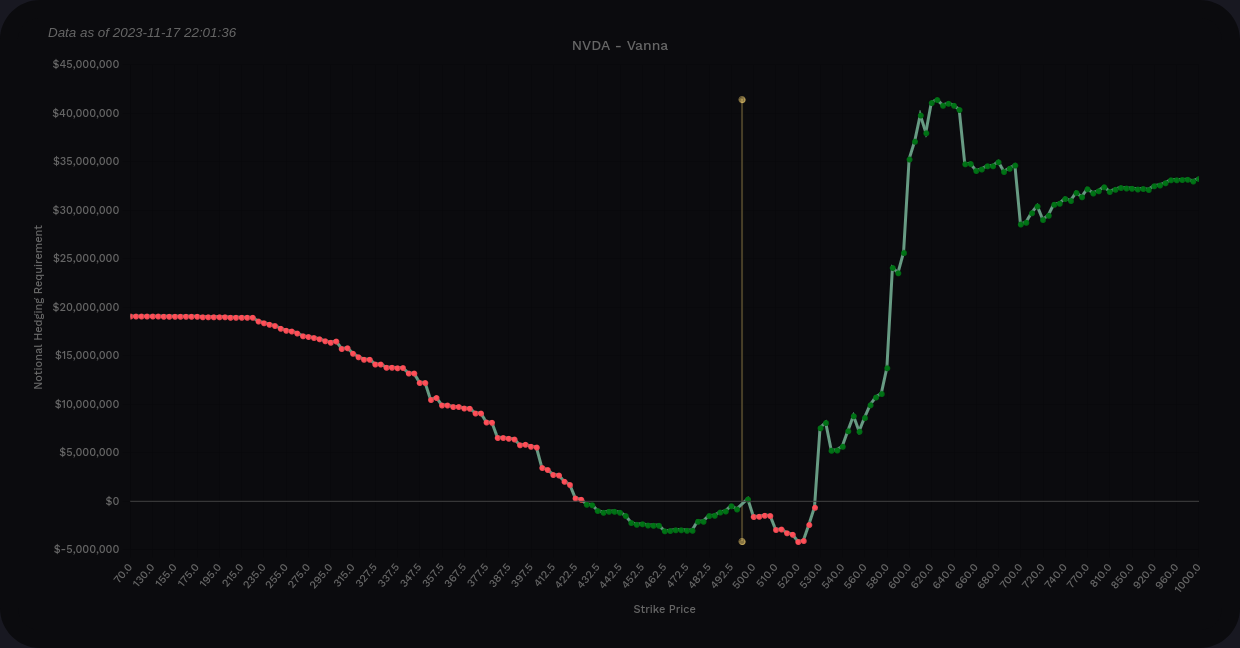
NVDA vanna through 12/15 only
$530, $585, and $600 all look like good targets to the upside. The biggest level of support on the downside doesn't show up until about $400 and it's fairly small.
Gamma
I'm using Volland's delta-adjusted gamma (DAG) charts here since they simplify gamma by flipping the gamma bars above the price. This allows you to look at the chart from a dealer's perspective as "green means dealers buy" and "red means dealers sell".
$465 to $510 are the biggest buying levels on the chart with selling showing up above price at $530. The downside is packed full of selling levels with the strongest ones around $380.
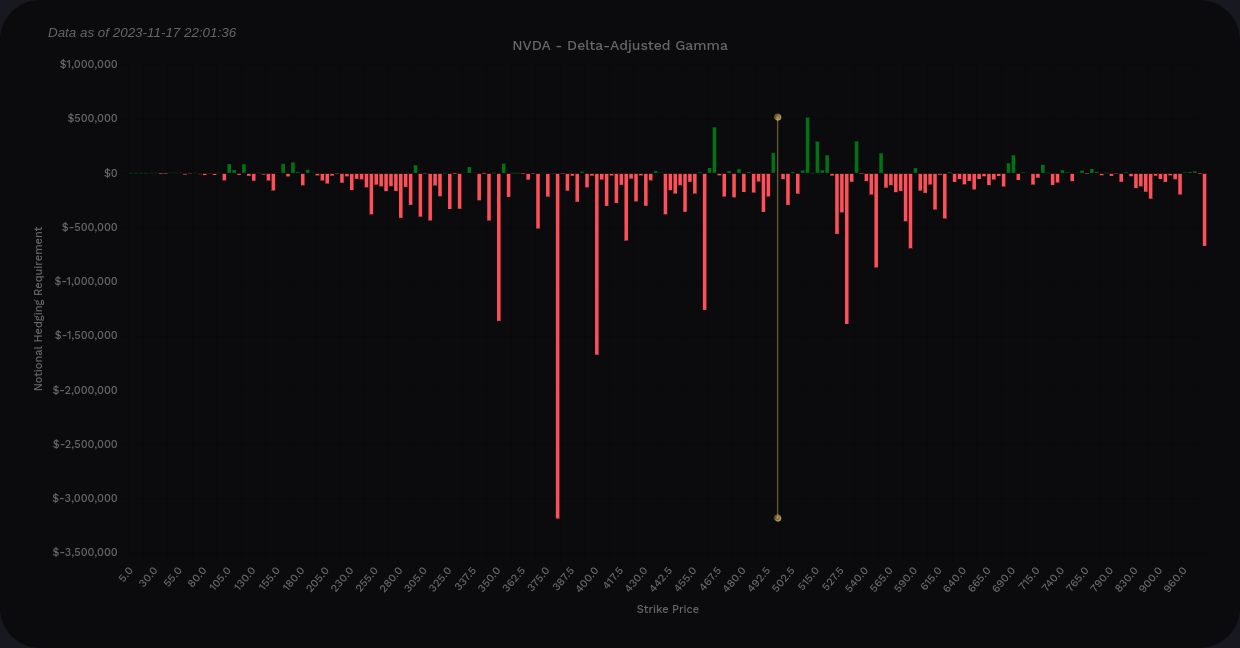
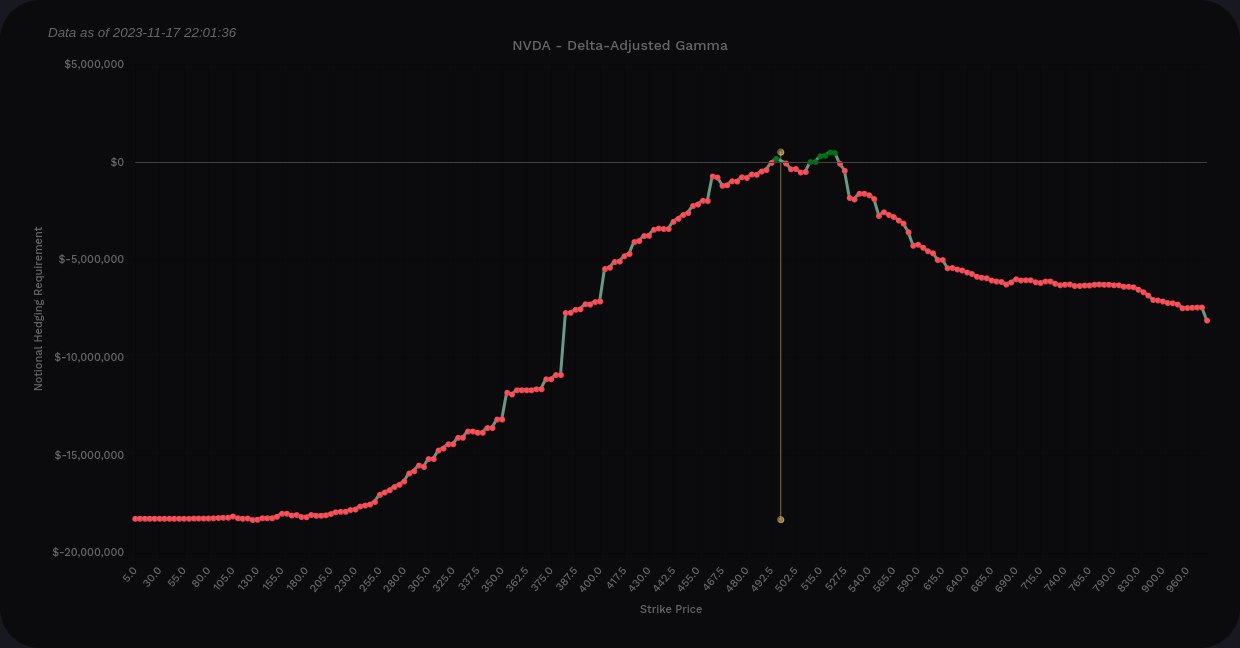
NVDA DAG across all expiration dates
One thing to keep in mind here is the Y-axis on these charts. Our vanna levels are topping $10-15M but these gamma lines don't even cross $2M except for the $380 level. This leads me to think that the gamma effects might be a bit smaller than vanna effects.
Institutions
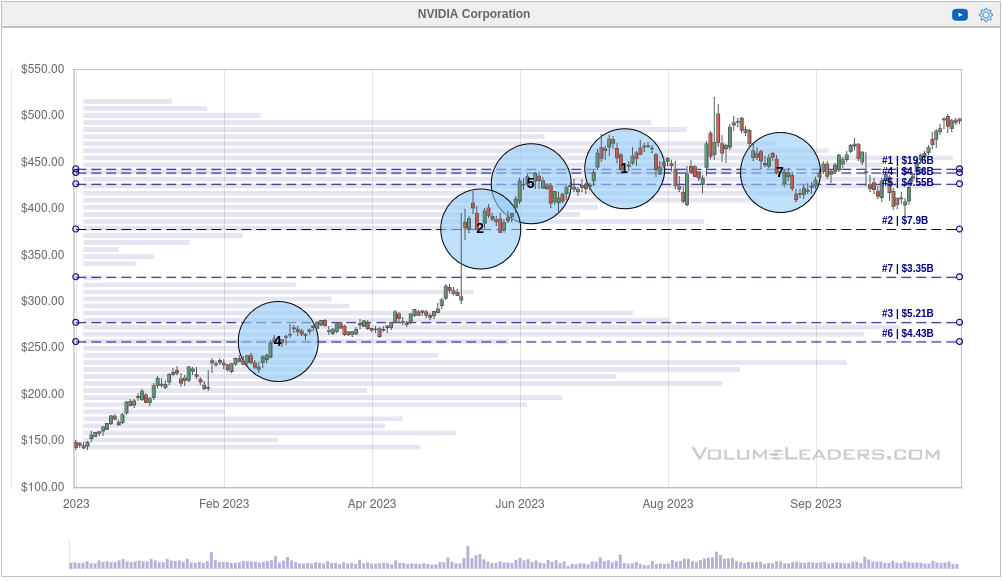
Sometimes institutional traders can give hints about where price might be going. These charts from Volume Leaders show you where and when the trades happened, but you don't get any data on whether they were long or short trades.
The 2023 year to date chart shows the 4th biggest trade in the spring before the big gap up in May during the AI rally. What happened after that? NVDA had four trades that were so large that they ranked in the top 10 trades that NVDA has ever had. 👀
Three of those trades, including the #1 biggest trade ever made in NVDA, were made around the $430-$450 level. Again, we don't know if these were long or short trades, so we have to infer with the other data we gather. This gives us a really good price level to examine.
Charts
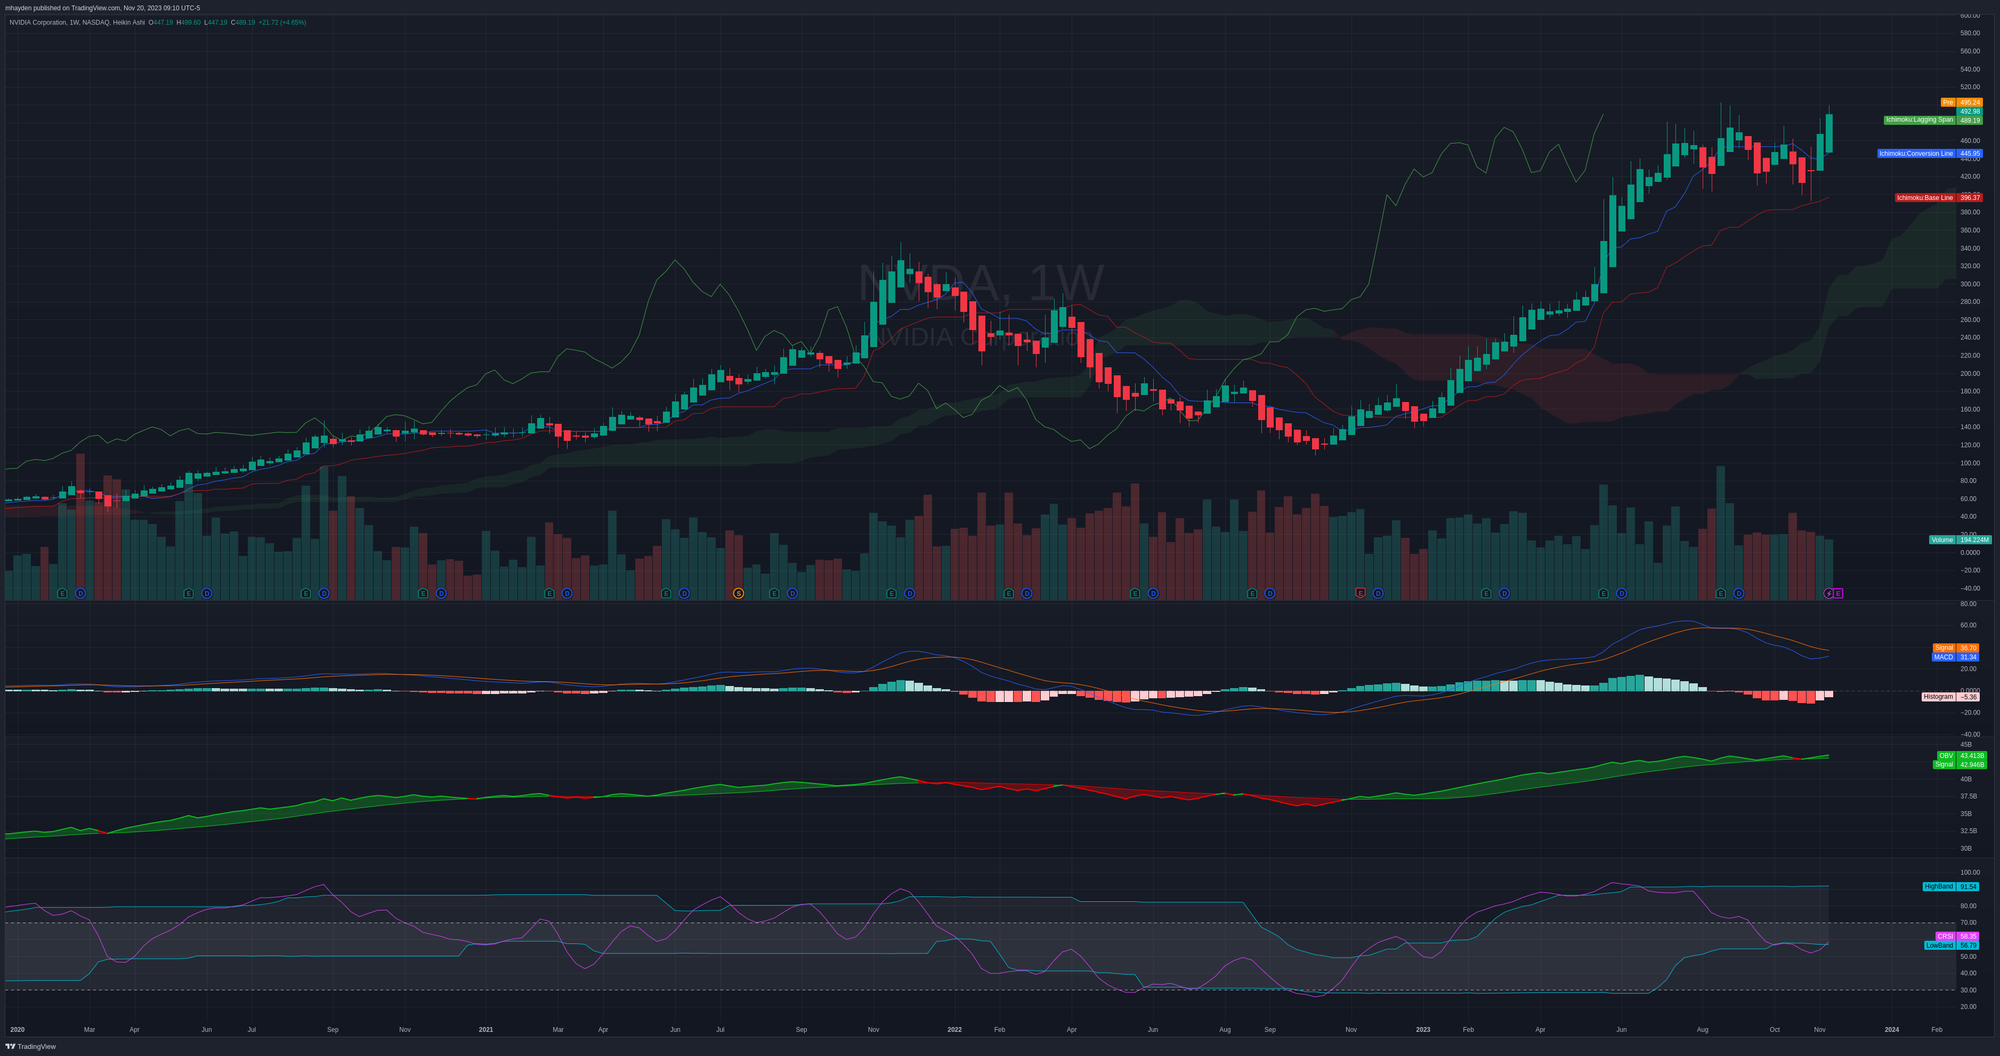
Let's kick things off with a weekly look at NVDA since January 2020. What do we find that's bullish here?
- Ichimoku cloud: Green line is above price, blue is above red, and the price is above a green cloud. This ticks all of the bullish boxes on the indicator.
- MACD: It's still well above zero and looks like it could make a bullish cross over the slower line this week or next. Bullish.
- OBV: Volume seems to match up with the recent rally as it increased while price increased. However, I'm a little worried since last week's volume was a little lower than the week prior. Still looking bullish, though.
- cRSI: I use an RSI indicator that has a moving channel based on what the stock is doing. This gives me a relative view of the RSI since some stocks can stay at very high RSI numbers for extended periods. NVDA is at the bottom of the channel and moving higher. It still has a decent amount of room to climb into the top of the channel. This feels bullish as well.
- Heikin Ashi candles: We have two HA candles in a row with no wicks underneath. I usually look for three of these in a row to mark a significant rally, so we're close here. Look back in early 2023 for a ton of bullish candles with no wicks underneath. There were a ton of them.
Now that we examined the long term view, let's bring it down to a daily chart to see if we spot something different. Here's what I see:
- Ichimoku cloud is a little different here with a red cloud, but all the other parts of the indicator look bullish.
- MACD is above zero and the faster line is well over the slow line. It looks like it could be losing some momentum.
- OBV still looks good and after a dip on Thursday, volume came back to support Friday's price movement.
- cRSI certainly is running hot as it ran outside the typical 70% range and exceeded its RSI channel.
The daily still looks bullish, but it's showing signs of momentum changes as we go into earnings. However, as we saw with AMD last week, semiconductors stumbled a bit mid-week and then began to recover.

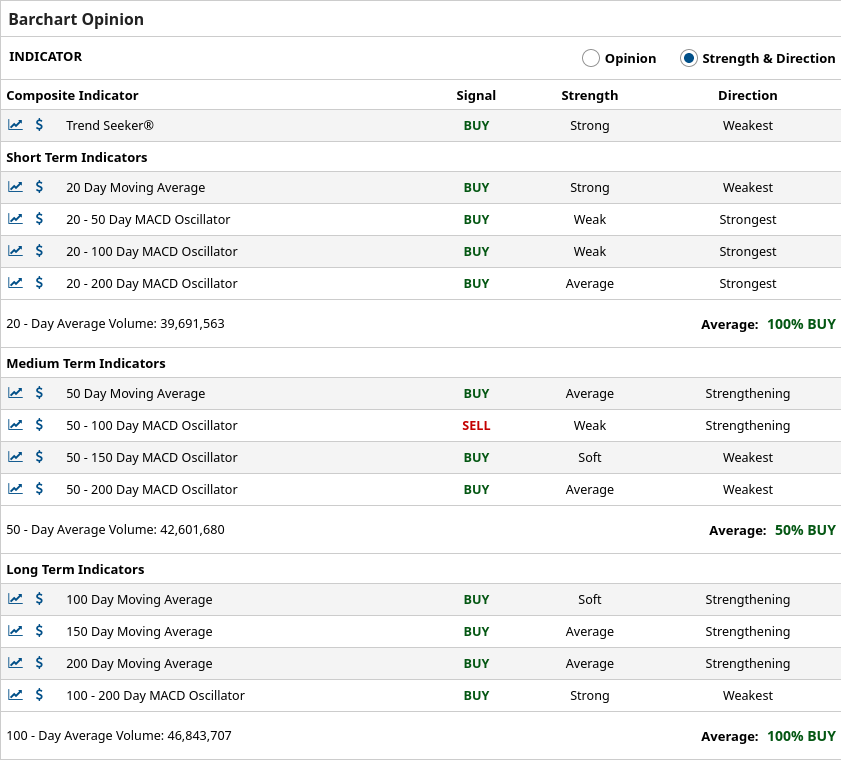
Barchart's opinion page shows buy signals for almost every indicator except the 50-100 day MACD. Some of these are a little weak in places, but this is a very bullish look.
Thesis
As much as it is difficult for me to believe, NVDA looks really good in the long term. There are some short-term stumbles happening, but it's in line with what much of the market saw during the middle of last week. I say it's hard to believe because NVDA continues to climb an incredible amount week after week.
Where might NVDA go after earnings? 🤔
If we move down, there's a lot of institutional volume in the $430-$450 range, including some of NVDA's largest trades in its history. There's also some help from vanna down around $460 and from gamma around $465. If we drop below $430 for some reason, $380-$400 is where we next find some support.
If we move up, there are plenty of targets to choose from between $530 and $600 depending on the time frame. After looking at vanna data for multiple expiration dates, it feels like the bets going into 12/15 are a bit higher in aggregate than those beyond 12/15. If we do go up after earnings, it leads me to think we might drift back down a bit into January/February.
As for my trades, I have a short strangle on NVDA that has been difficult to manage. It's now a $450/$505 for 12/15 and I keep scooting up the put side to pick up a little more premium as the call side turns more and more red. If we blast off past $505, this trade could be much more difficult to manage. 😬
One last note: earnings are binary events. These events are very difficult to predict and that's why options prices become so expensive around these events. Even if you had NVDA's earnings filing on your desk right now, I still think it would be difficult to predict where the stock price might go. Use caution around these events and watch your position sizing carefully. 🚨
Good luck to everyone this week. 🍀
Discussion