Pre-earnings OXY analysis
OXY has earnings this week and it's been following the market trends fairly closely. Let's dig into the data and make a prediction of where price might go. 📈

I added OXY into the rotation of my interesting stock tickers last month and it's been an interesting change from semiconductors and electric vehicles. Any companies dealing in oil have wild swings depending on the process of petrochemical products where they operate. Geopolitical tensions can also move prices around quickly.
OXY has earnings this week on November 8th. I'll dig into its data today.
All investments come with significant risks, including the loss of all capital. Please do your own research before investing, and never risk more than you are willing to lose. I hold no certifications or registrations with any financial entity.
Let's get underway! 🚀
Vanna
Volatility has been crushed lately, so it's a good idea to look for stocks that have positive vanna charts. Some are arguing that volatility went down too quickly recently and that there might not be enough left over to squeeze out for a continued rally, so keep that in mind.
OXY's vanna curve is positive overall and very positive on the right side above the current price. That's a good signal for bullish price action in an environment of decreasing implied volatility.
The bar chart suggests that vanna effects top out around $65 to $67.50 without much to move price after that. Downside support comes in around $60 and $55.
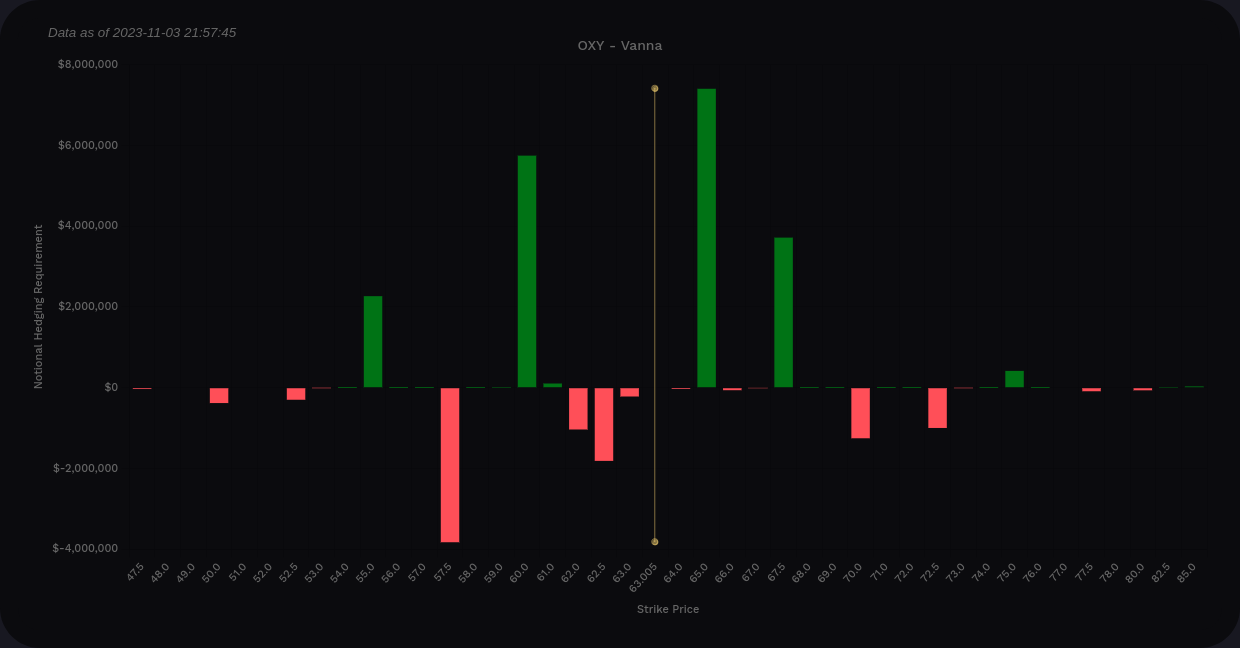
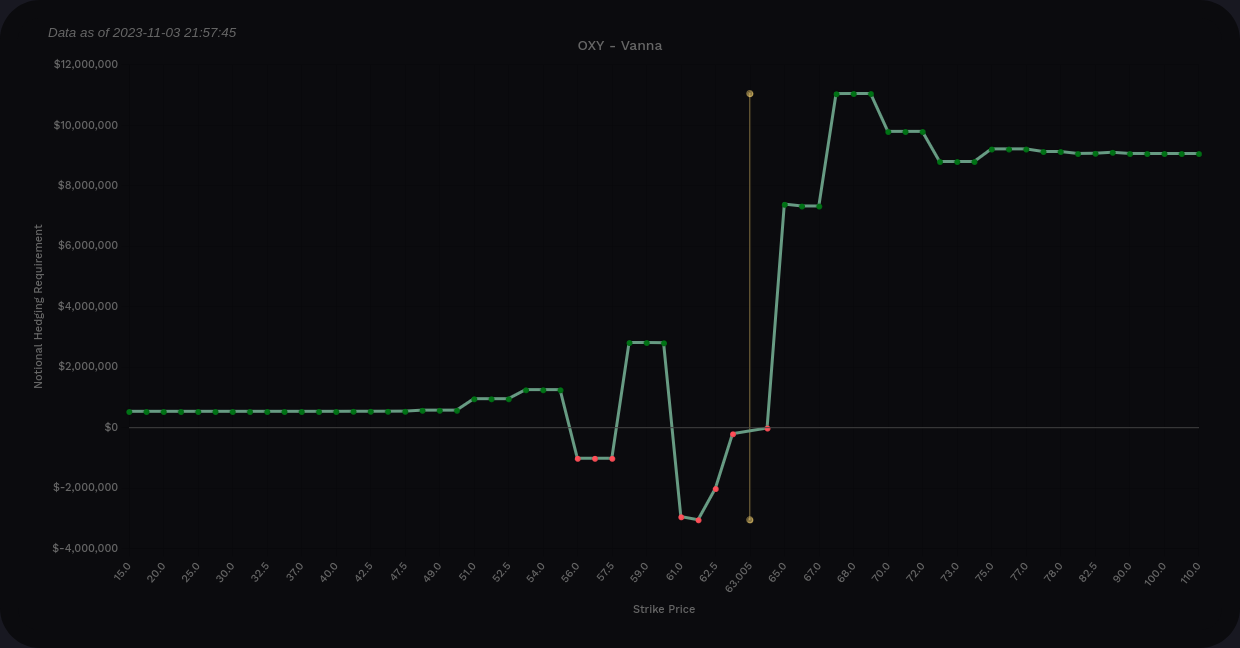
OXY aggregate vanna charts from Volland
I'm really focused on the 12/15 expiration for OXY since that's where I'm doing most of my trades right now. Let's have a look at those charts.
Vanna is still positive here, but $65 looks like our top for now. There's a small amount of support to the downside in the $60's and not much below that.
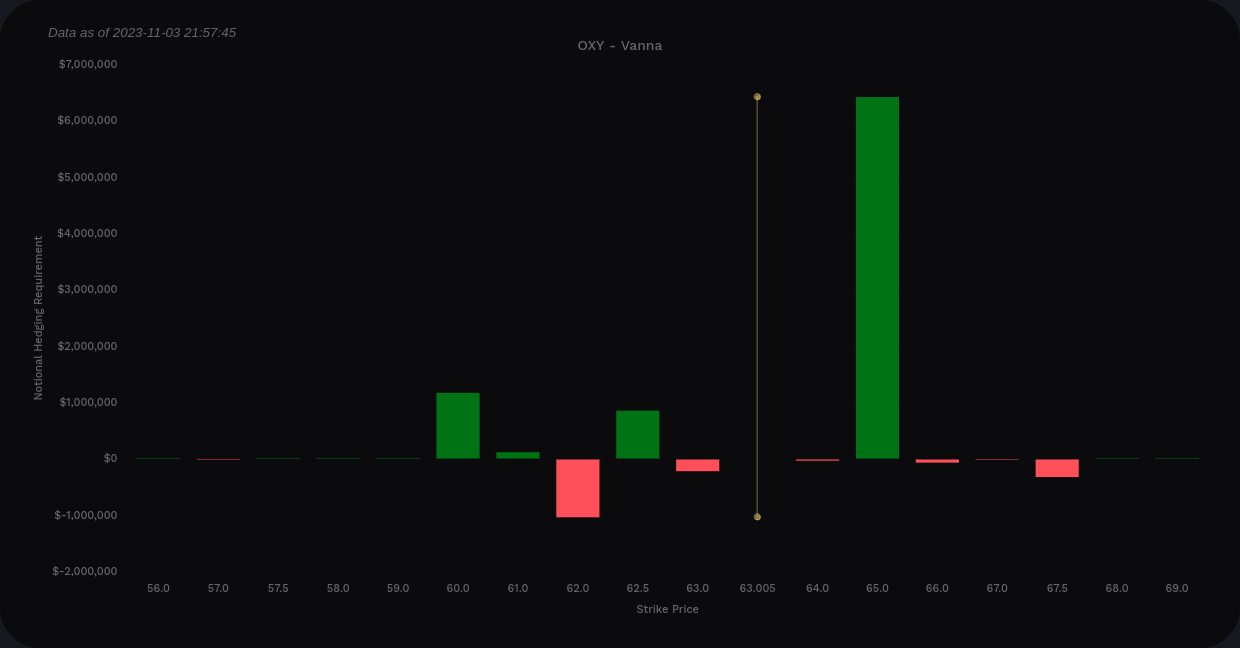
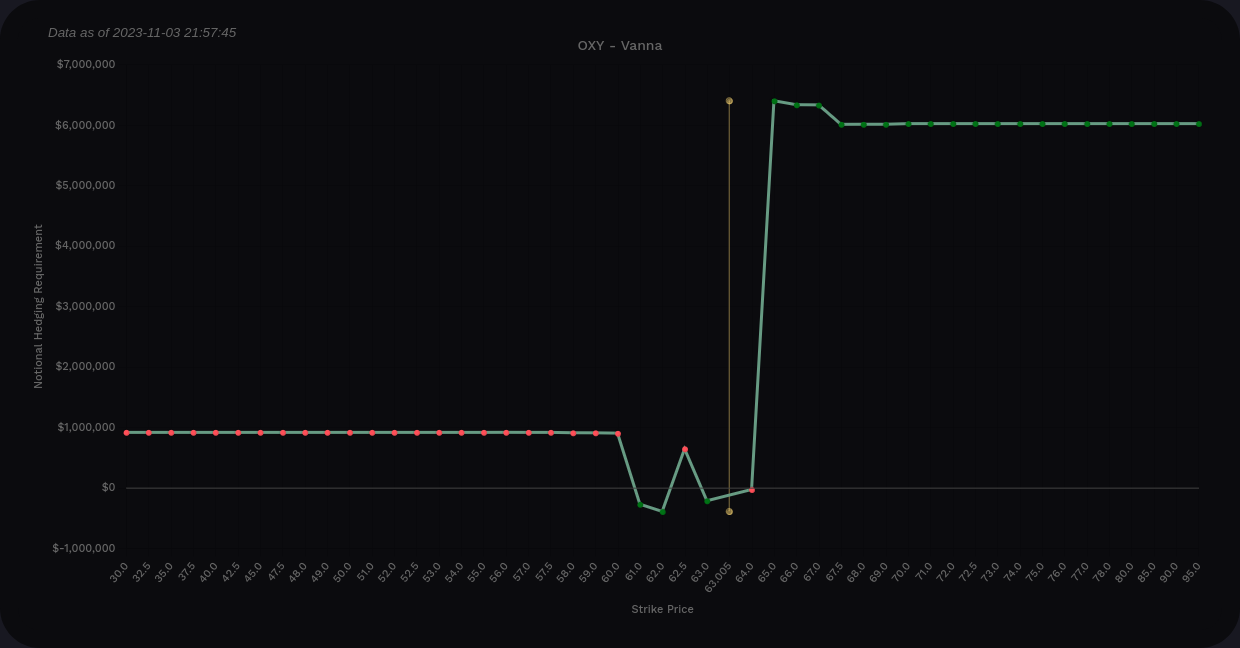
OXY vanna charts from Volland for today through 12/15 only
I'm thinking $60-65 might be the edges for OXY through 12/15, but let's get more data.
Chart
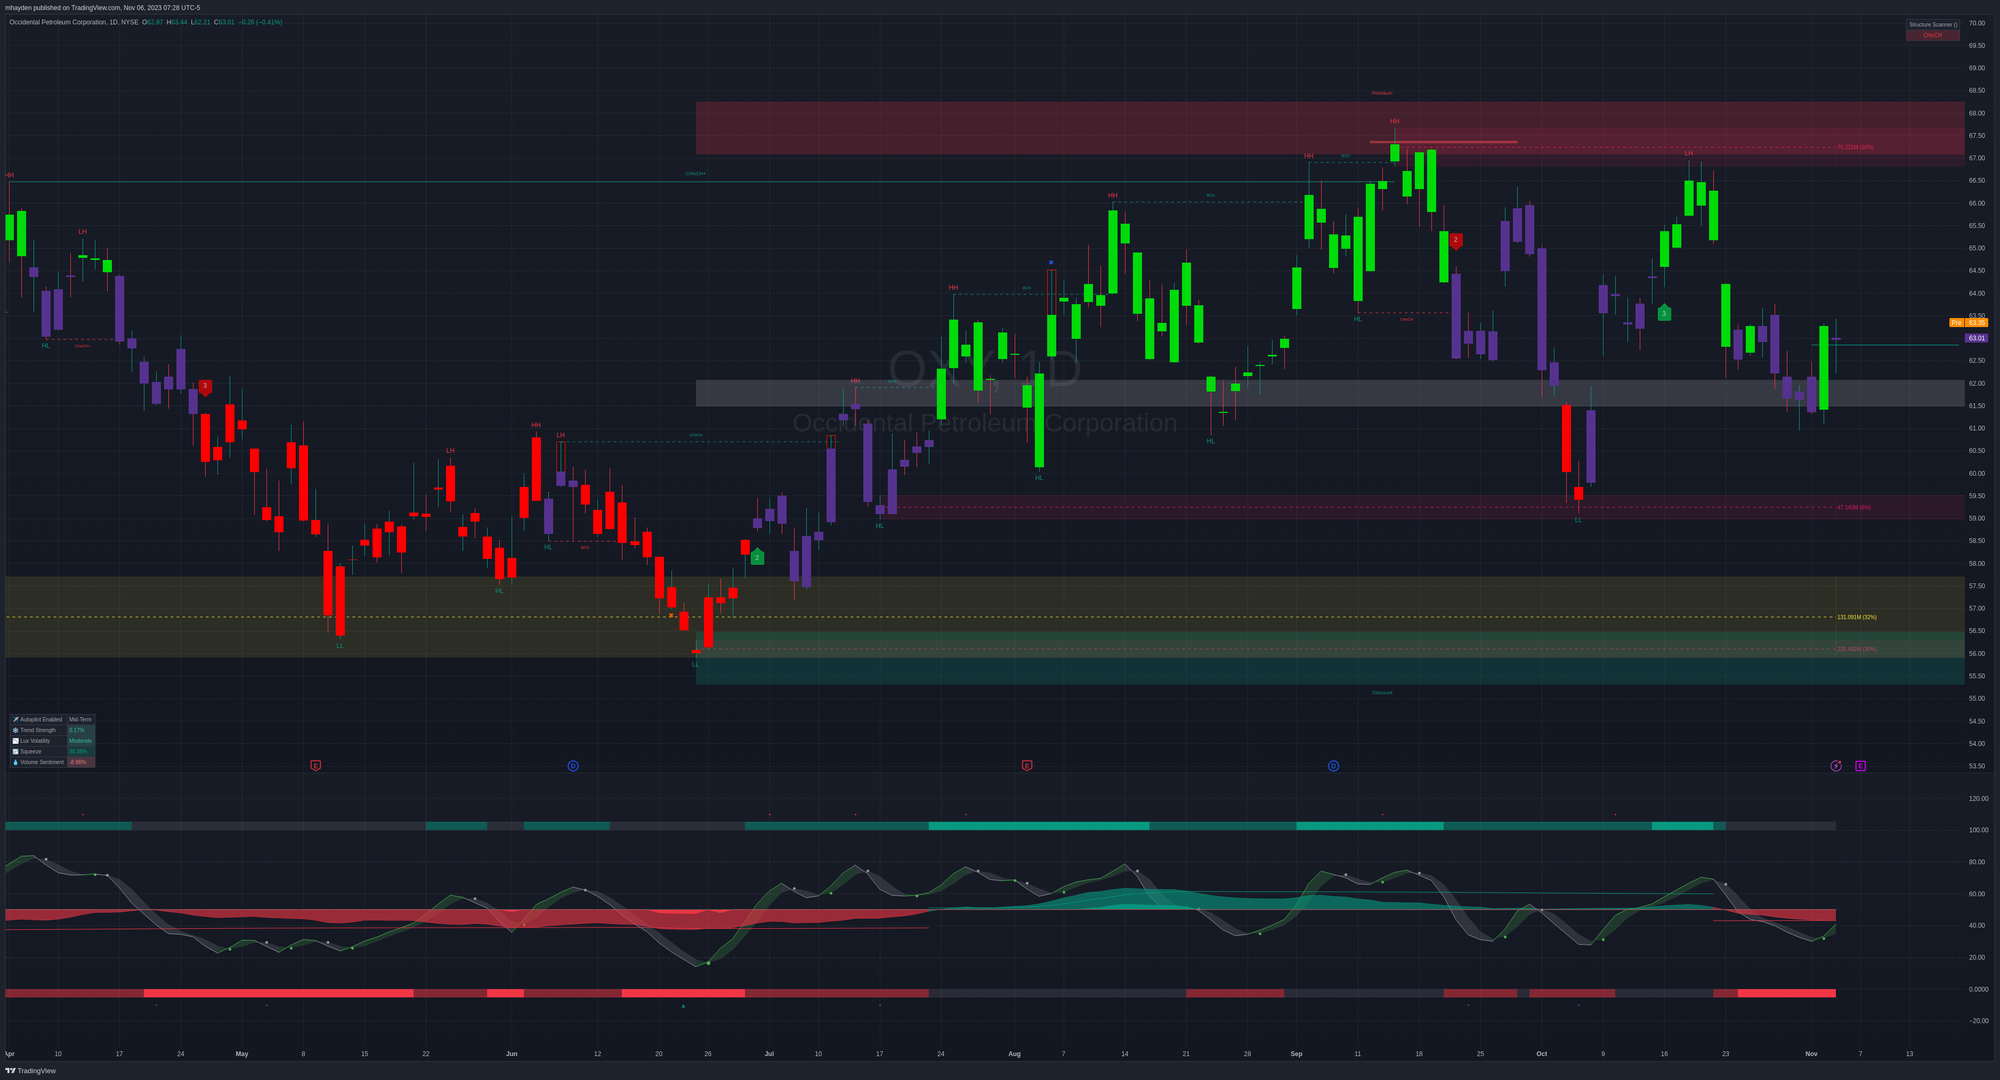
OXY sits just above the equilibrium in the premium half of the price range right now. Previous order blocks from the daily time frame provide boundaries for price around $67 and $59.50. This lines up really well with vanna and I like to see these correlations!
OXY made gaps all over the place recently. It made so many that I've just given up on marking them on my charts. 🥵
Let's do a bullish/bearish breakdown starting with the bullish items:
- OXY made a bullish fair value gap on Friday just below $63 and that could provide support for an upward move. It could also be waiting to be filled for a move higher.
- Thursday was a great day but Friday seemed to cut the rally a bit short with a doji candle with huge wicks.
- The oscillator (bottom of the chart) shows a bullish signal on the hyperwave and the wave is headed up sharply. I'd like to see this continue.
- OXY has a big gap around $64.50 that could be filled and plenty of room to run up to $67.
How about the bearish side?
- OXY's money flow is still quite negative and hasn't moved much yet.
- Although Thursday signaled a strong turnaround, Friday brought that into question.
- The recent dip wasn't deep enough to give OXY room to run like the mid-June dip. Sure, OXY could push through $67 but the chart and vanna data argues against that.
Thesis
OXY's IV suggests a +/- $4.10 move between now and December 15th. If we factor that into the current price of $63, we're looking at a range from $59-$67. That fits within the chart's parameters as well as the vanna data. This feels like a good short strangle opportunity for me, but the premium isn't superb.
I had some OXY short strangles on recently that netted some small profits and I might consider another one through earnings that expires on 12/15 to give myself a little more time. Again, premium isn't terribly high here, but the expected moves aren't too big either.
Good luck to everyone today! 🍀


Discussion