Let's have a look at the Russell for January 3
The Russell index lags the pack, but will 2024 be its year to shine? ✨

The Russell index, or more specifically, the Russell 2000, is a basket of companies with smaller market caps. This index received a lot of attention lately as it has lagged the S&P 500 and NASDAQ indexes by a wide margin. High interest rates make borrowing money a challenge for these smaller companies, but that could be turning around this year if the Fed makes meaningful interest rate cuts.
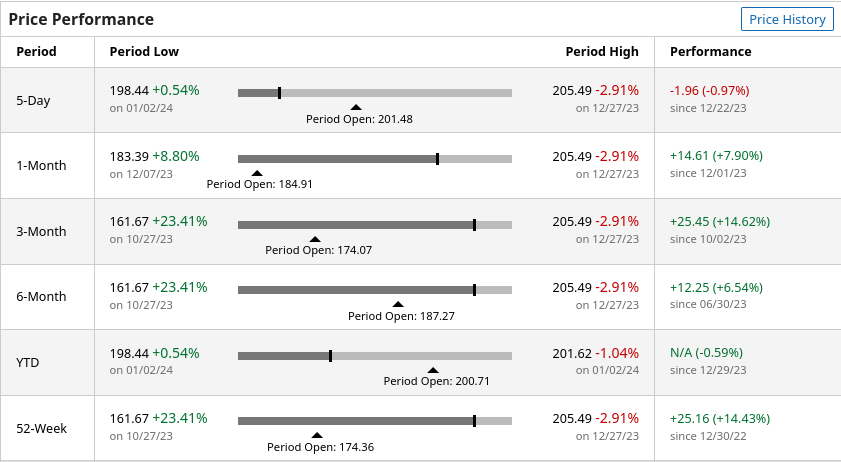
The performance of the index has been fairly good over the past year, but nothing like the other big indexes:
All investments come with significant risks, including the loss of all capital. Please do your own research before investing, and never risk more than you are willing to lose. I hold no certifications or registrations with any financial entity.
Let's dig into the Russell index to make some predictions going forward.
Vanna
We can examine vanna for two widely-traded ETFs based on the Russell index. IWM is the most heavily traded one and then there's TNA, which is a 3x leveraged Russell ETF. Let's start with IWM.
IWM has an overall positive vanna chart, which is bullish provided that implied volatility (IV) remains the same or decreases. The curve shows some negative dips on both sides of the current price (around $199 this morning). These dips often repel price, so we might be locked into a range for short period.
On the bar chart, $220 sticks out as the biggest target for price if it moves up. Some other targets appear around $205 and $215. $170 shows up as a big support level to the downside with some other levels in the $180s.
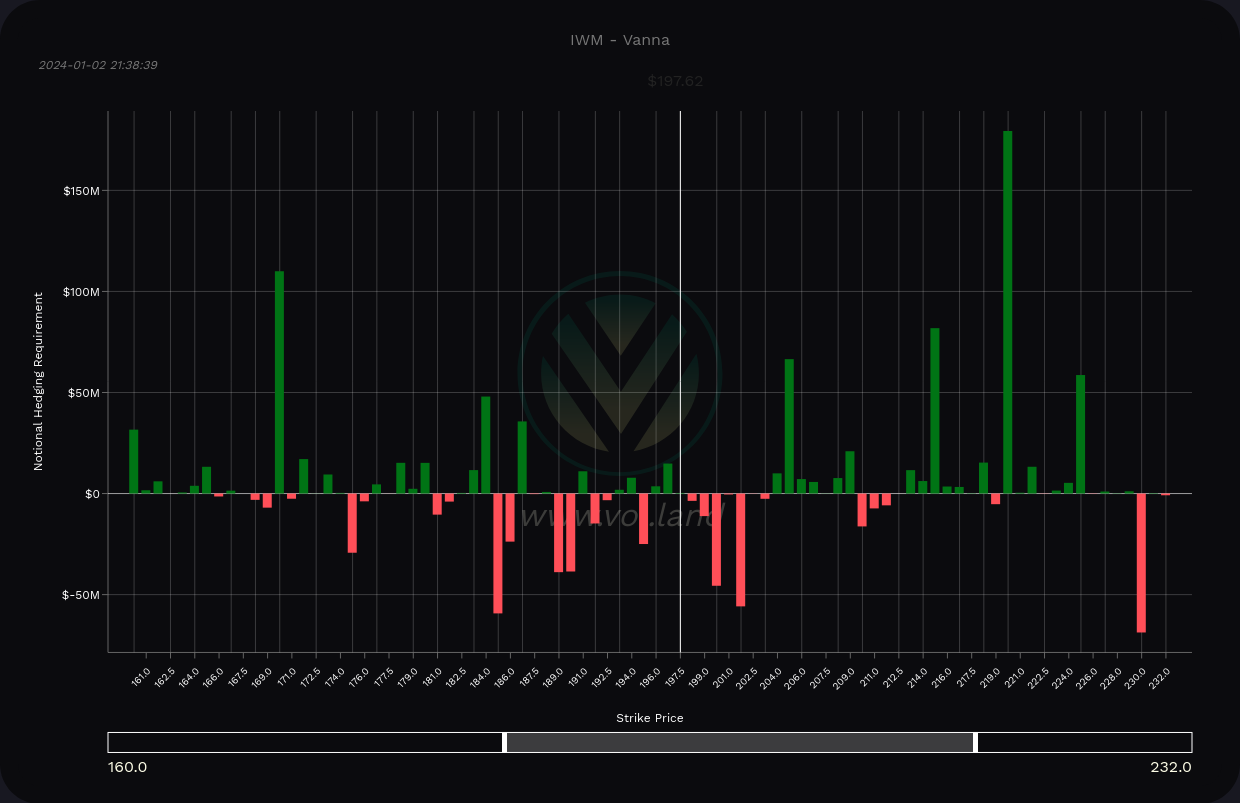
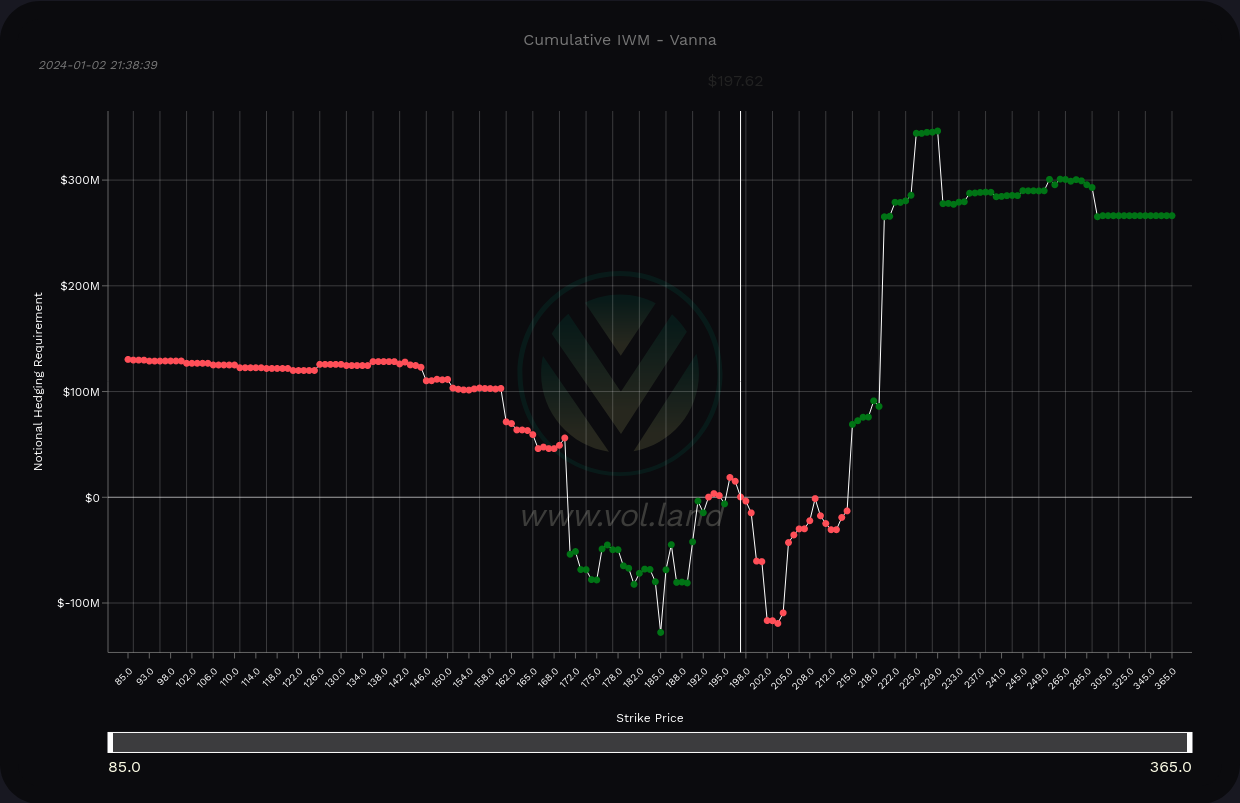
IWM vanna for all expiration dates
At this point, I'm thinking our wider range is $170-$220 with another range likely from $185-$205.
Gamma
Volland offers delta-adjusted gamma charts and these flip the gamma above the current price so that you can read this chart as "green is buying, red is selling" from a dealer's perspective.
Dealers apply selling pressure strongly at $205 and $220. Vanna might pull us near $205 (remember that vanna needs room to operate) but gamma could prevent us from climbing over without significant volume. We have plenty of buying pressure from gamma from $185-$202, but these lines are relatively small.
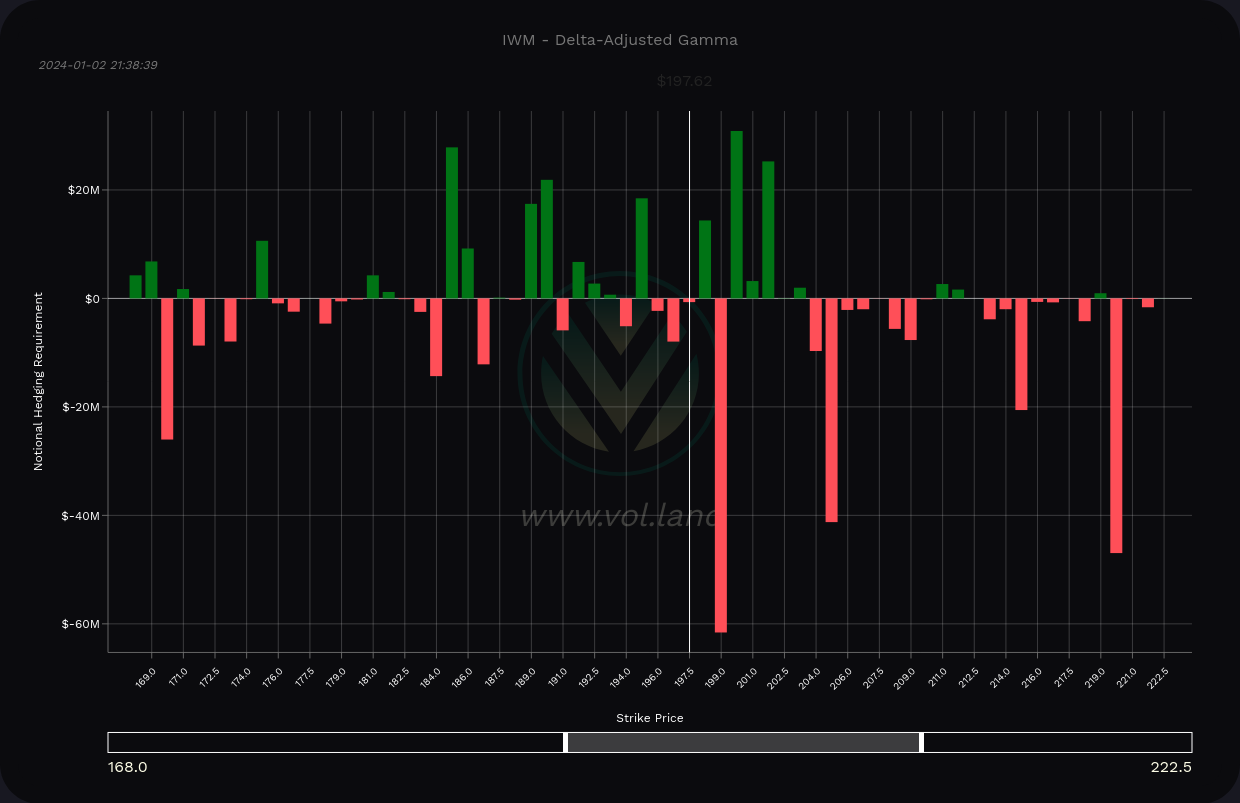
Paired with the vanna data, I'm thinking $185-$202 might be a good range to trade so far.
Institutional trades
Volume Leaders charts show institutional interest in stocks and ETFs. Although it doesn't tell us the directionality of the trades, it does tell us when they happened and how large they were.
IWM has some big trades, including the 8th and 17th biggest, as we came out of the October lows. The 16th biggest trade hit recently at $201.62 for exactly four million shares. The price continued trading down through that level.

So now we need to think: a massive trade with an even number of shares is often an opening position for institutions. Typically they take profits with odd numbers of shares since they're pulling off a certain percentage of their bet. Are they potentially opening up a new long position here? A new short position?
We have a decent amount of volume up around the $200 level, so it's not like we've completely outrun the volume levels. However, $200 is awfully close to our limits on the DAG and vanna charts. That's something to remember.
How about TNA, the triple leveraged Russell ETF? IWM's $200-ish level is close to TNA's $39-$40 level. There's lots of volume for TNA up here including the biggest institutional trading level at $41.60.
Institutions made some big trades coming out of the October lows, including the 15th biggest trade of all time. However, their trades recently have been relatively small. Institutions could be taking some profits up here or they could be adding onto their position. I often see a pattern where institutions nibble on a stock and then make a massive trade. The big trade hasn't shown up here yet.

Sometimes institutions like to hide their trades in less liquid ETFs. Vanguard's VTWO ETF shows a lot of trading here at the highs, including the #2 trade of all time.

Charts
IWM fell into a channel in the middle of 2022 and has been stuck there since then. It topped out near $200 three times in a row and then broke that level recently as it came out of the October lows. It also made a lower low.
The majority of the volume sits around $173 with 70% of the total volume showing up between $170 and $188.
RSI has broken through the top of the channel and appears to be cooling off a bit. The MACD looks string with both lines over zero and a green histogram. However, I'd like to see the latest bar on the histogram climb over the previous one.
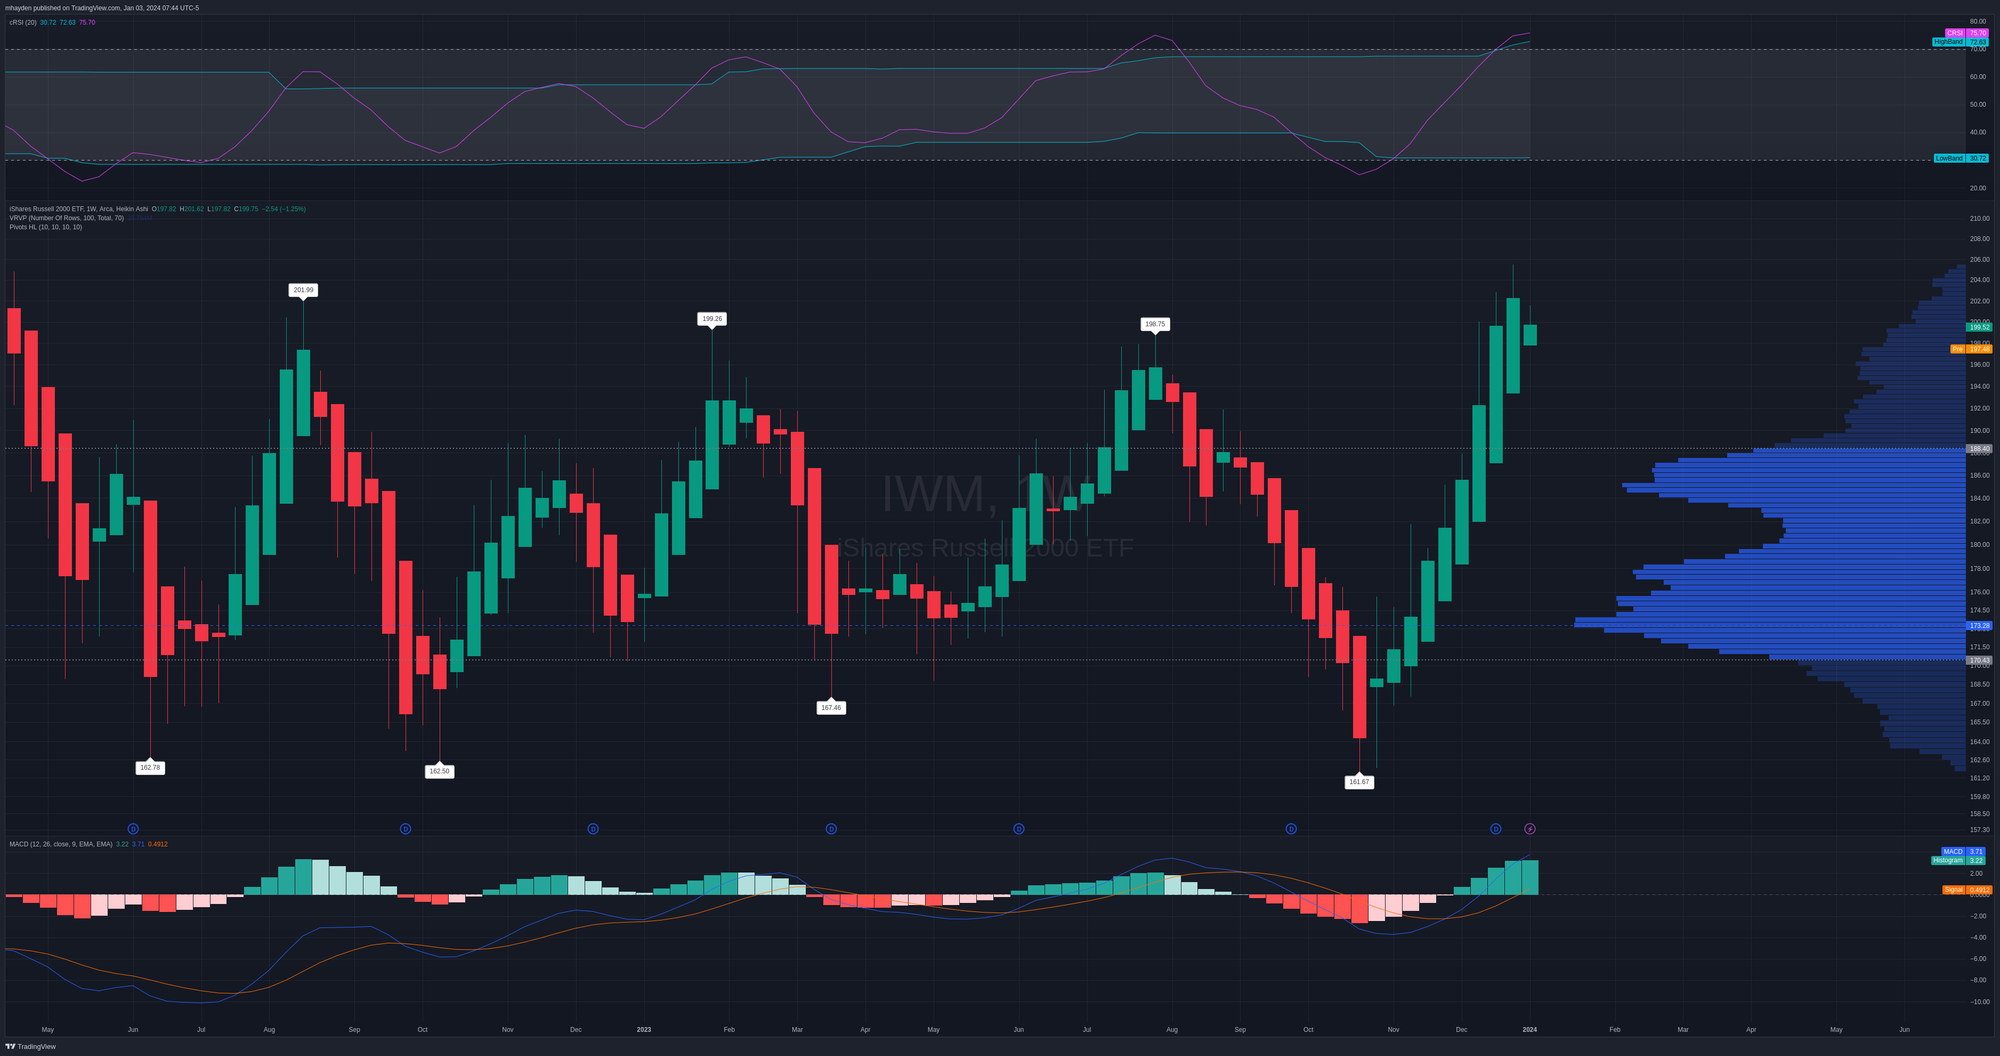
If IWM does come down for another oscillation, the $181 level will be a big test. That's a low volume area which could serve as resistance and help IWM make a higher high. There's another low volume area around $193 that might be a smaller resistance area.
Thesis
At first glance, the Russell index looks like it might be a breakout star of 2024. However, the data from gamma and vanna charts suggests that $202-$205 might be a tough area to break through. Institutions are making some large trades at the highs, including some that are likely opening trades (which could be short or long). This often precedes a big change in direction.
Based on all that data and IWM's stock chart, I get the feeling that we will see another wave down into the channel but the odds are that we see a higher low this time around. Much of this depends on what the Federal Reserve does with interest rates.
I've been trading the Russell via TNA, the triple leveraged ETF. I sold three 2/16 $33 puts and I'm looking to exit those with 50% profit or look to roll them at 21 DTE. $33 on TNA is somewhere in the $180's on IWM.
TNA has great options premium, but it swings wildly. IWM has a little less options premium, a little less price swing, but it eats up a lot more buying power in my account.
Good luck to everyone today! 🍀


Discussion