SPX analysis for December 12

We get CPI data today and the Fed announces interest rate changes tomorrow. How is SPX set up to handle this data? 🔎

Happy Tuesday! 🌄 Join me for a deep dive into some SPX data so we can get an edge on the markets. There's a ton of data out there about SPX and SPY, so let's get after it.
🚨 We get CPI data this morning and the Fed announces interest rate changes tomorrow. Be careful!
All investments come with significant risks, including the loss of all capital. Please do your own research before investing, and never risk more than you are willing to lose. I hold no certifications or registrations with any financial entity.
Here we go!
Vanna
Volland offers up data for SPX and SPY, but I normally look at SPX since there's a lot more volume and the levels are more granular.
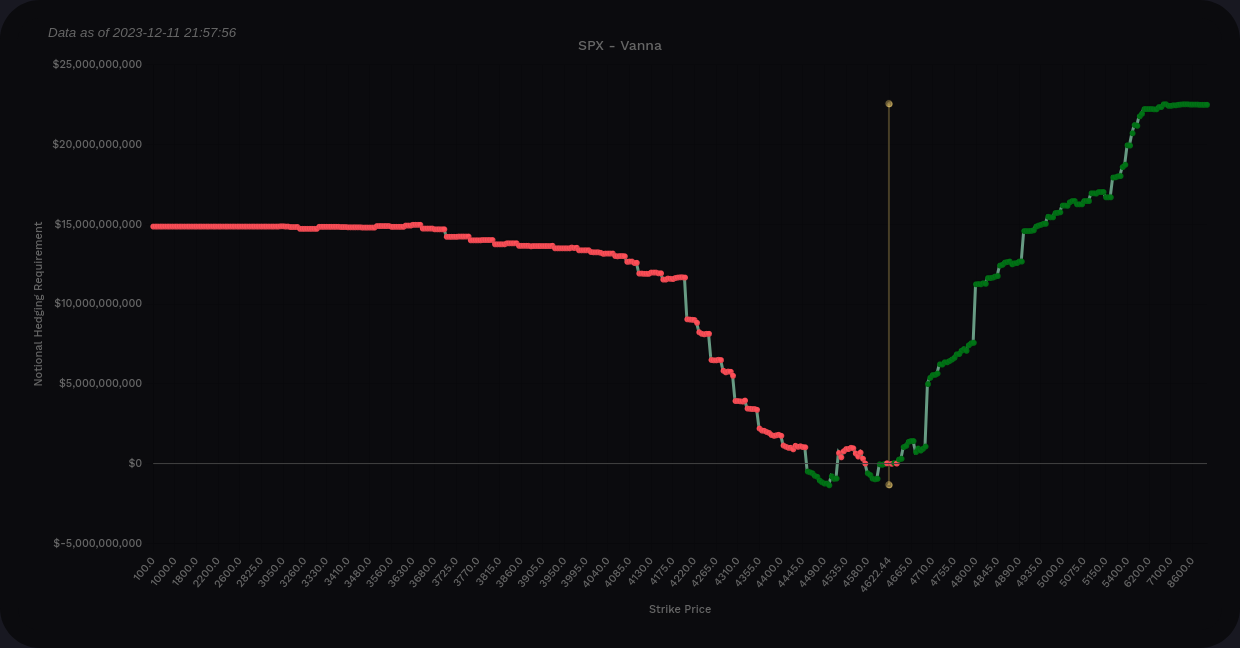
SPX has a great vanna profile for bullish traders. There's rising positive vanna above price and plenty of it below price, too. There are some negative drops around the current price, especially to the downside, but the positive vanna certainly outweighs those negative levels.
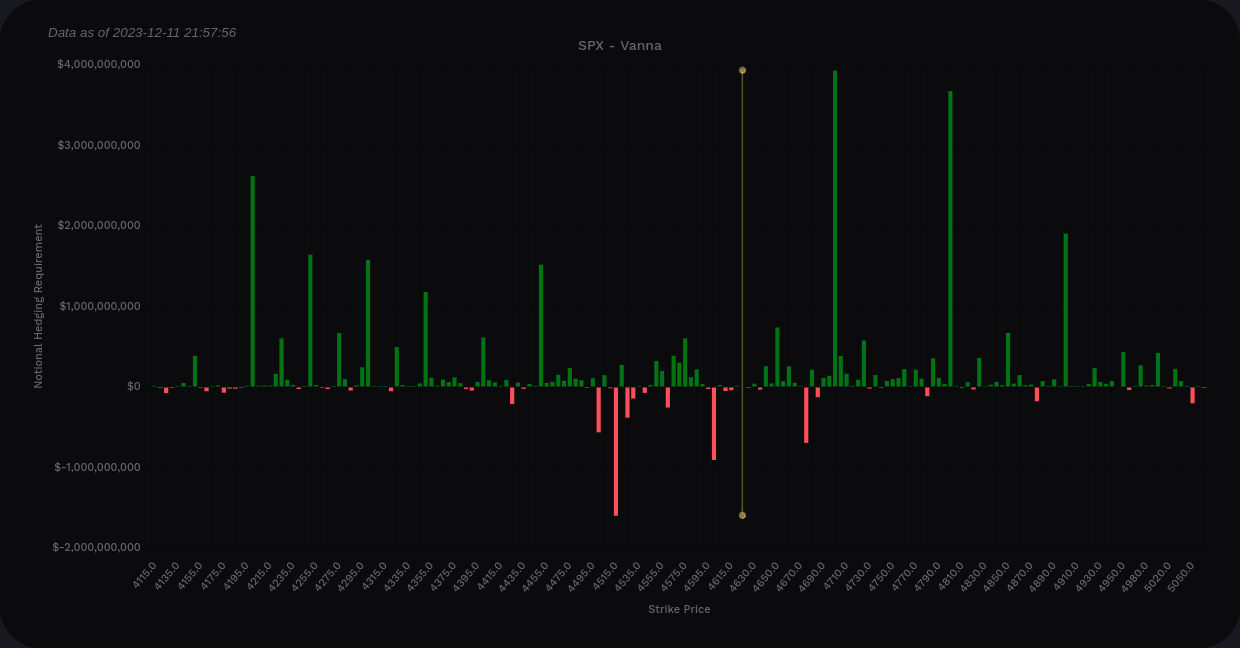
SPX vanna across all expiration dates from Volland
As I look at the bar chart, some levels really stick out here. The biggest positive levels sit at 4700 and 4800. One thing I've noticed over time is that 4700 has loomed large above price for at least 2-3 weeks. The growth of 4800 is a fairly recent development.
To the downside, 4515 is our biggest negative vanna level. I see this as a repellent level if price moves down, but I'm still learning how negative levels affect price when price moves down towards them as implied volatility (IV) increases. The 4450 level looks like our first big support level, followed by support levels on 50 point increments from 4350 to 4200.
So far, I'm thinking that vanna might be a magnet for us to 4700 or perhaps 4800 if IV remains calm or continues to drop. VIX futures sit around 12.95 this morning and they're ticking up slightly in the pre-market. A VIX spike could send us further towards the 4450-4500 area.
Does SPY correlate this data? It does!
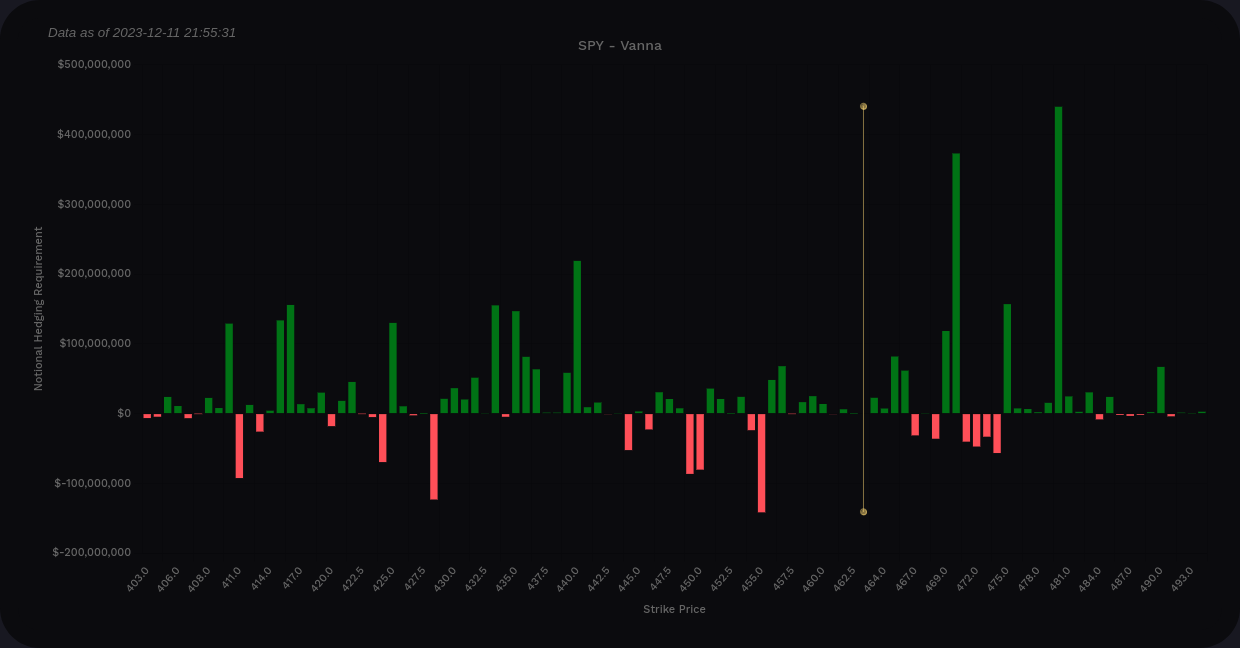
The $470 and $480 levels show up in SPY and support shows up around $440.
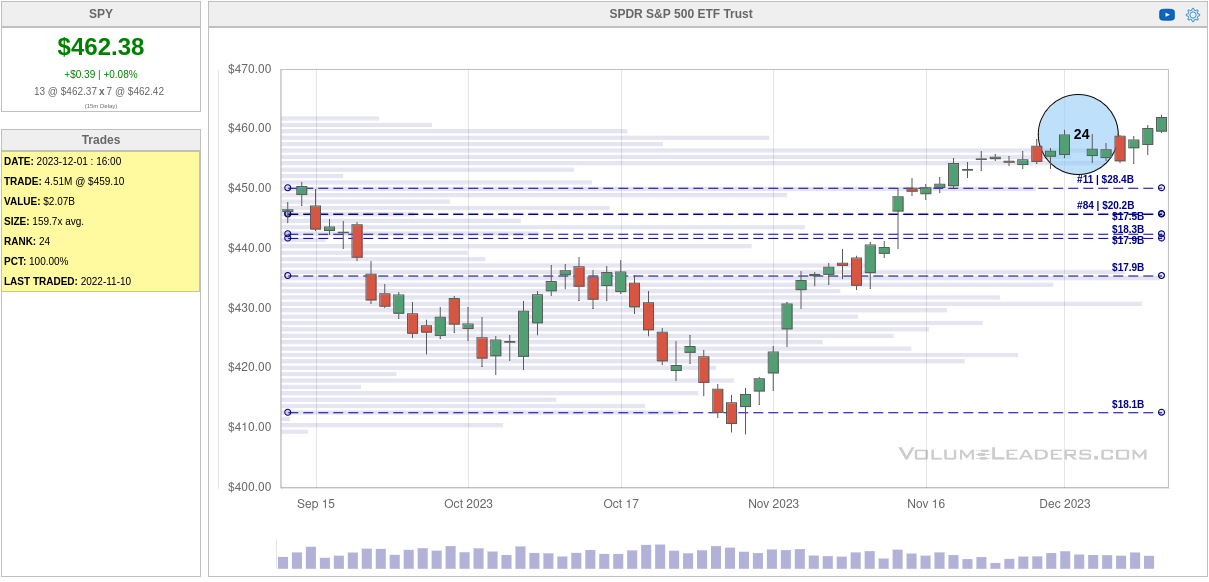
Institutional trades
Let's shift over to SPY on Volume Leaders to see what traders with deep pockets are doing with it. This is a quiet chart with only a #24 trade at $459.10 on December 1st. The share count is odd and the site owner suggests that's likely not an opening trade since those tend to be even numbers of shares.
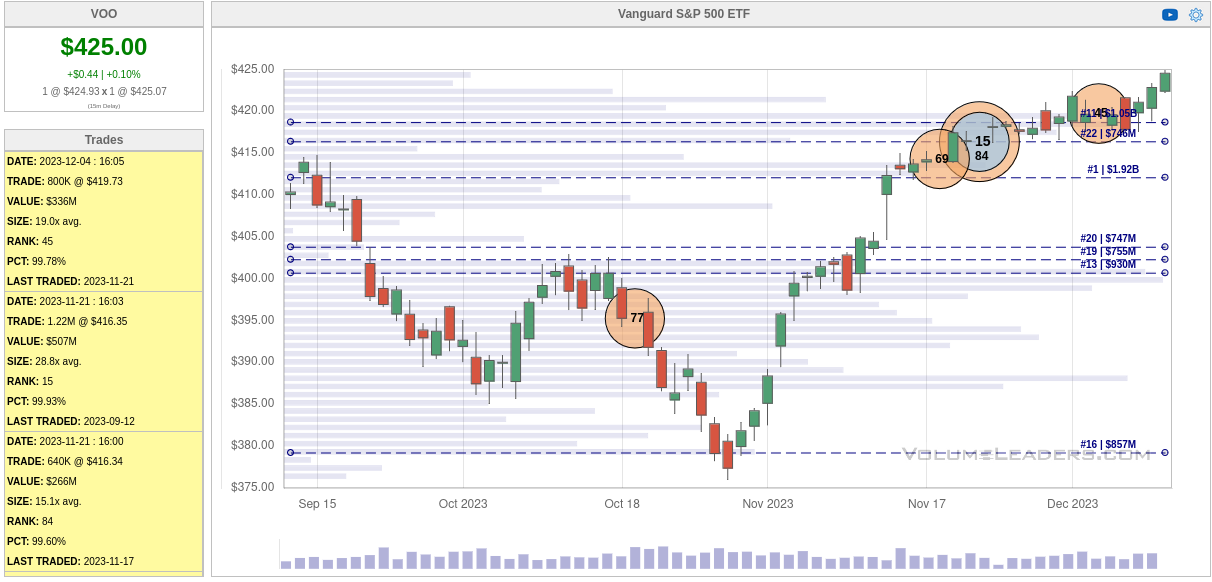
Institutional traders avoid SPY since it's closely watched and sometimes they run for the names which are less actively traded. VOO shows a different picture entirely. We have some big trades happening in the same price area and around the same times as SPY's #24. Although SPY doesn't show this as a big institutional level, VOO's chart certainly shows it.
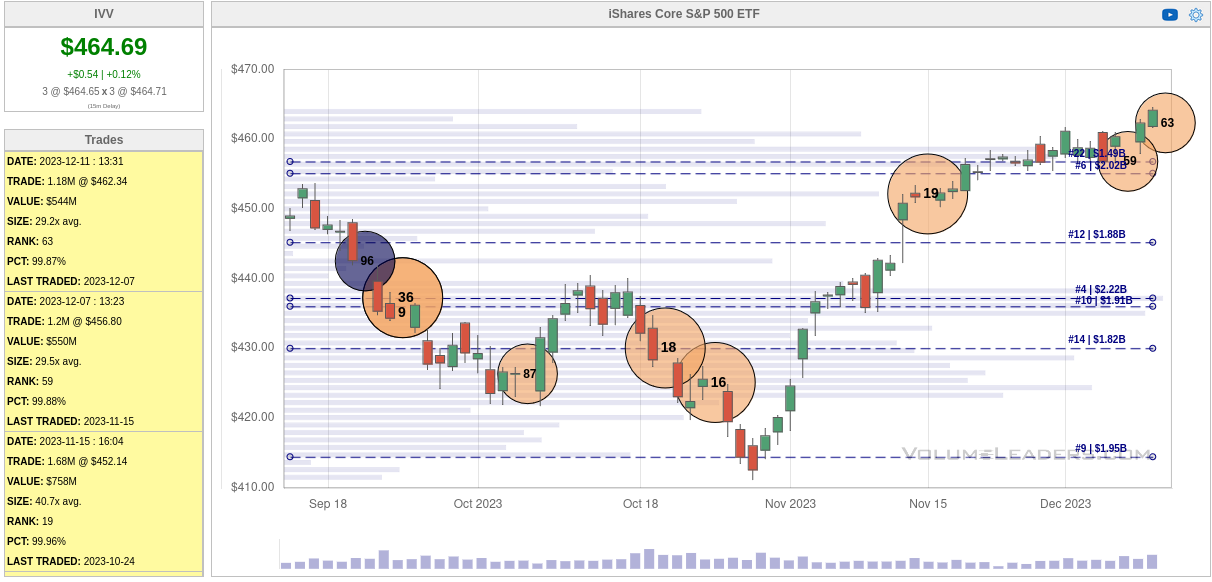
How about the Ishares SPX ETF, IVV? Wow, look at these trades! Institutional traders are pretty active here in November and December, especially around these high price levels.
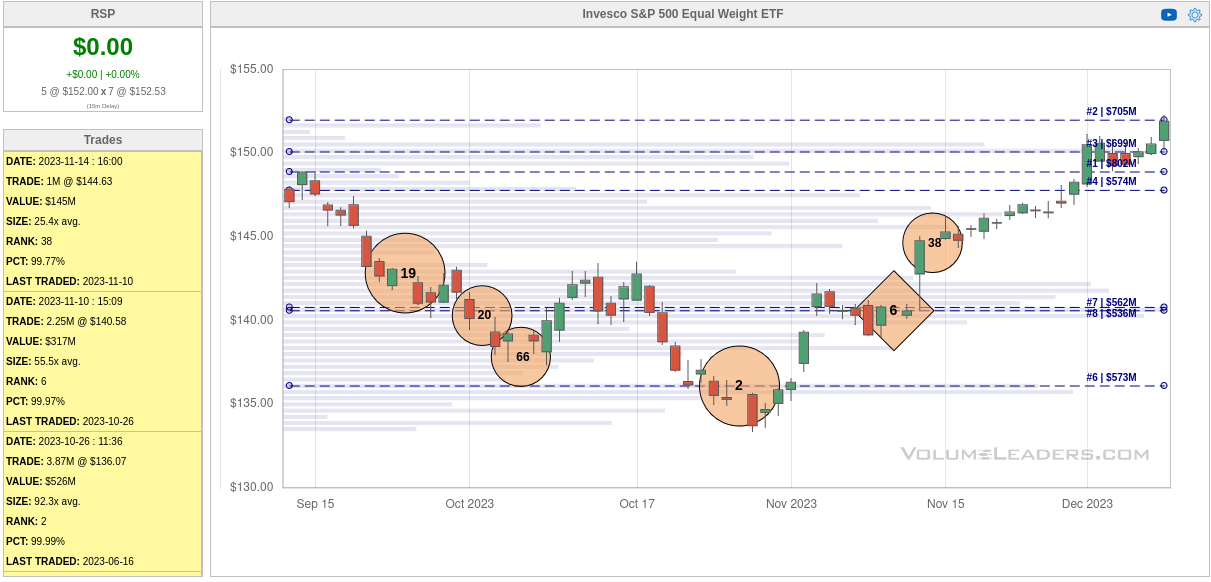
SPY is market cap weighted, which means the largest companies by market cap get the most exposure. However, there's RSP from Invesco which has all of the SPX components at an equal weight. This is a much less volatile version of SPY and it's not traded as often, so institutions love to "hide" their big trades in ETFs like these.
The #2 trade came in at the lows in October and #6 hit just before the crazy rise we've seen recently.
What do all of these charts tell us? These current levels are seeing active volume from institutional traders, but it's difficult to tell which way they are leaning. Could they be opening new long positions? Are they taking profits? Are they opening new shorts?
I'm not sure here yet, but I'm keeping my eye out for trades that fall in the top 10 biggest trades on these because it could be a signal for a "send it" moment where institutions make their final moves before the market changes direction up or down.
Charts
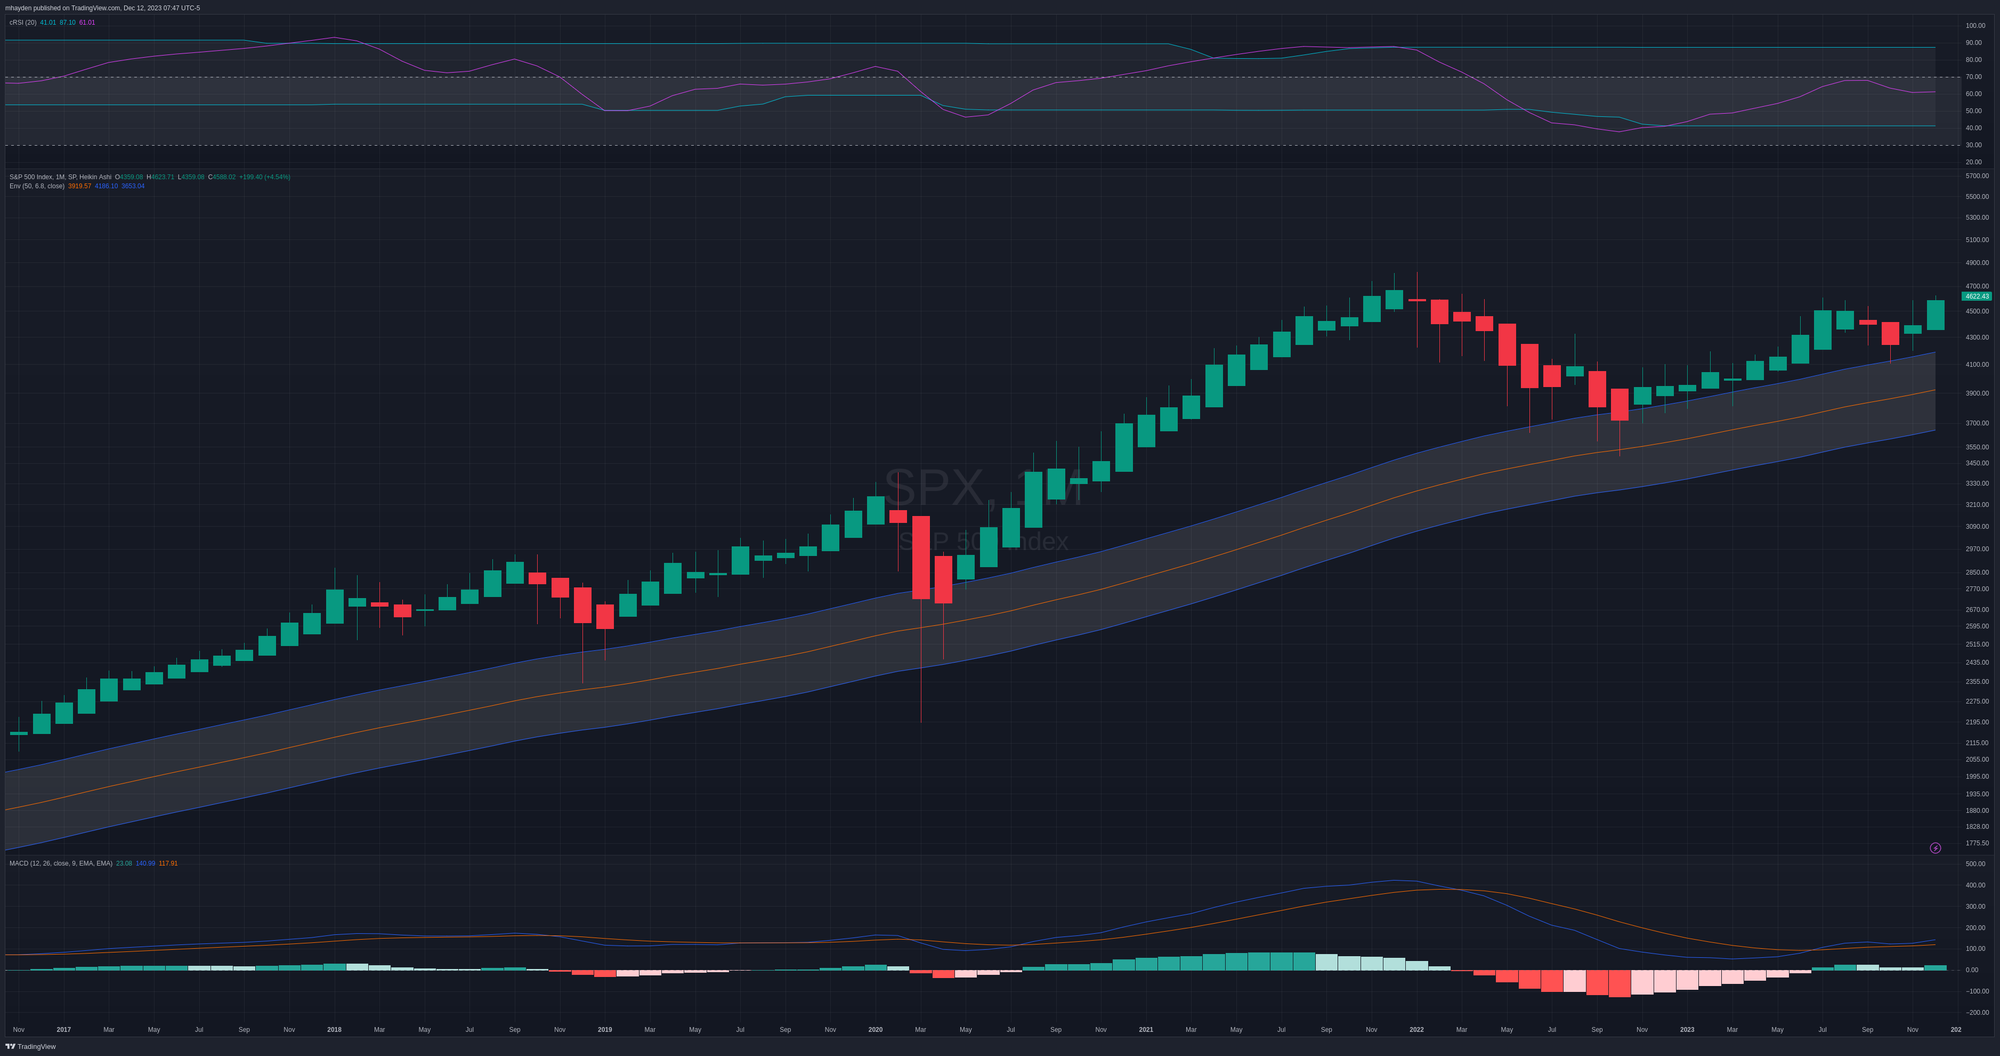
SPX looks quite nice on a monthly chart. The RSI indicator at the top shows we're about halfway between the top and bottom of the channel with room to move in either direction. We just made lower lows and lower highs on the RSI, which is a bit worrisome.
I'm using Heikin Ashi (HA) candles here as they are fantastic at highlighting trends over time. We see wicks dropping into a 50-month moving average envelope (6.8% wide) but then they bounce right back out. We have one bullish candle with no bottom wick so far and that's a good sign.
MACD looks strong as it's over zero and the fast line is moving away from the slow line (indicated by growing green bars on the histogram). It looked like we might catch a bearish cross in October, but we bounced back up. That's a bullish sign for me.
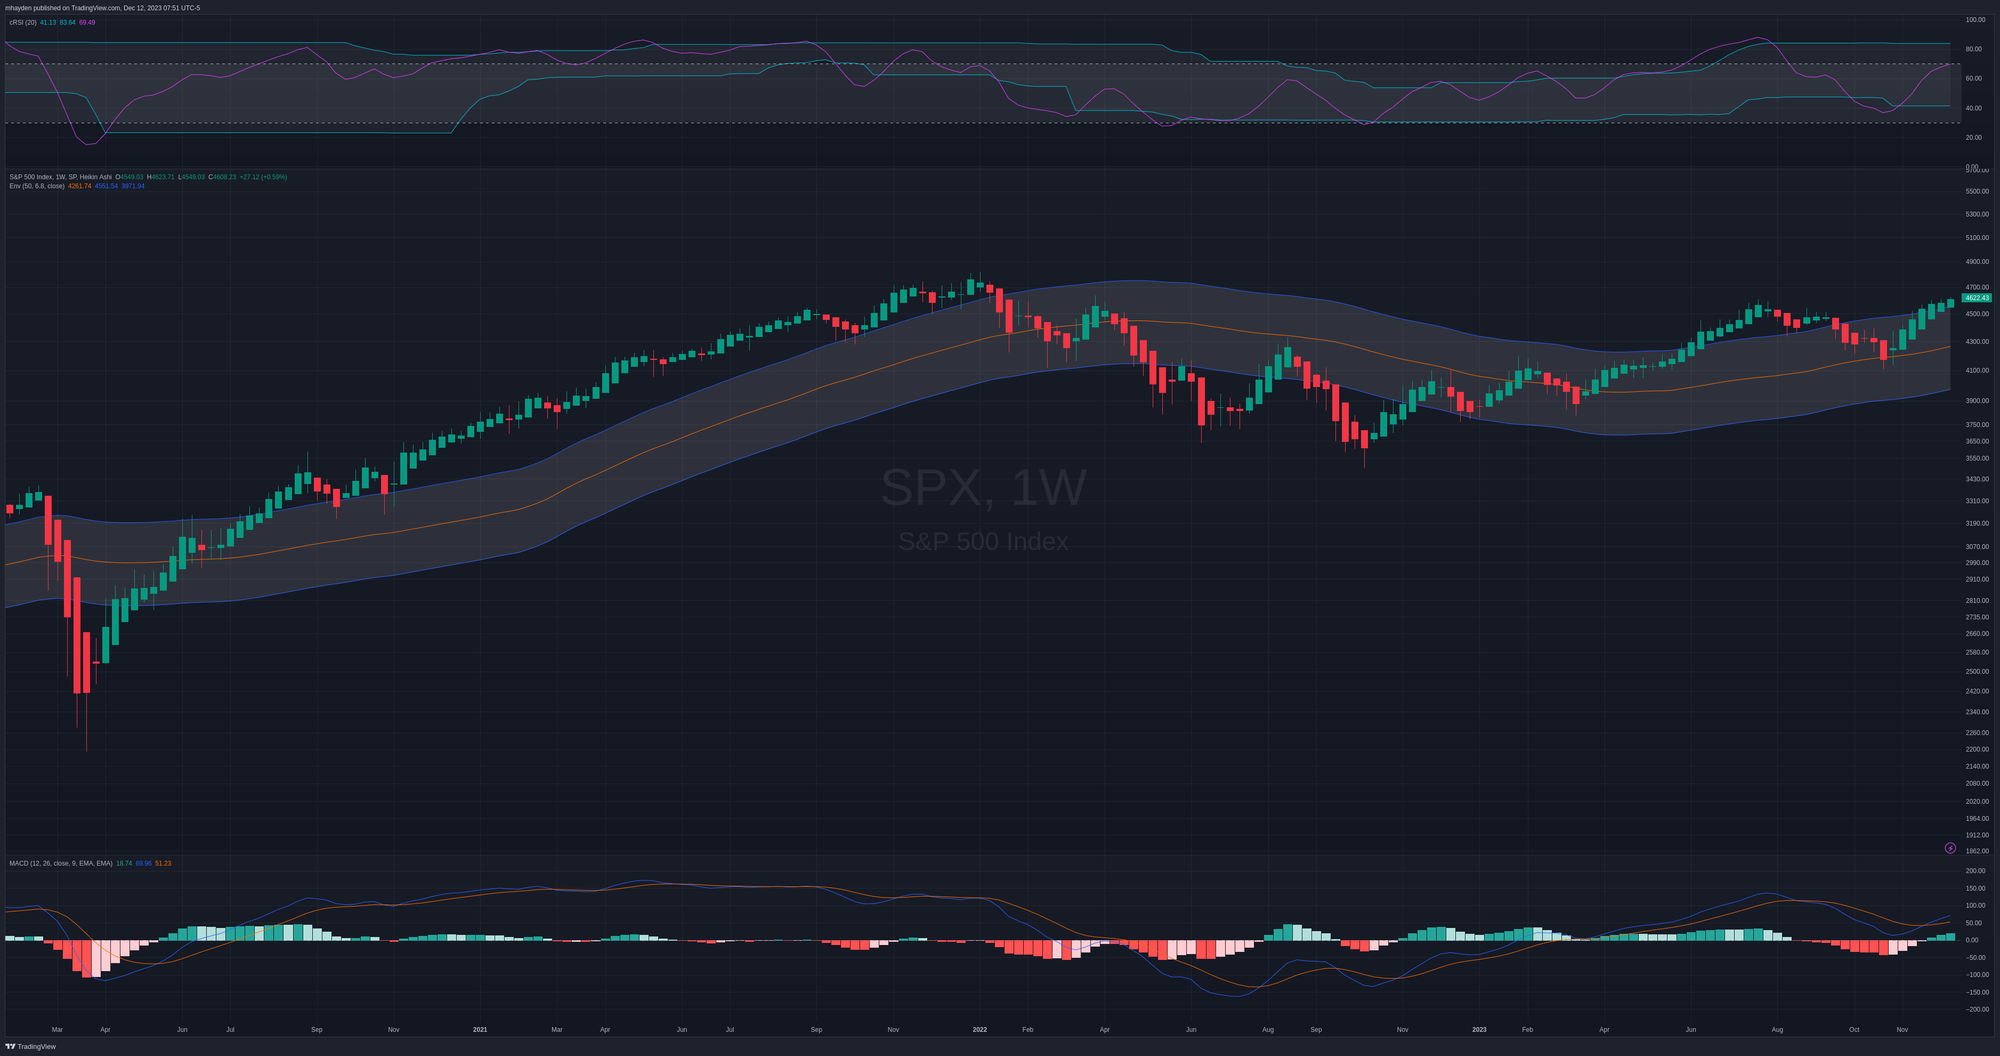
SPX's weekly chart since the COVID low looks stronger than 2022 for sure. We rose above the 50-week envelope in June and tested the 50-week line on October 23. Since then, we have six bullish HA candles with no bottom wicks. That's a sign of a strong rally.
RSI is running a bit warm but it still has room to run upwards in the channel. MACD shows a bullish cross back on 11/20.
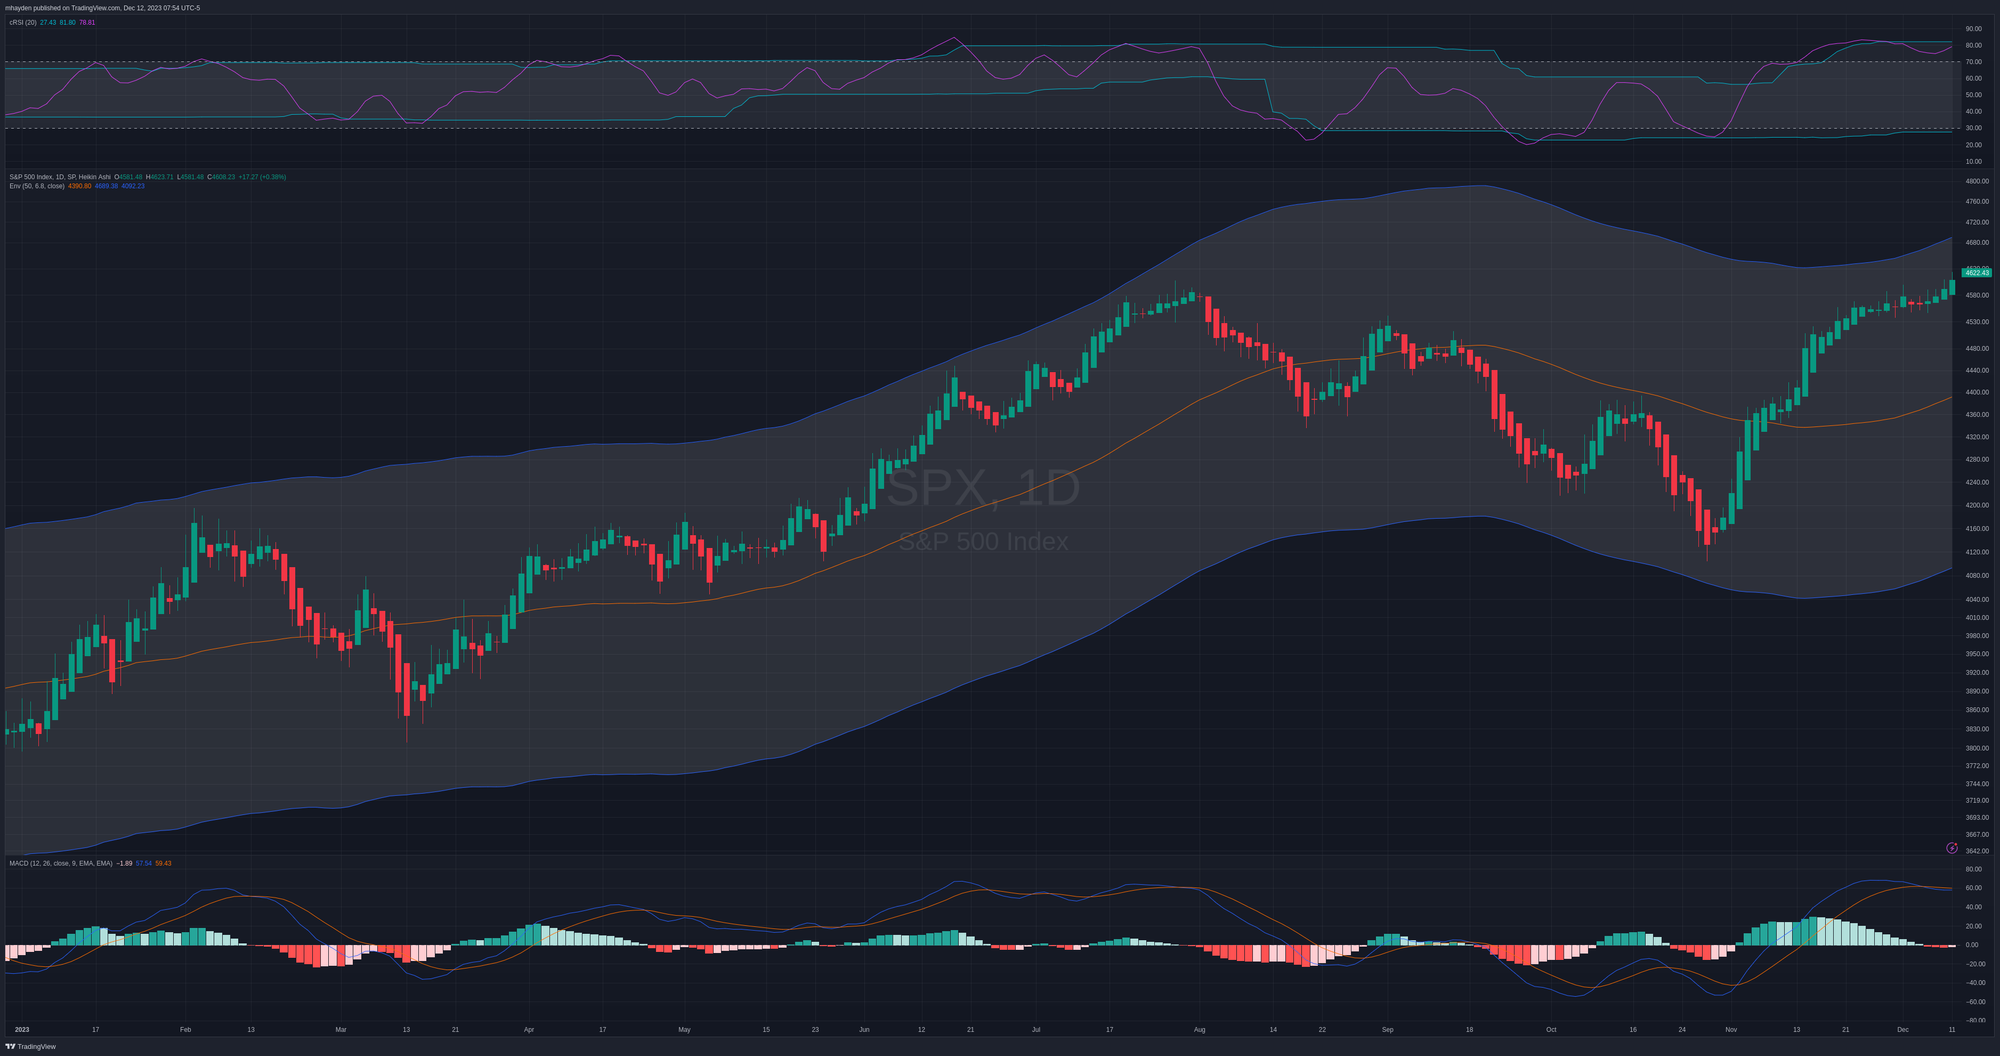
If someone showed me this daily chart of SPX and I had absolutely no context about anything happening in the markets, I'd say it's looking strong but running out of fuel. It needs a break.
RSI is approaching the cop of the channel again after breaking out of the channel back in early November. MACD is well above zero, but it recently made a slight bearish cross. The MACD histogram shows a higher high and higher low recently. Both of these give me a bullish sentiment.
Thesis
SPX looks strong and vanna suggests 4700 is entirely possible soon. The chart also suggests strength on all time frames, but the daily says we likely need some consolidation. The top of our 50-day moving average envelope sits around 4700 now.
If we move down, 4400 is where we pick up vanna supports as well as the 50-day moving average. That's also an area where we have a lot of institutional trading happening.
I have several short SPY puts (long delta bullish trades) on the board for various weeks in January mainly focused on the $438-$442 area. If SPY corrects or takes a breather down to the $440's, I'd be glad to pick up some shares there.
I also sold a $460 put for 12/15 because sometimes I like to live dangerously. 😄 However, the 4700 vanna level is strong and I'm looking for a drop in IV after we get CPI today and an interest rate decision tomorrow.
Good luck to all of you! 🍀
Discussion