SPX analysis for January 4
SPX finished yesterday in a precarious position. Will we see a retest of previous highs or another move towards the all time high? 🎢

The first trading days of January are certainly a departure from the long rally at the end of 2023. Where might we be going now?
All investments come with significant risks, including the loss of all capital. Please do your own research before investing, and never risk more than you are willing to lose. I hold no certifications or registrations with any financial entity.
Let's dig into some data!
Vanna
As usual, my first stop for analysis is a trip to Volland for some vanna charts.
Let's examine the curve chart first. We have positive vanna ramping up on both sides of the current price and that screams bullishness to me as long as IV is calm or decreasing. There's a small dip into negative vanna territory just above the current price but that's very minor relative to the rest of the chart.
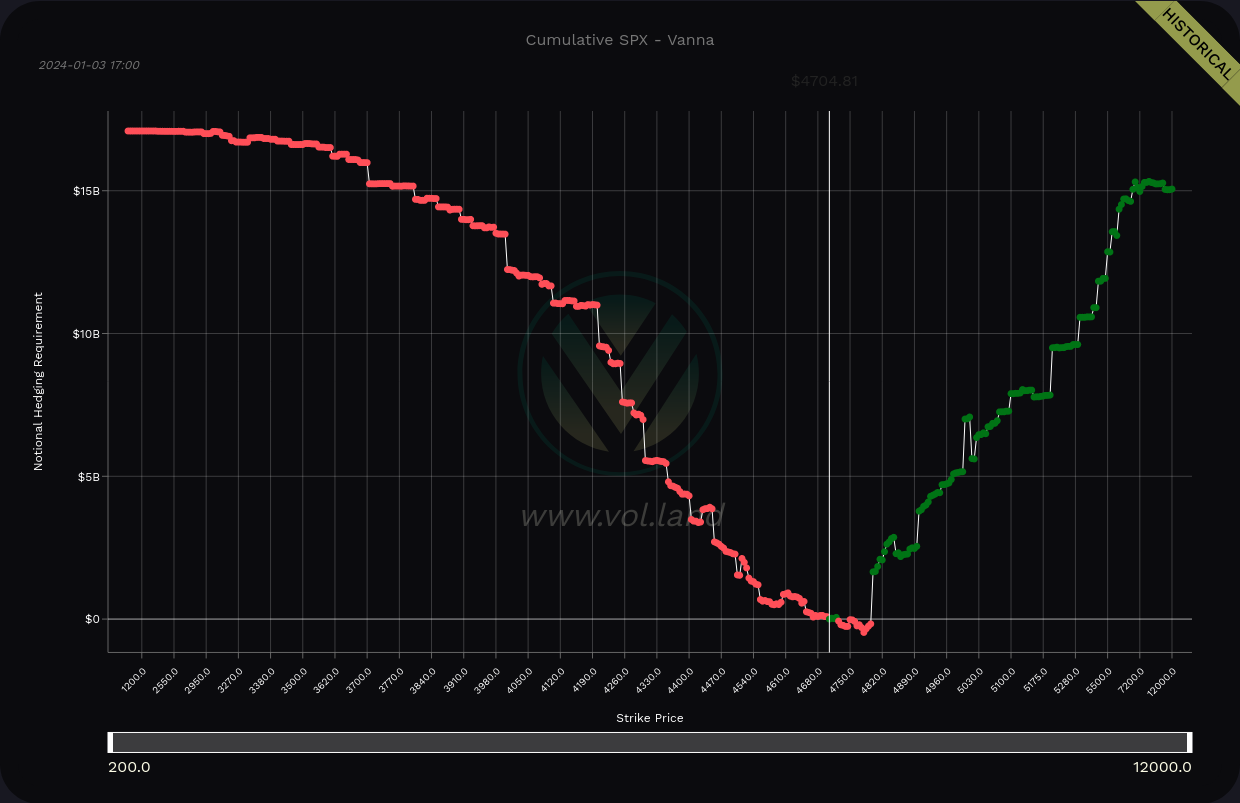
SPX vanna across all expiration dates
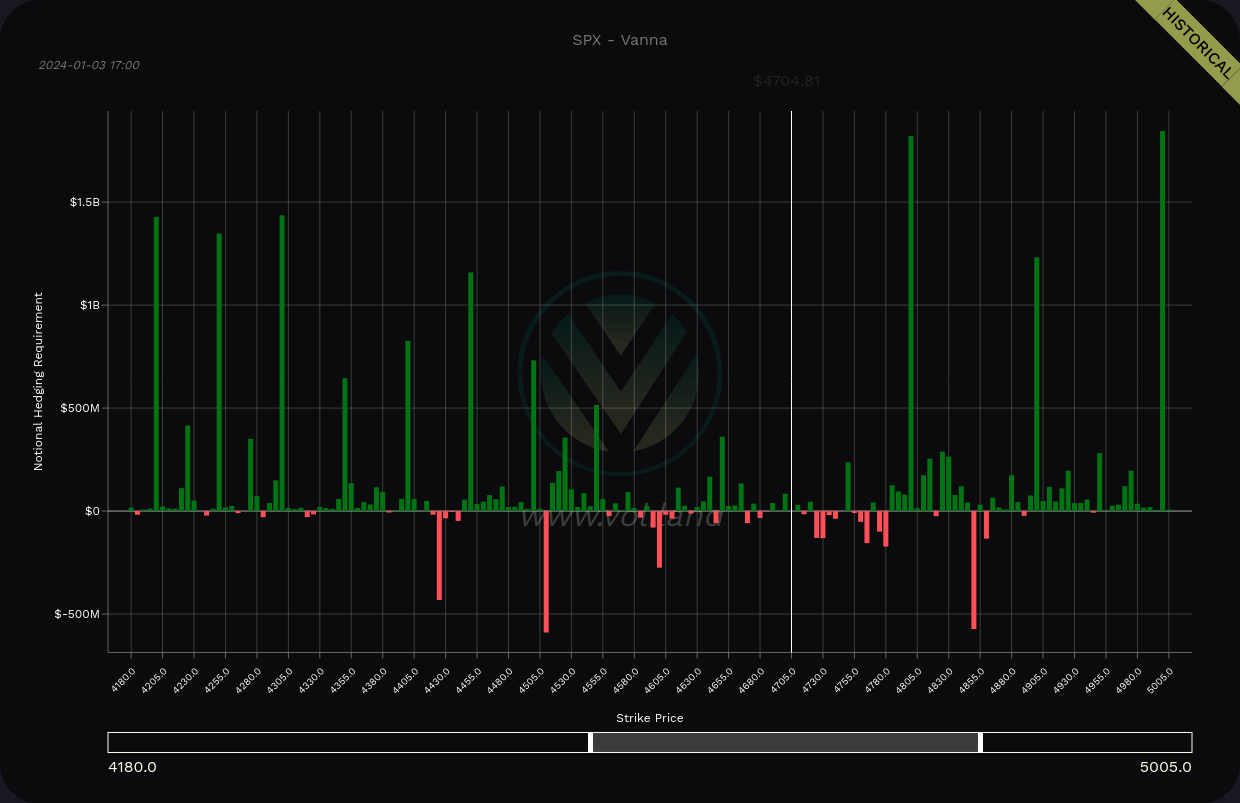
The bar chart has some incredibly tall positive lines. The biggest two are at 4,800 and 5,000 with another large one at 4,895. Just as a reminder, 4,800 is very near the all time high of 4,818.62 from January 2022.
On the downside, we have targets over a wide range. Our first large bars appear at 4,450 and they run all the way down to 4,200.
At the moment, I'm thinking that 4,450 to 4,800 is a good trading range to consider.
Just for good measure, let's check SPY's vanna as well.
We have a bullish setup on both sides of the current price, but the negative vanna just above the current price is more pronounced here on SPY than it was on SPX. Remember that vanna needs some room to operate, so bars that are very close to the current price might not have a strong effect. Vanna is strongest from 0.15-0.35 delta.
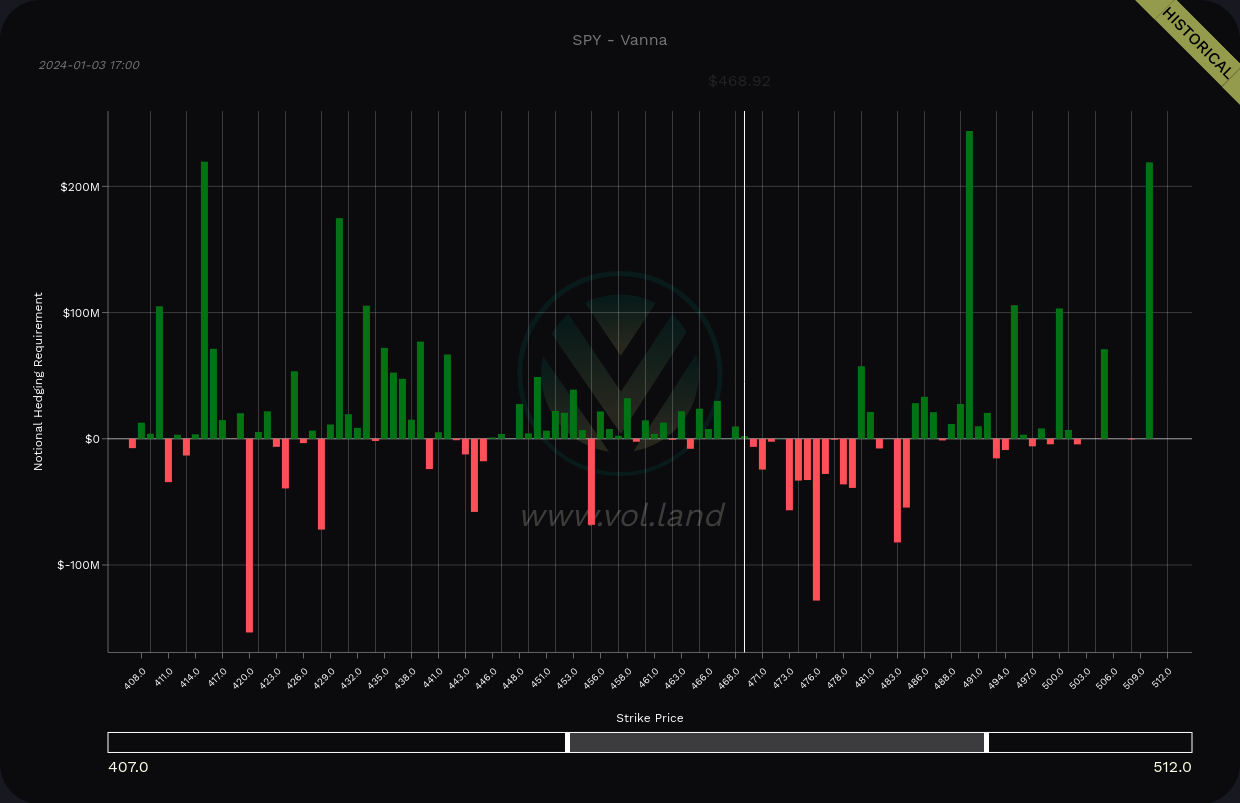

SPY vanna across all expiration dates
SPY's data suggests a range from about $430-$440 to $490, but there are some headwinds between the current price and $490 that don't show up on the SPX charts.
Gamma
Volland's delta-adjusted gamma, or DAG, can give us hints about gamma's highly localized effects once we reach certain prices. Positive vanna is a great magnet at times, but a bunch of gamma on the strike can cause price to hit the brakes or accelerate.

Good gosh, look at all that selling pressure! Bear in mind that the vanna levels we were examining earlier were in the $1B range and these bars are barely crossing $20M. So yes, there is likely going to be some selling pressure from gamma at many strikes, but the effect is fairly light relative to vanna.
Institutional trades
Volume Leaders offers charts that show where institutions are making large trades. However, these charts only tell you when the trade was made, the price at the time, and the size of the trade. It's left up to you to decide the direction.
First up is SPY. Institutions were excited coming out of the 2023 lows and they're very active again recently during the rally. None of these recent ones are massive, although we have the 24th and 28th largest SPY trades ever made during the most recent rally.

Institutions often like to "hide" their trades in less liquid ETFs since SPY is so closely watched by many traders. I'll bring up some other charts here starting with May 2023's rally.
Here's IVV, the iShares S&P 500 ETF. The most recent trade, the 35th largest ever, was for an even 1,390,000 shares. This typically signals an opening trade, but that's not guaranteed. Could this be a new short? A new long?
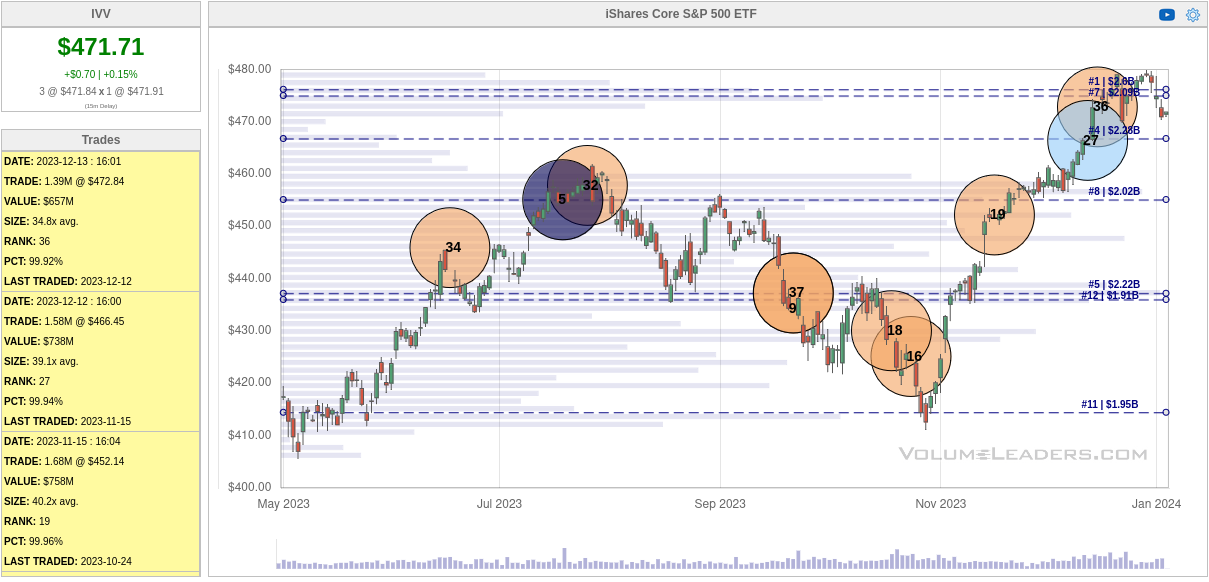
Vanguard's VOO ETF is next. The #5 trade back in August looked like an opening trade with an even 12M shares. #4 showed up before the October lows and it also looked like an opening trade (possibly a short). There's been a flurry of trades at the highs recently, including the 6th biggest VOO trade ever made.

Invesco's RSP is a little different because it gives all the S&P 500 components an equal weight (most are weighted by market cap). Traders have done an incredible job here making trades at highs and lows with nearly perfect timing. We've recently seen the 5th biggest trade ever made along with two trades that tie for the 3rd biggest trades ever. Wow.

Across the board, we have a flurry of trading recently near the all time highs. Lots of interest and very large trades usually signify a change in the market. This could mean that institutions are going long, going short, or taking profits on their existing trades.
Chart
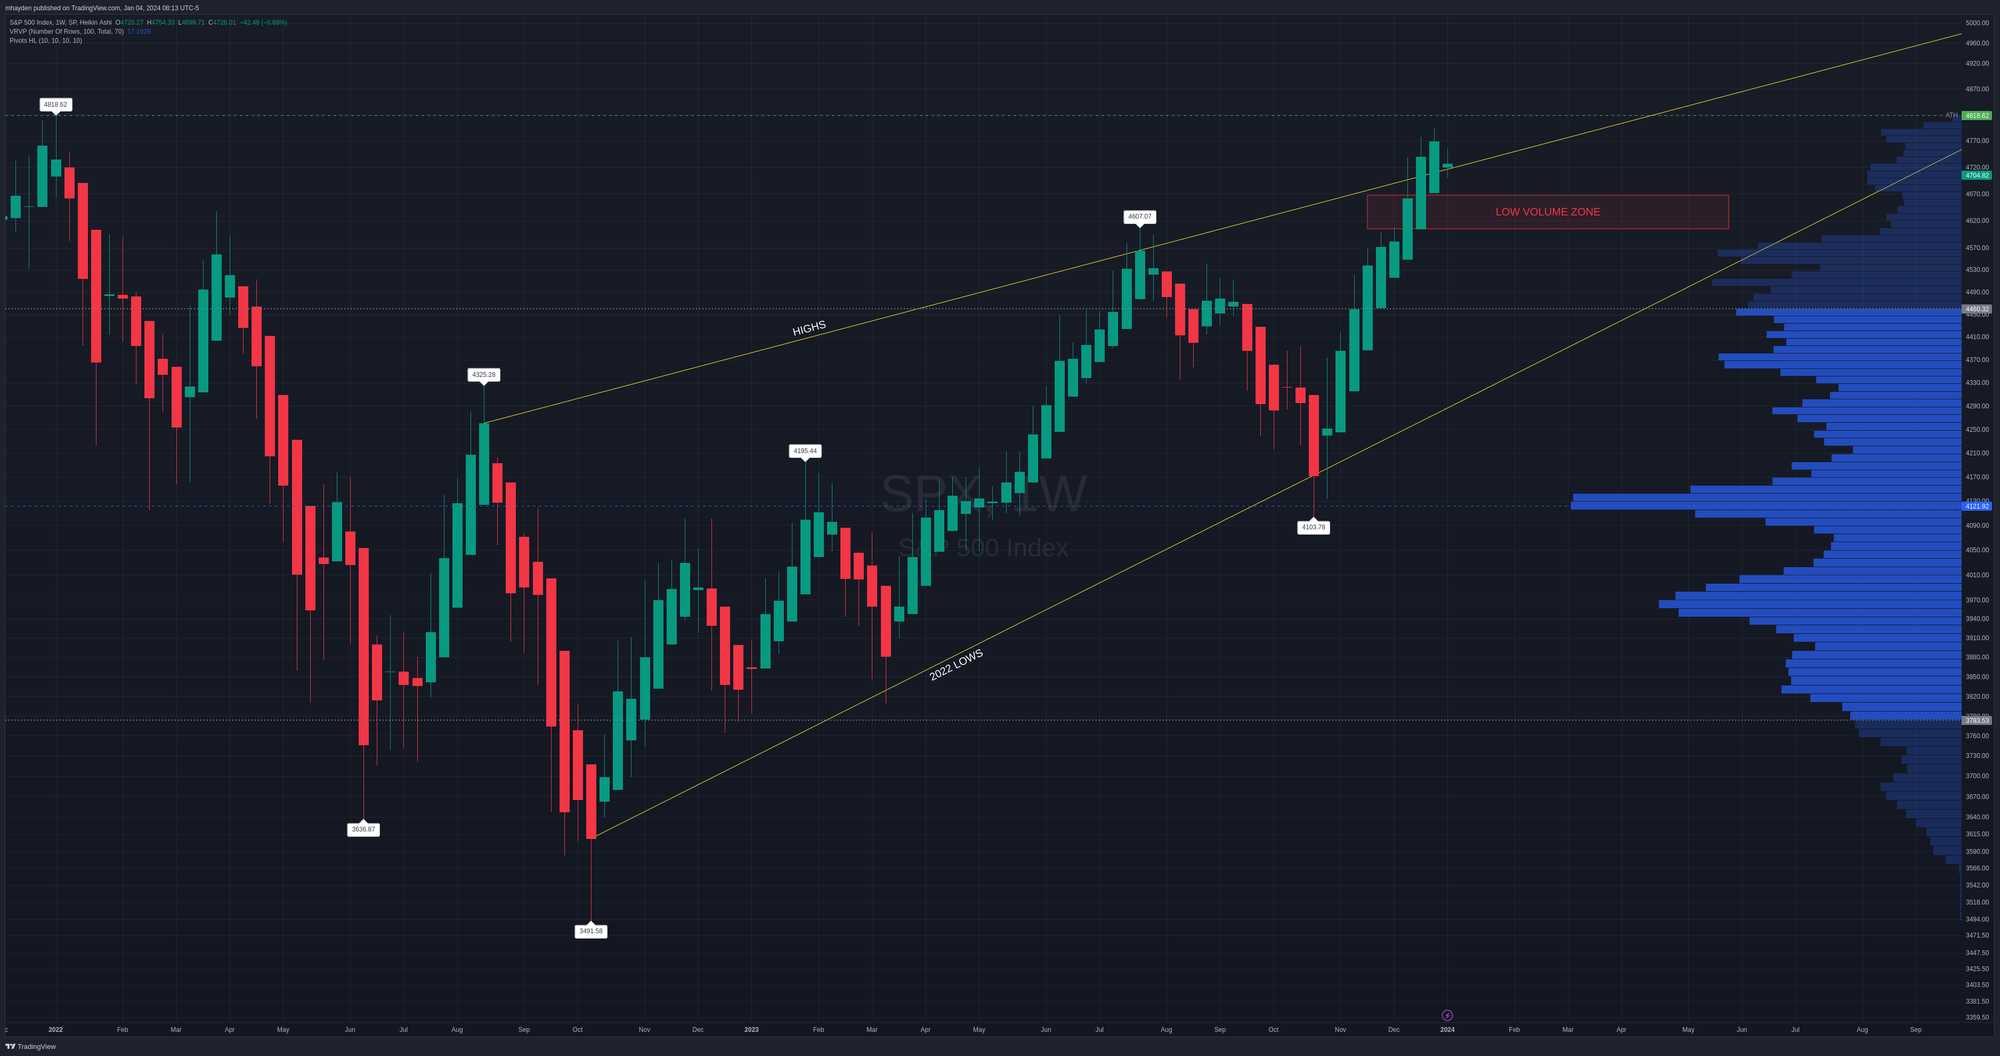
The SPX weekly chart is in an interesting spot right now. The current price is trying to decide where it wants to go relative to the upper trend line from 2022. It's also perched just above a low volume zone that could act as support. If SPX drops through that zone, the 4,500's look like a target.
70% of the SPX volume since the all time highs runs from 4,460 down to 3,783.
Thesis
There are plenty of macro effects throwing curve balls at the market right now and making a prediction is quite challenging. Does SPX have enough strength to burst through the all time high or will we see a revisit of another level, perhaps our recent higher high of 4,607?
I'd argue that much of this depends on where volatility goes. There's still payroll news coming up this week and as Jason from Volland notes:
Friday has significant event vol for NFP, as does Jan 11 for CPI. Deviations to these data points have been small, so you can expect the appropriate vanna response to the melt in event vol for them. For NFP, as of now, it is bullish.
I have plenty of positive delta trades on the board right now, but I have no bets directly on SPY or SPX at the moment. I've been holding two long August 16th $490 puts on XSP as a hedge and I don't plan to take those off for a while. I really want to see where SPX decides to go from here before taking on a bullish bet on the index directly.
If SPX seems to bounce from or avoid the low volume zone I noted in the chart, I might go long with a short put around 45 DTE.
Good luck to everyone out there! 🍀


Discussion