SPX and SPY analysis for November 10

SPX took a turn after the bond auction, but where are we going now? 📈

Happy Friday! ⛅ Yesterday's bond auction threw markets for a loop and it's been a while since I've done a post on the broader market. It felt like good timing for having another look at SPX.
All investments come with significant risks, including the loss of all capital. Please do your own research before investing, and never risk more than you are willing to lose. I hold no certifications or registrations with any financial entity.
Let's get into the data. 🔎
Vanna
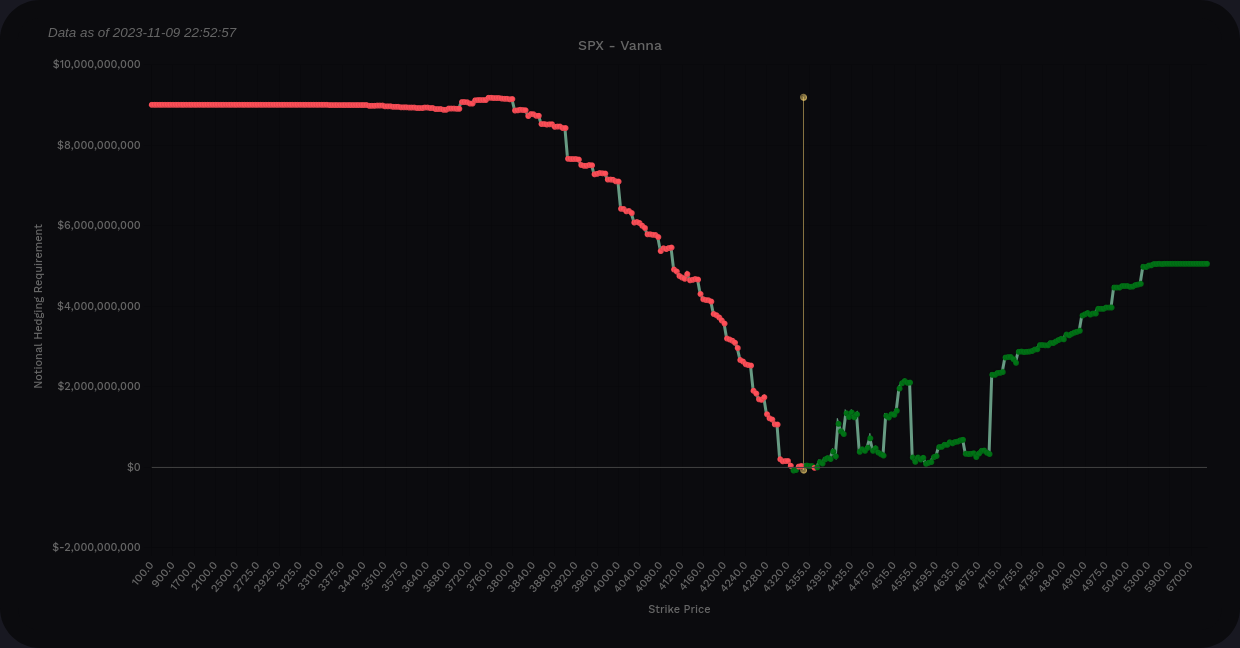
I'll start with a look at vanna across all expiration dates for SPX.
If you're bullish, SPX has a great vanna curve for you here provided that IV contracts. There's plenty of positive vanna above the current price which could be a magnet for a move higher. Yes, there are some negative lumps in there, but this is overall a fairly bullish picture.
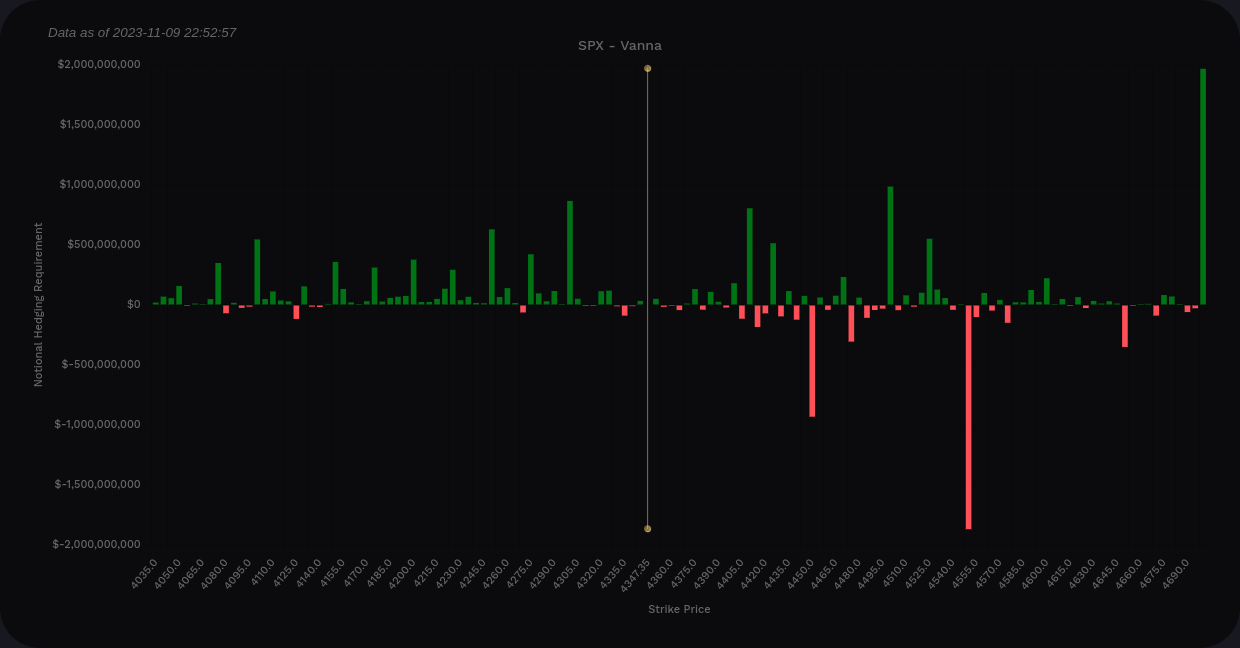
On the bar chart, our nearest cluster of positive vanna sits around 4400-4425. The 4410 level has been steady for multiple days but the build-out around it is a new development. 4450 will fight upward movement but then we have another positive vanna zone starting at 4500.
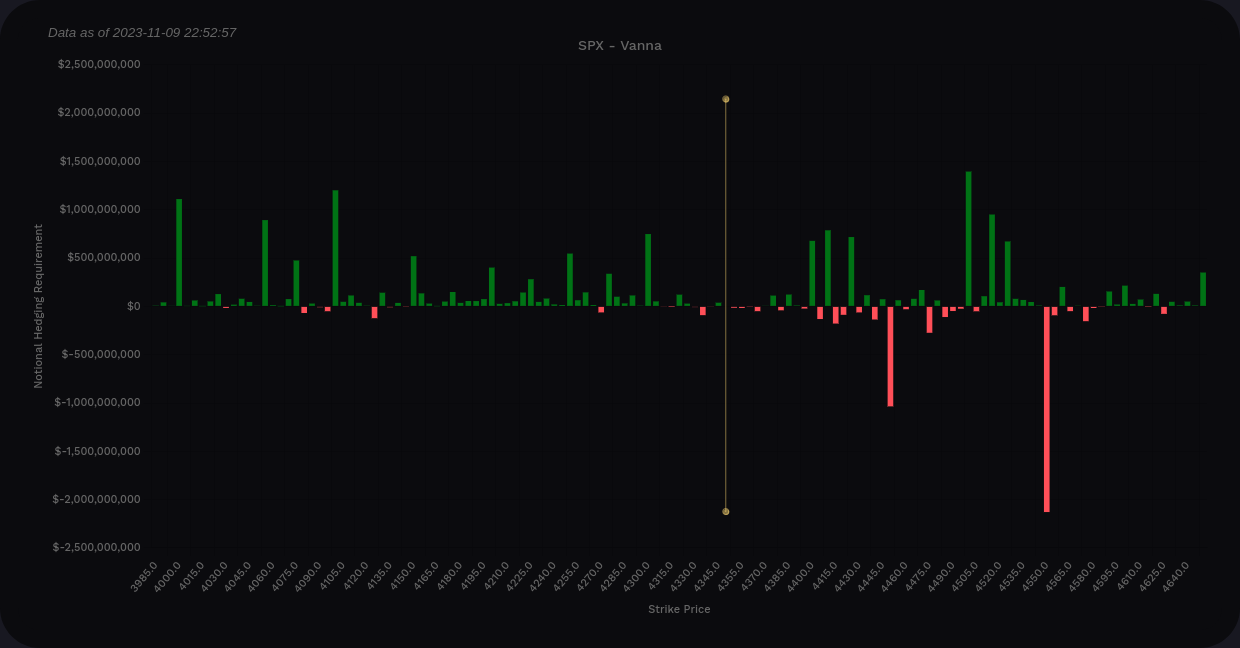
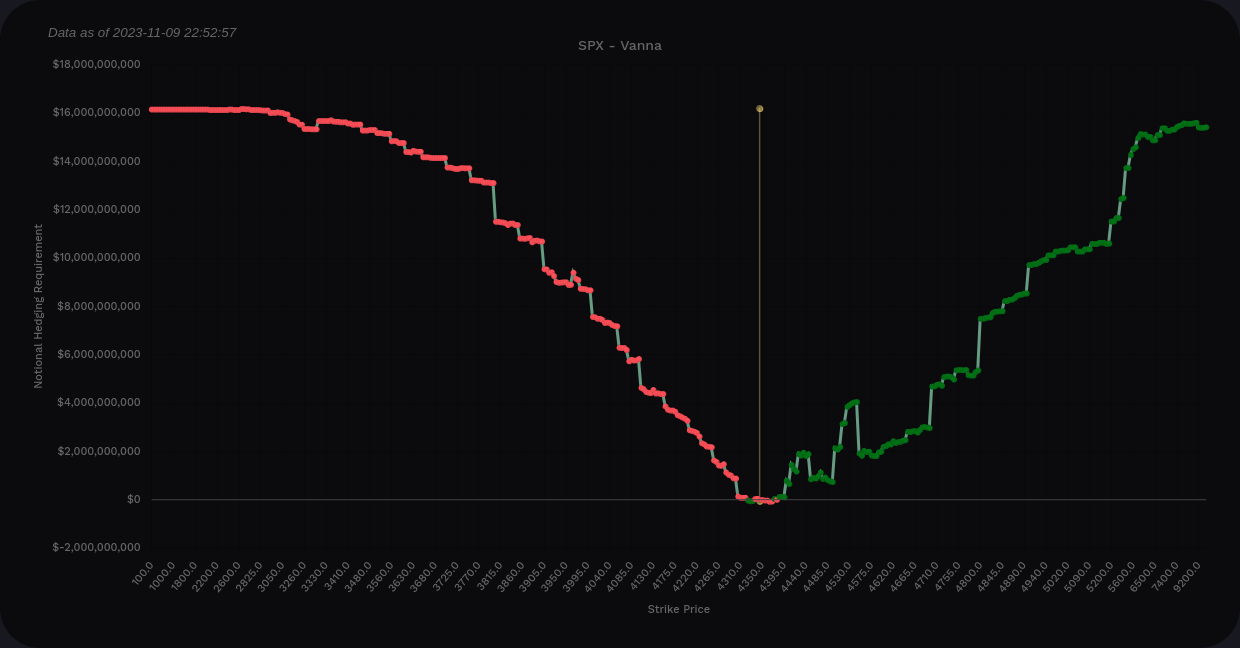
SPX vanna from Volland (all expiration dates)
Should IV expand and SPX slumps a bit, we pick up support at 4300 and then about every 25 points below it. 4100 is a big level below that.
Let's get a look at now through the next OPEX on 11/17. This is definitely less bullish. Sure, a run to that 4410 would certainly be possible, but 4450 and 4550 show up as big stop signs for price movement here.
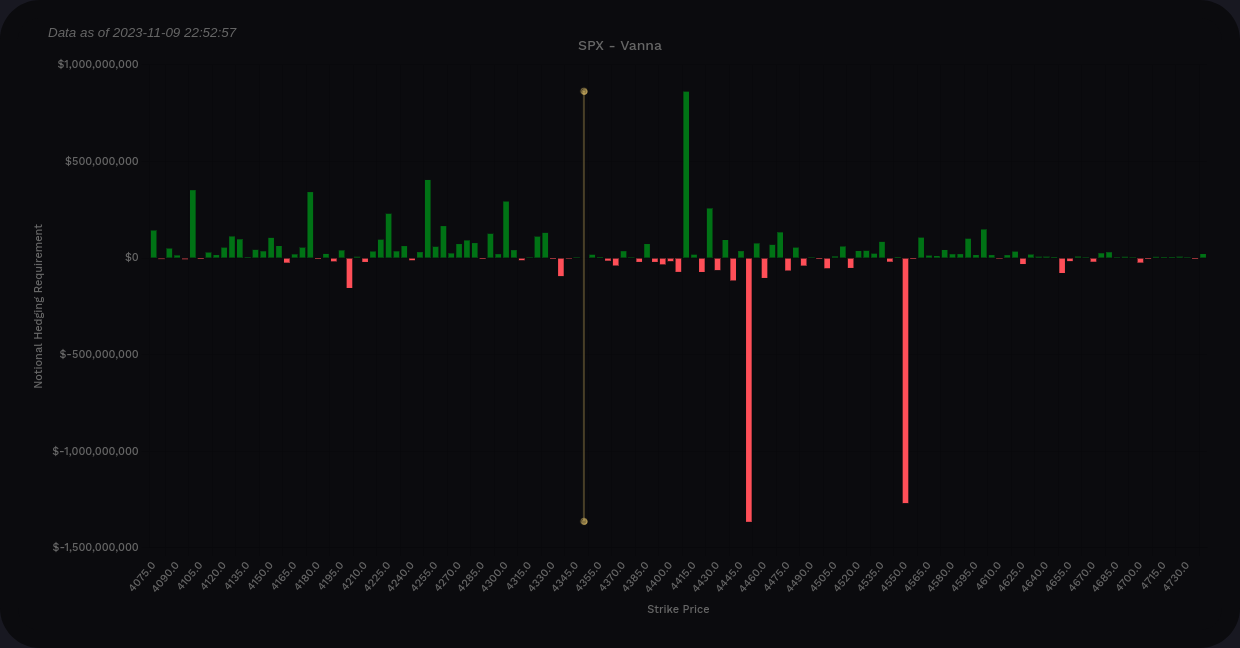
SPX vanna from Volland (now through 11/17 only)
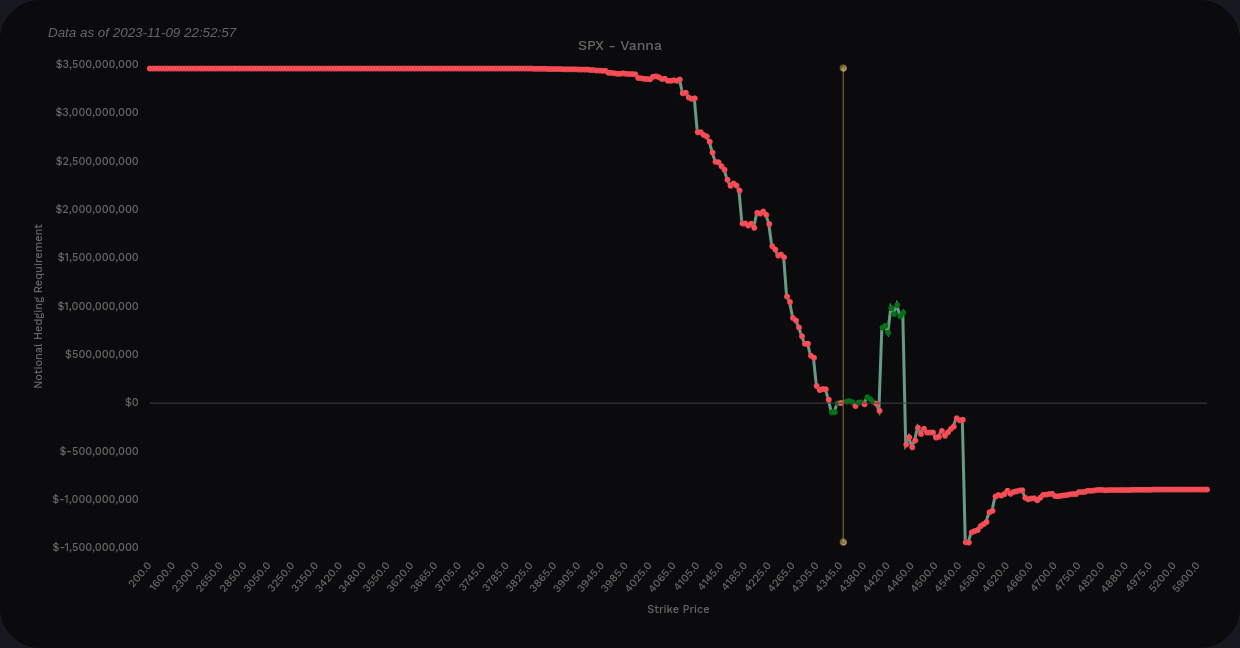
What about now through 12/15? Most of my trades are focused on the December OPEX.
So this looks more bullish than 11/17 does and this is the first OPEX where I see the 4500 level pop up. But wait, what is the level on the very right edge. That's 4700! It's a huge bar, but we have some hurdles in between that we've gotta climb over before that's a possibility.
SPX vanna from Volland (now through 12/15 only)
Institutional trades
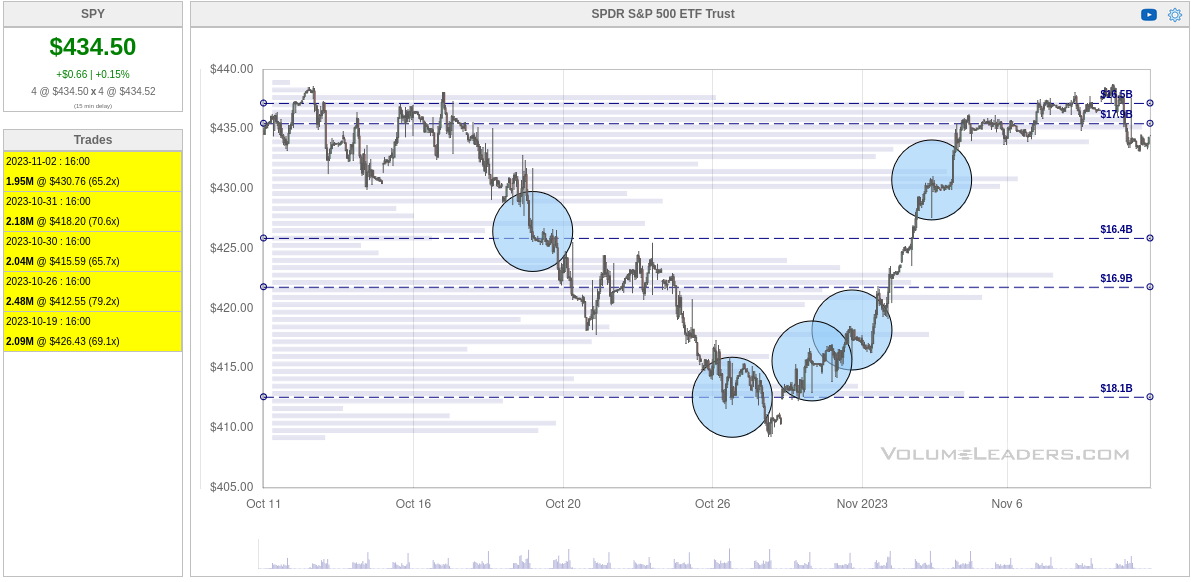
I ran a query on Volume Leaders to examine SPY's five largest trades over the past 30 days. Although this tool doesn't show direction, we can infer that the October lows were a really critical spot where SPY has some good support. Millions of shares were traded in that area. The big question is whether the recent trades up around $430 were buys or sells. 🤔
Sometimes institutions like to "hide out" in leveraged ETFs or very thinly traded funds. UPRO is a good one because it's leveraged bullish and it gets much less attention than SPY. It received some really big trades over the last 30 days.
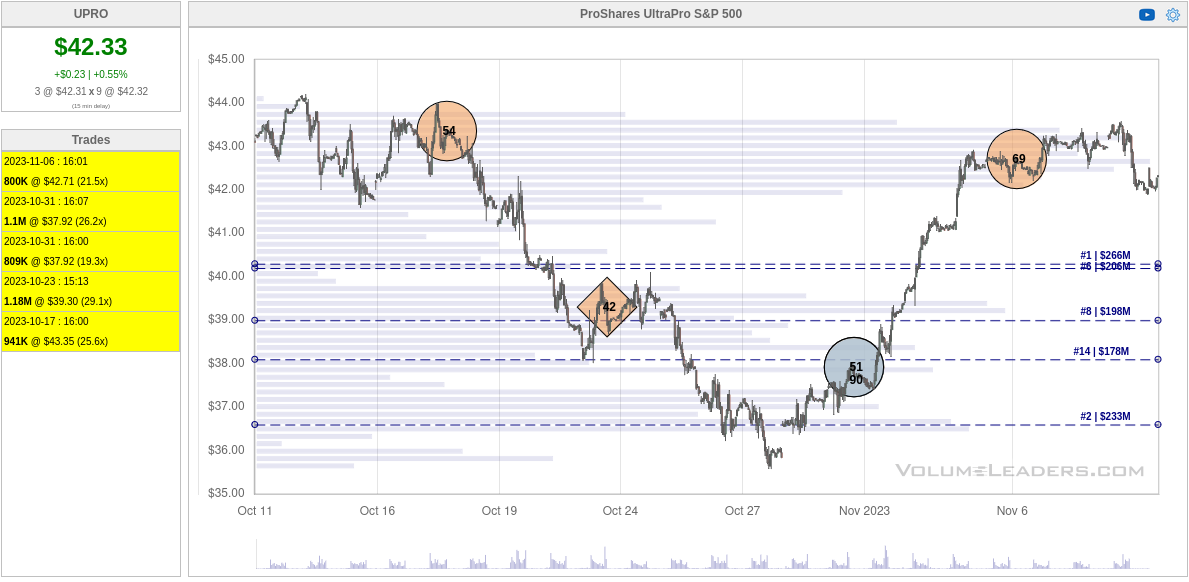
#69 at the top right is the 69th biggest trade ever made in UPRO since it began trading. That's a big trade and it could be a profit taking trade from the lows. It could also be a new short. Note that the #1 volume level sits just over $40 and the #2 volume level is around $36.50. Will we return to those levels?
Chart
SPX slid down through 2022 and rallied back in 2023 only to have some trouble around 4600 in July. Since then, we've slid down to the lower half of the 4400's and we sit at 4347 as of yesterday's close.
SPX sits just above order blocks from multiple time frames around 4100. That's where we saw tons of institutional trades in the previous section. We made a good bounce off that level recently, but those order blocks are still valid today.
Above the current price, 4550-4650 is full of order blocks from three different time frames. Those were set back in March 2022 and SPX failed to break through that level back in July.
On the weekly, our current market structure is a bullish break of structure that was set back in May during the AI rally.
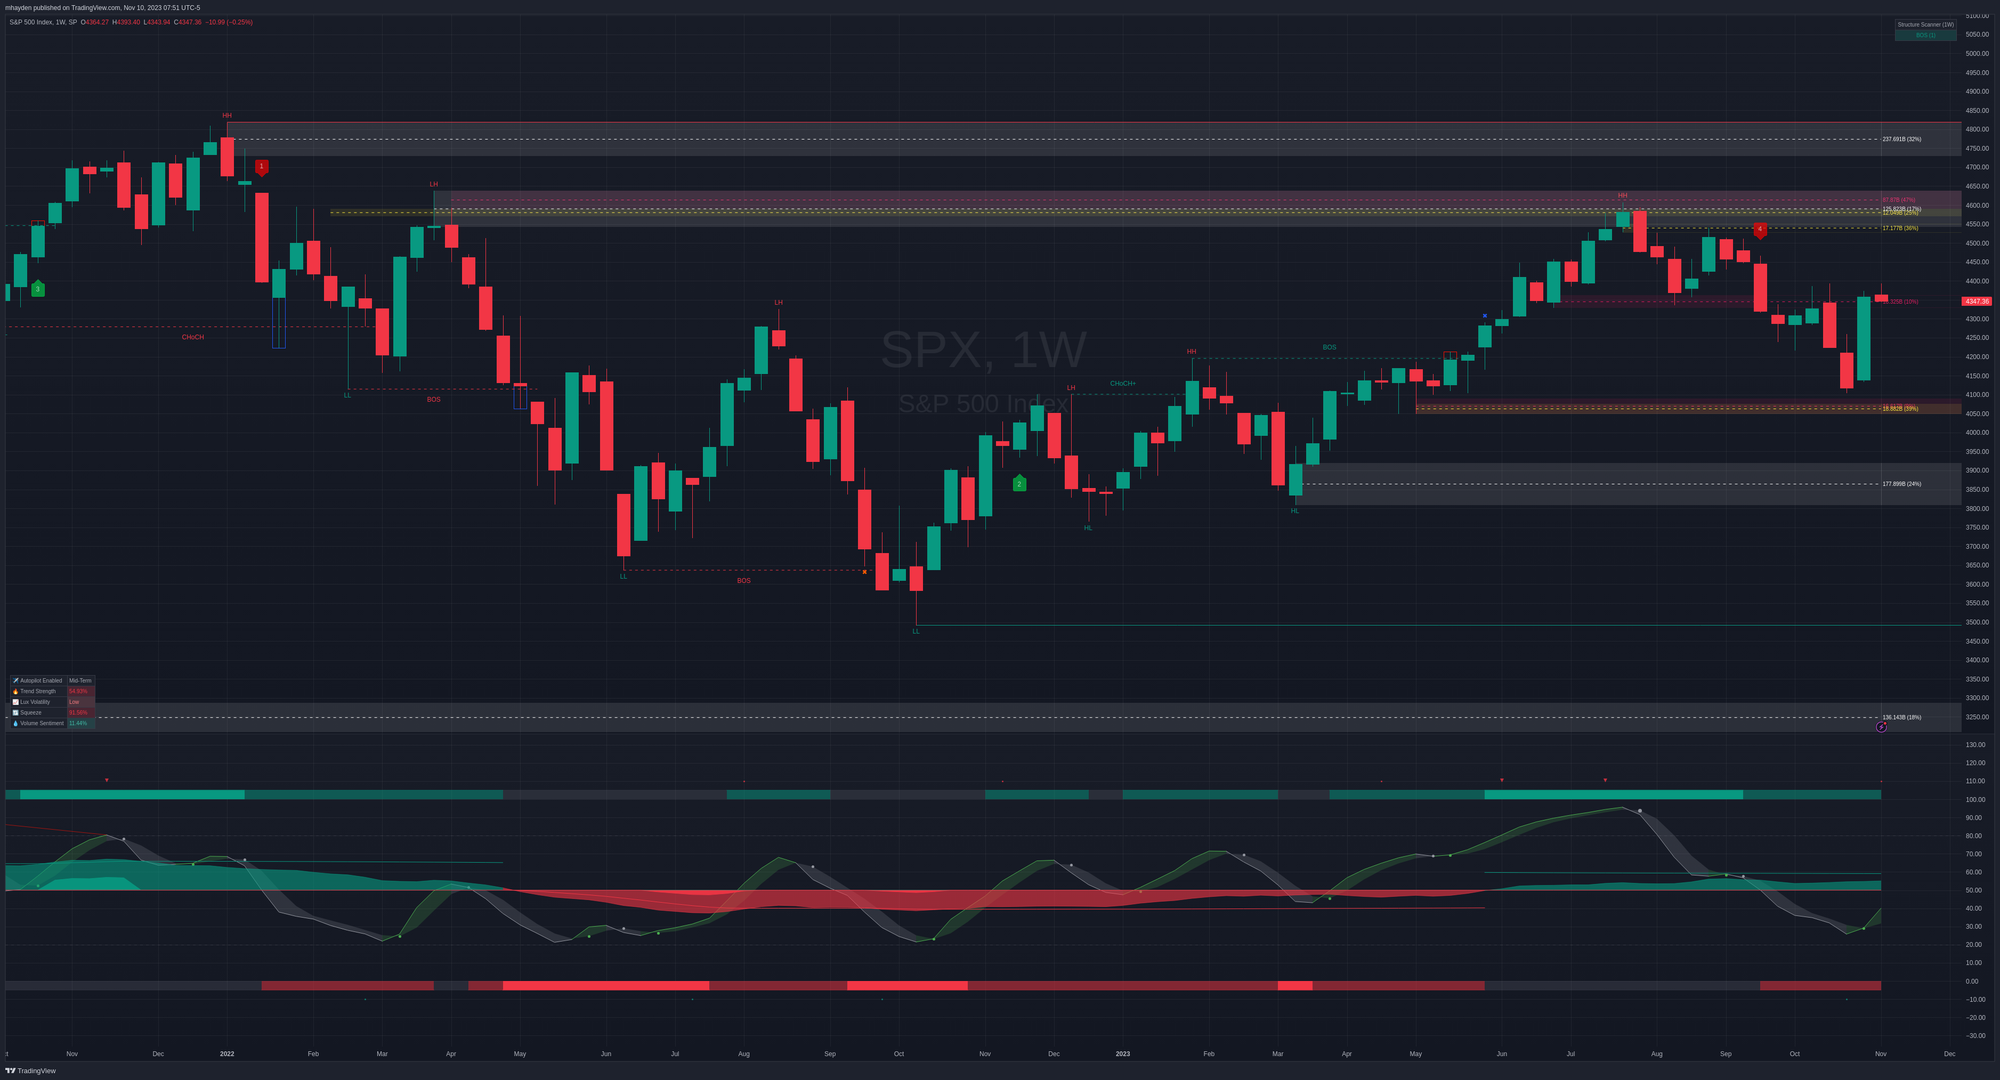
The oscillator at the bottom tells us a bit more about momentum. The wave fell below the zero line back in September, but it began turning a corner last week. The money flow (center of the oscillator) is green, which indicates bullish momentum, but it's a bit thin and below the threshold we want to see for a bullish rally.
LuxAlgo's Signals and Overlays indicator says bears are in control by about 55% at the moment, but the volume sentiment is leaning bullish at just over 11%. The squeeze factor is just under 92% and that indicates that price is being held in a tight range with lots of volume. This also suggests we're about to break out in one direction or another soon.
Another trader told me that he watches the correlation between the VVIX and SPX. You probably know the VIX, which measures volatility of the S&P 500 index. In the simplest terms, the VVIX is a measure of the change in volatility of the VIX. The VVIX is like a VIX for the VIX.
Is your head hurting yet? 🤕 (I'm still learning this.)
Essentially, when the correlation between the VVIX and SPX closes above the zero line, it's a good indicator that the VIX is about to change direction. If you have an idea of where the VIX is going and you know how the vanna charts look, you can increase your edge on trades.
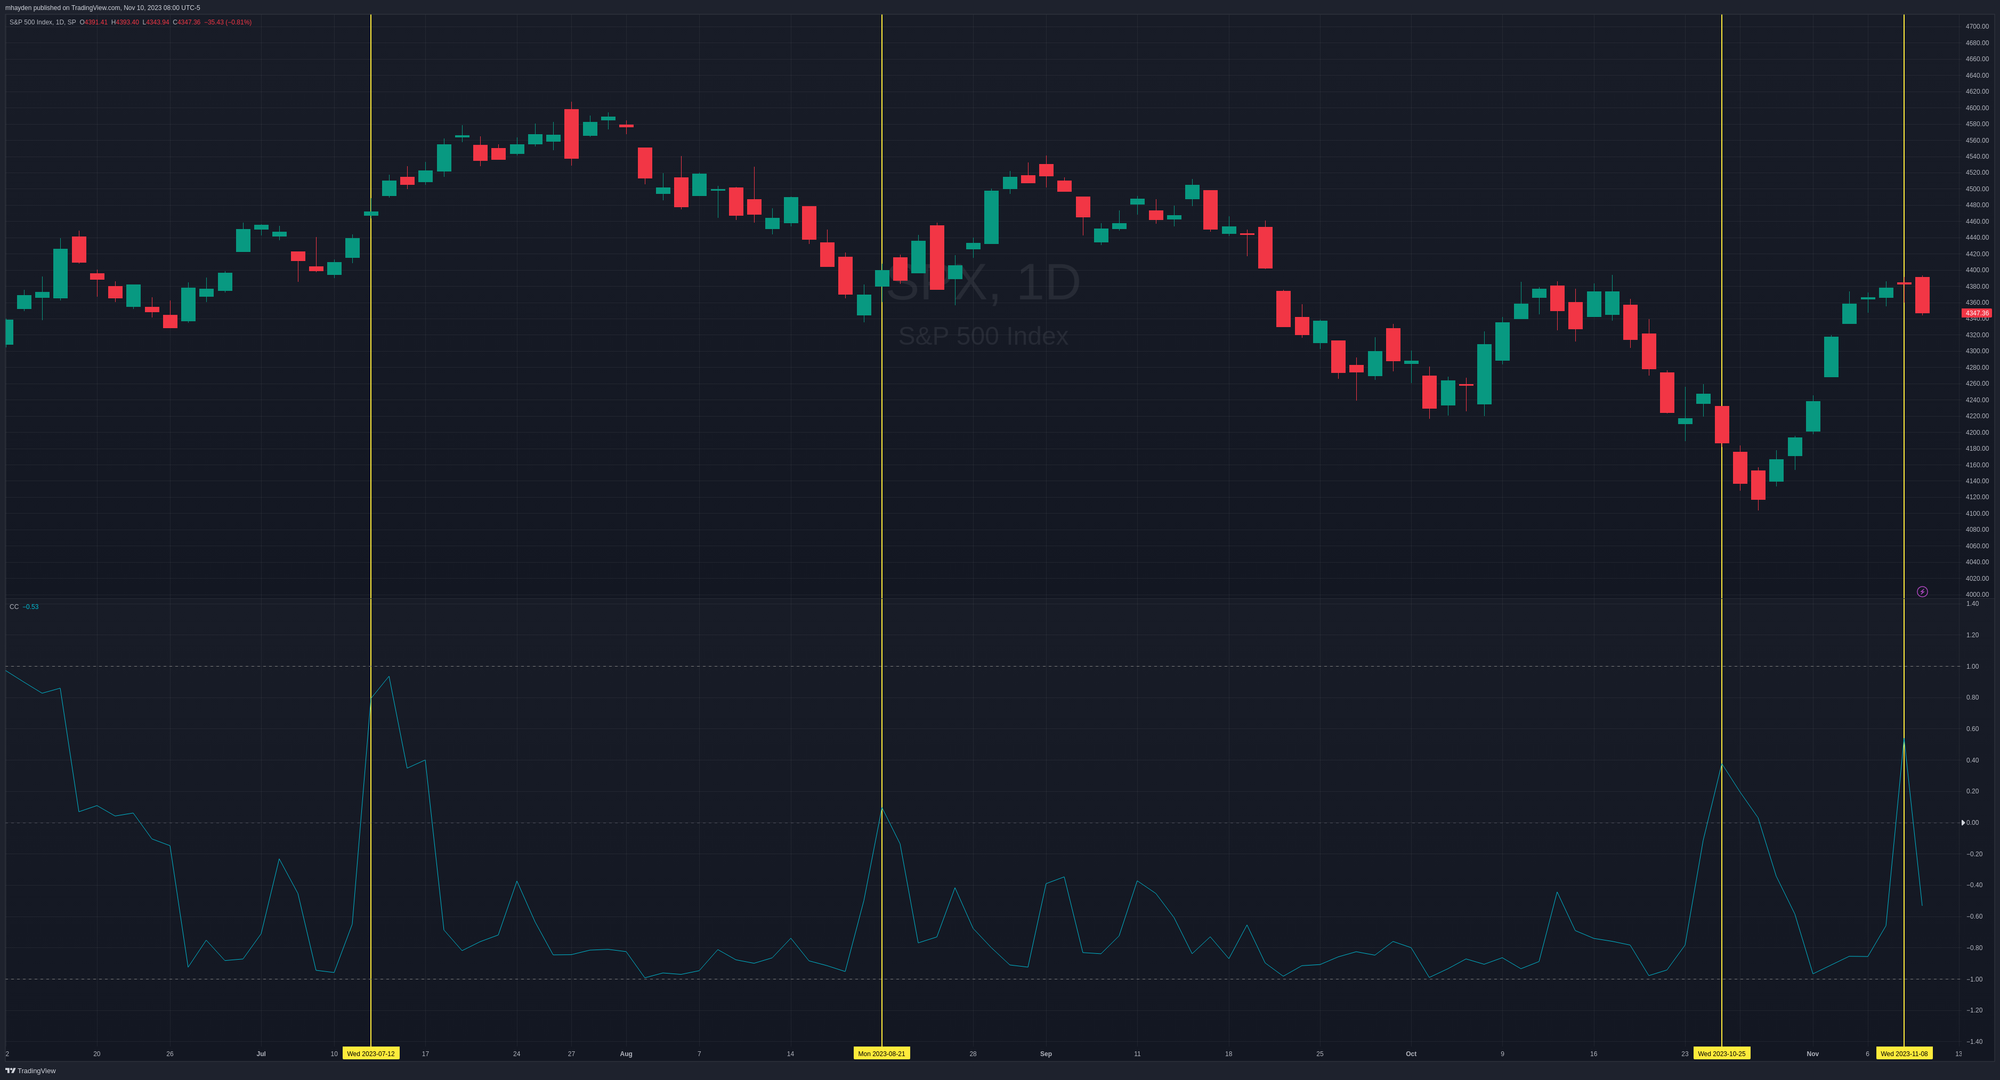
11/8 was the most recent close over zero and what did the market do? VIX climbed and SPX took a turn downwards. Remember that increasing volatility with lots of positive vanna is a recipe for bearish price pressure from dealers.
The correlation is well below zero today and my guess is that's a signal that our current direction – VIX up and SPX down – might continue. Then again, I'm still learning how to apply this knowledge. 😉
Thesis
SPX sits in a tight squeeze right now and I could see us getting up over 4400 and also back to 4410. There are some nice bullish levels building out above 4500 for 12/15 and later, but typically January is a dull month for trading. Cem Karsan has called out January as weak, too.
I'm sitting on a SPY $426/$439 short strangle for 12/15 and I'm thinking my call side is a little low. This dip could give me an opportunity to adjust that side of the trade. If SPX slides back down around 4100-4200, I'll be very interested in making a bullish trade there. It could be a short put if volatility is high enough, but I might just get some shares.
Good luck to everyone out there. 🍀
Discussion