SPX outlook for December 21
As we approach the end of the year, how is SPX looking? Is yesterday's dip a one-off?

Happy Thursday! 🌄 Yesterday's price action spooked the market as SPX slid down on a VIX expiration day. These are usually strange days within the market and yesterday was no exception.
All investments come with significant risks, including the loss of all capital. Please do your own research before investing, and never risk more than you are willing to lose. I hold no certifications or registrations with any financial entity.
Is SPX running out of steam? Is it just catching its breath during a rally? Let's dig into some data to find out. 👀
Vanna
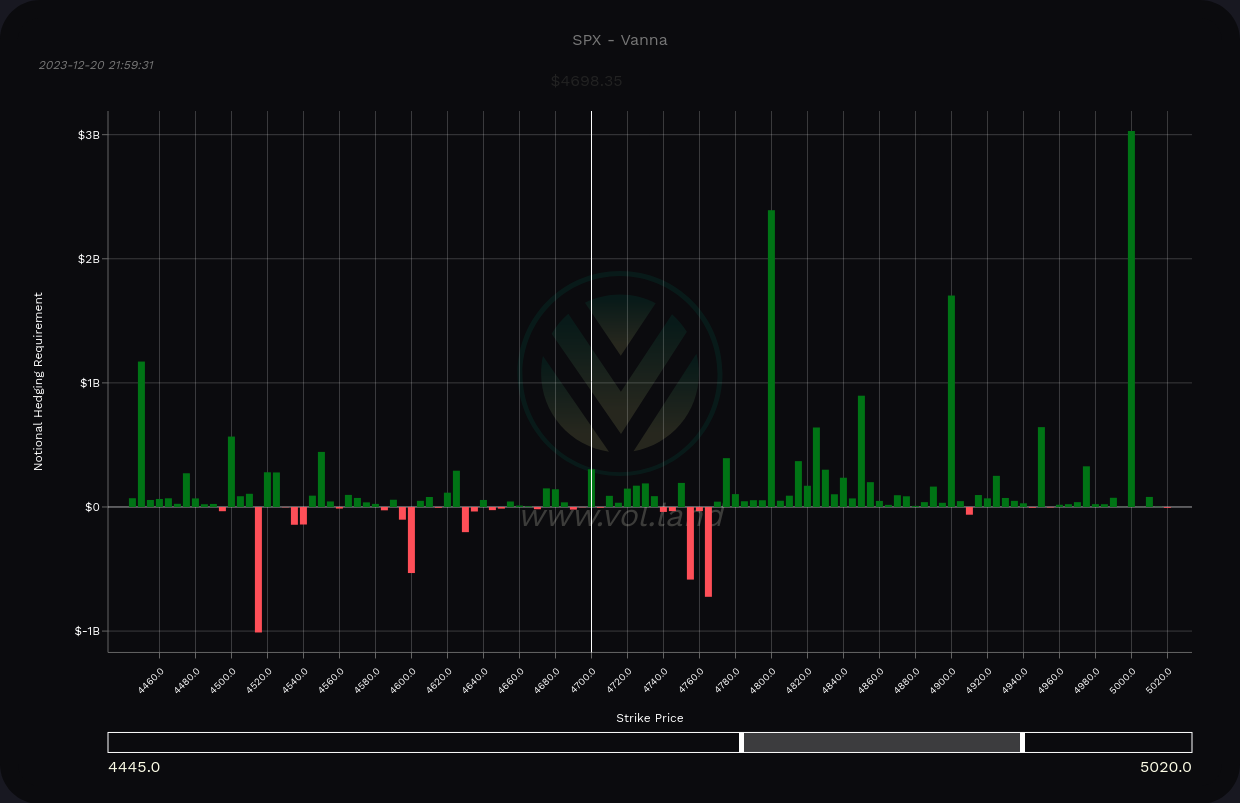
At a high level, SPX still has some very bullish vanna provided that the VIX remains relatively calm.
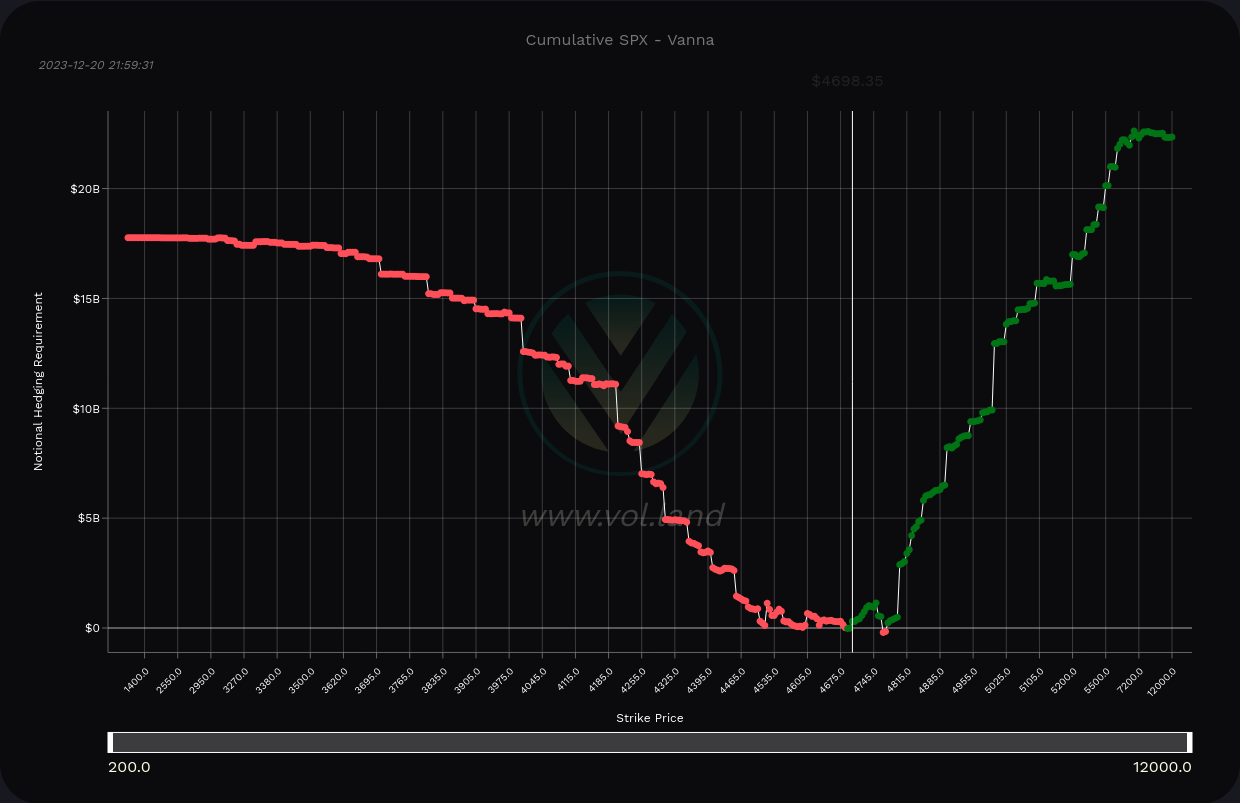
The curve on the right shows a steep positive increase above the current price and a decent amount of positive vanna underneath. There's not much negative vanna to speak of, and the negative vanna we do have looks relatively small on the curve.
Let's start with some potential upside targets. Our biggest nearby target is 5000, but we have some strong positive levels at 4800 and 4900. Some negative vanna gets in the way around 4755-4765 and that might slow the progress upward until price gets into those levels.
☝️ Remember that vanna effects run to zero as price moves on top of the vanna level. That's where gamma kicks in. Vanna needs room (0.15-0.35 delta) to operate.


SPX vanna for all expiration dates
How about the downside? We have some potential to catch a bounce around 4515 and 4450. There was a lot of trading around 4600 and there's a potential for a bounce there, too. However, these lines are quite small when compared to the other lines on the chart.
Institutional trades
We can look to some SPX ETFs to give us an idea of what the traders with deep pockets are doing. First up is SPY.
SPY saw a lot of interest in the $465-$475 range and then a sudden #63 trade appeared on yesterday's dip right at the bottom. Could this be a dip buy? Could it be someone taking profits or opening up a short position? That's not totally clear yet.

VOO is Vanguard's SPX ETF and it saw a similar trading pattern. A big late print came through yesterday on the dip. The biggest trade on the chart since the late November bottom is the #23 trade on Dec 13. That was right after SPY ripped past $470. (VOO just went ex-dividend and that partially explains the weird recent gap.)

IVV is up next and that's iShares' SPX ETF. There's a similar pattern here with much more trading on the upswing and no big trades on the dip yesterday.

Last but not at least, let's examine RSP. This is the Invesco SPX ETF but all of the stocks are equally weighted in this ETF. There are no market cap weights. Institutions love to make bets in here because this is a thinly traded ETF that isn't watched as closely as SPY.
We have a #5 trade at the highs followed by a double #3 biggest trade after the brief pullback. Yes, that's a double #3 – two trades showed up that were each tied for the third biggest trade ever made in RSP.

The usual pattern I see here is nibble, nibble, nibble, GO where institutions begin building a position, long or short, and then suddenly they make a massive trade when they feel the trend is matching their expectations.
The other pattern is a sudden massive trade without lots of smaller ones around it. That seems to be when they're betting on a reversal.
It's difficult to tell what's happening here so far. Vanna suggests we have room to climb and Cem says 4700-4900 is his target by January 17.
Charts
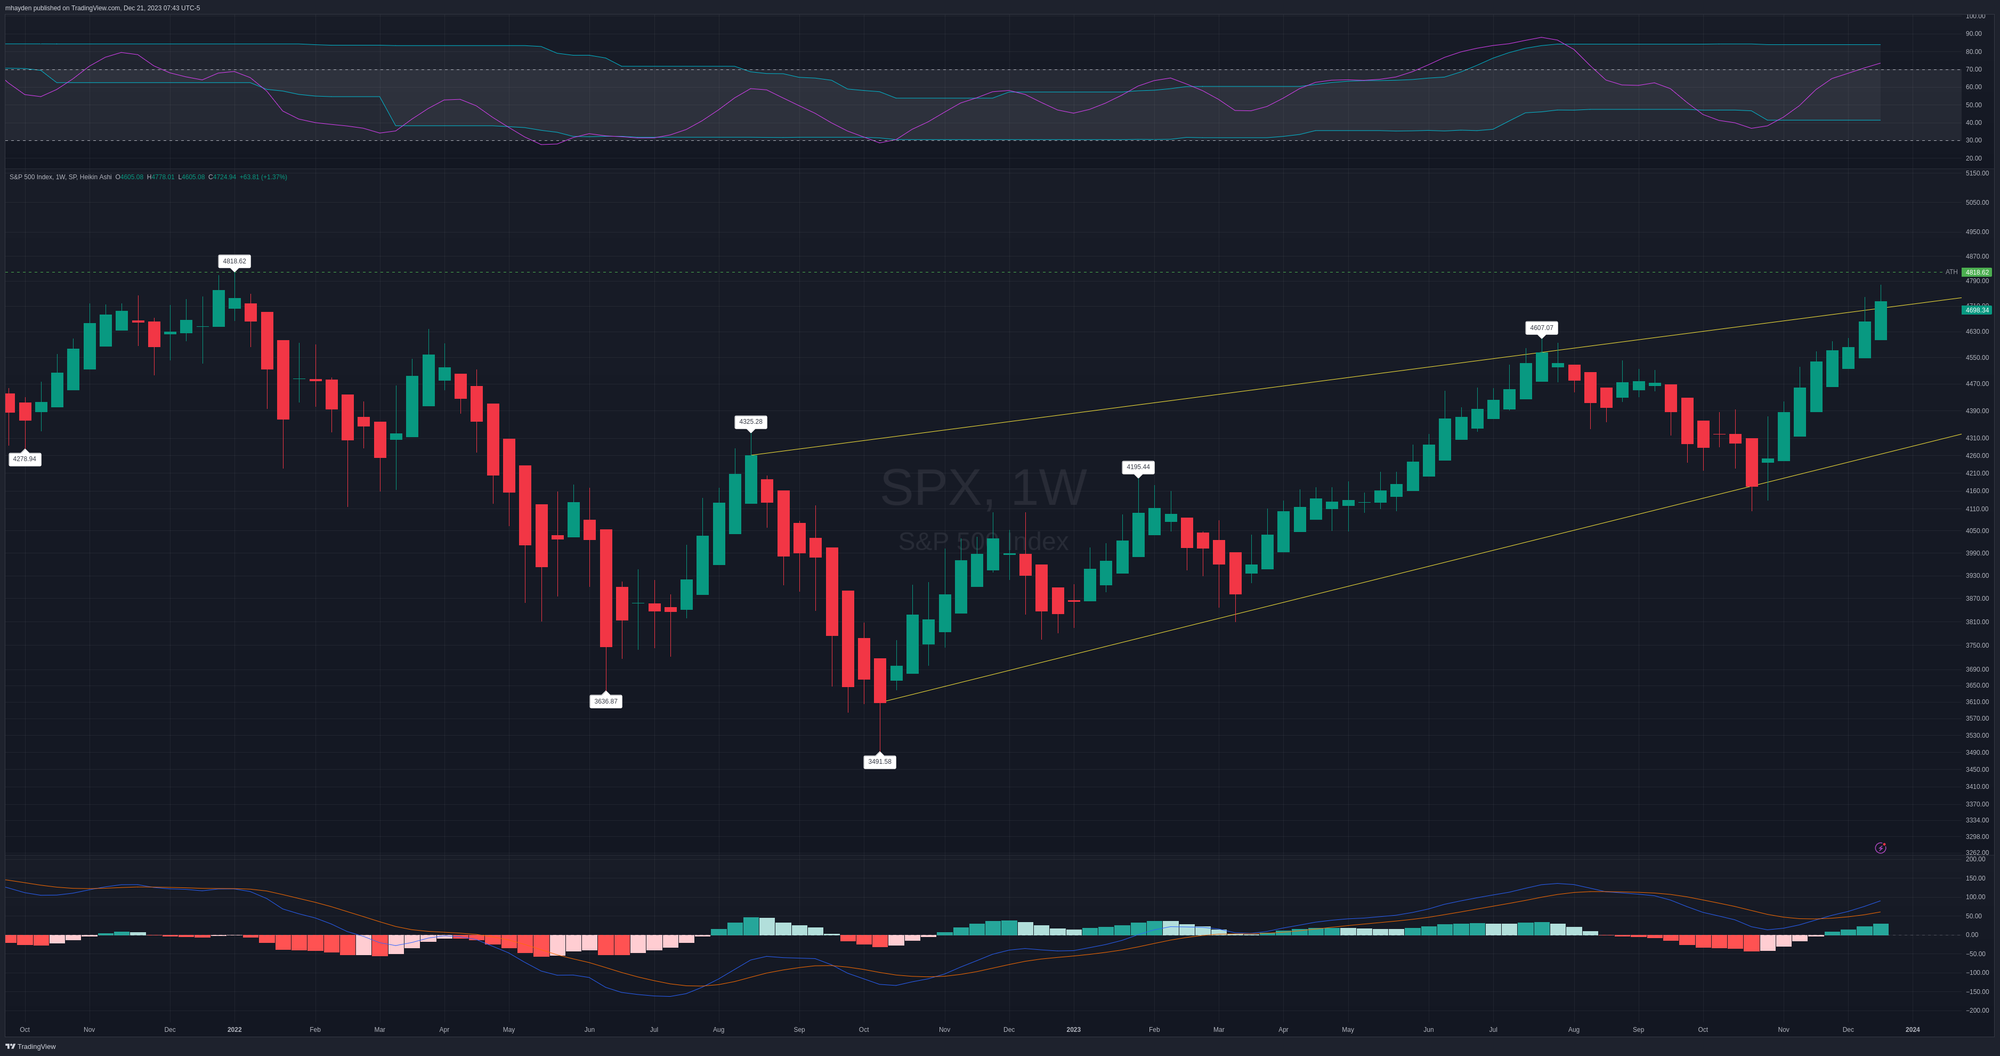
If we examine the SPX weekly chart since the all time high back in 2022, we have a channel running from the lows in 2022. One might argue that we've attempted a breakout of that channel already. However, price is sitting inside the channel again after yesterday's close.
RSI is pretty overbought right now, but there's room for it to climb in the channel. We also have a succession of higher highs in the RSI since the 2022 lows that bottomed out in November and rallied. MACD shows plenty of strength that is still growing.

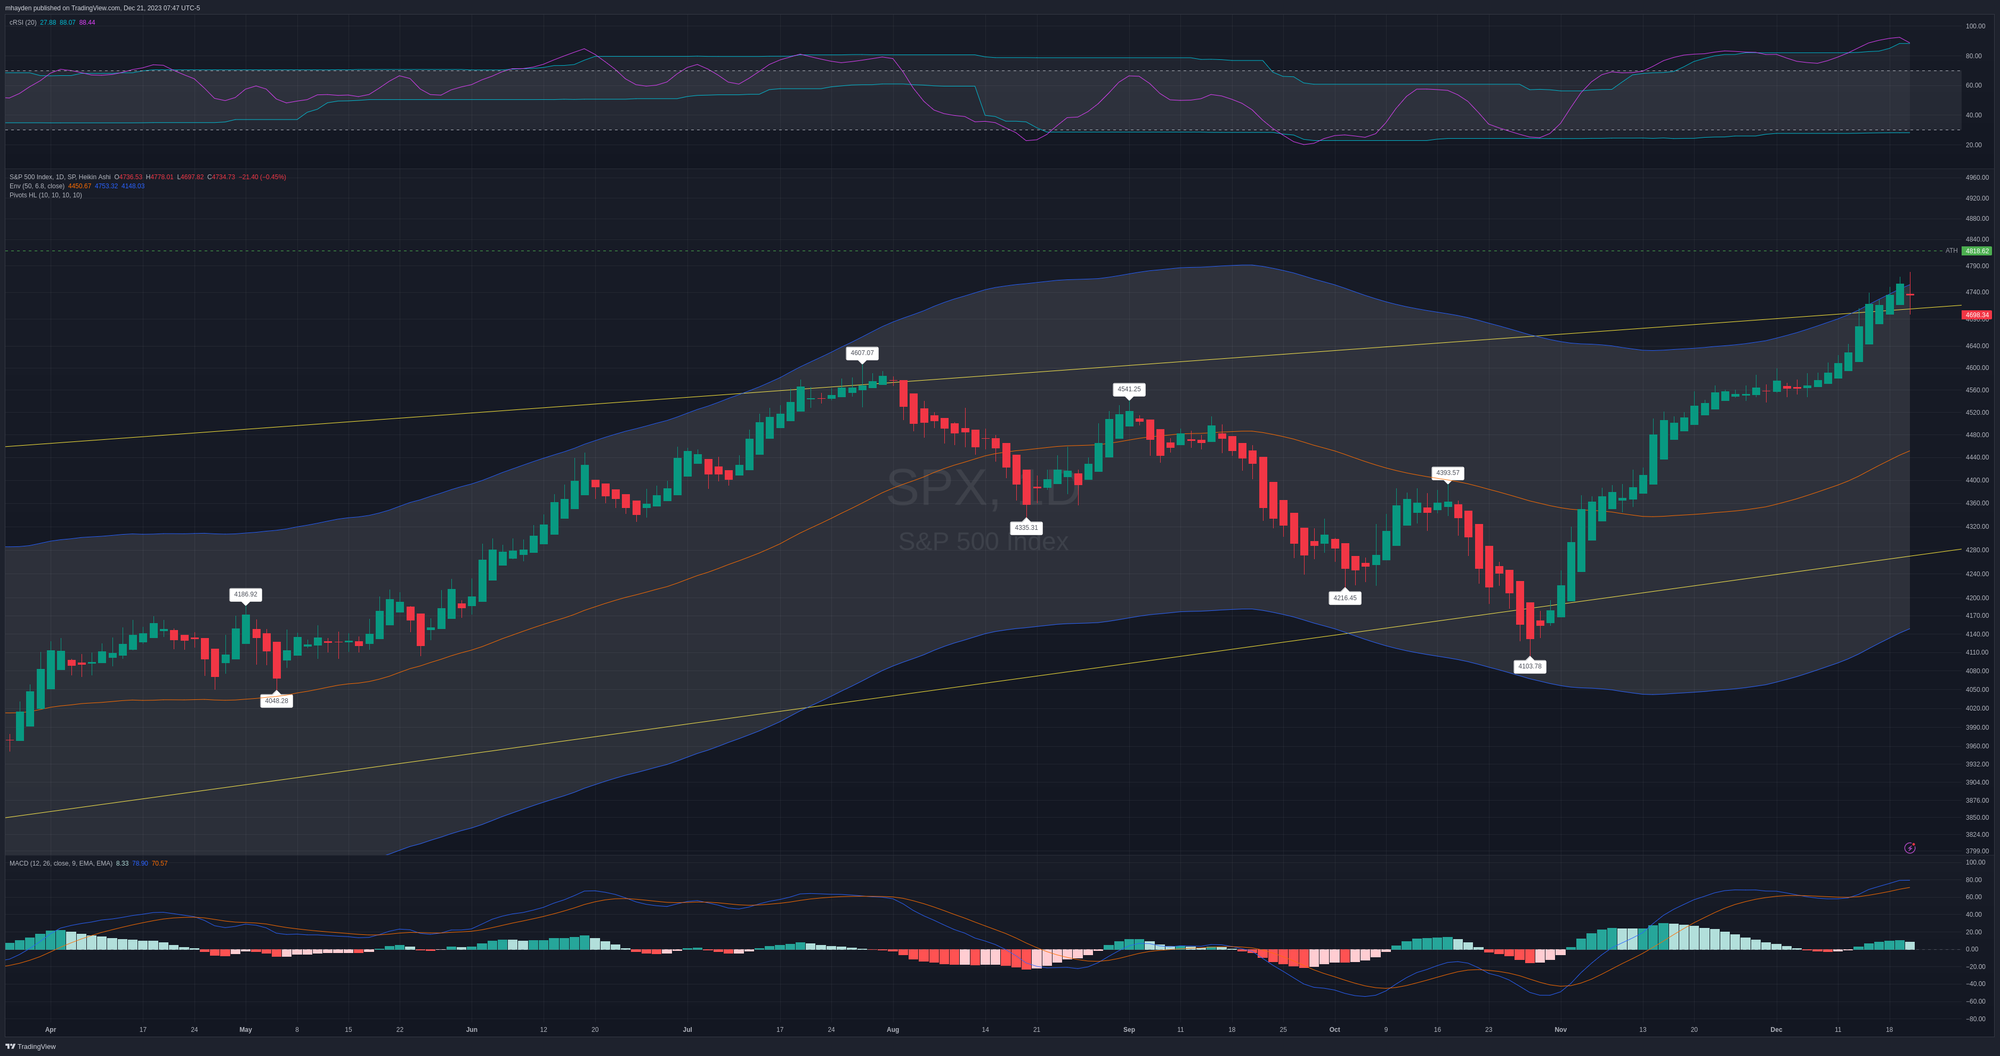
Let's drop to a daily with our existing channel and add a 50-day moving average envelope. SPX is testing the very edge of this range once more as it tries to break free from both the channel and the MA envelope. RSI broke out of the channel and the MACD is struggling a bit.

Thesis
The current SPX pattern tells me a few things, but mostly this: a strong rally has met a strong resistance point. We're just underneath all time highs and right around an upward channel that needs a strong breakout. Every rally eventually gets tested like a final boss in a video game and SPX is rolling into the arena for that fight.
We're also in a low volume period in the market where anyone with some deep pockets can shove price action around much more easily than they could in a non-holiday period.
Cem Karsan argues that we get some more bullish structural flows after January 1 but that we enter a window of weakness after the next VIX expiration on January 17. The vanna setup seems to ready to push price higher if those flows come through.
Although I've picked up small bits of VOO in some of my retirement accounts (replacing SGOV), I don't have any trades on the board for SPY or any other SPX ETFs right now. I did have some short puts on the board for SPY, but I've closed those.
This isn't a spot where I'd like to be selling puts or calls on SPY right now. If I really had to sell puts, I'd be eying SPY's $451 area for an aggressive short put. There's positive vanna there and the 50-day MA is nearby. A more conservative bet would be to sell puts around $440-$445, but the premium is quite thin, even for February.
Good luck to everyone today. 🍀


Discussion