SPY and SPX outlook for November 1

Is SPX going to rally? What changed since last week? Let's dig into the data and get more details. 🔎

Welcome to November! 🍂 I'll do a deep dive into SPY and SPX today to see where the broad market might be going, especially with the VIX taking a dip yesterday.
All investments come with significant risks, including the loss of all capital. Please do your own research before investing, and never risk more than you are willing to lose. I hold no certifications or registrations with any financial entity.
Let's get underway! 🔎
SPY vanna
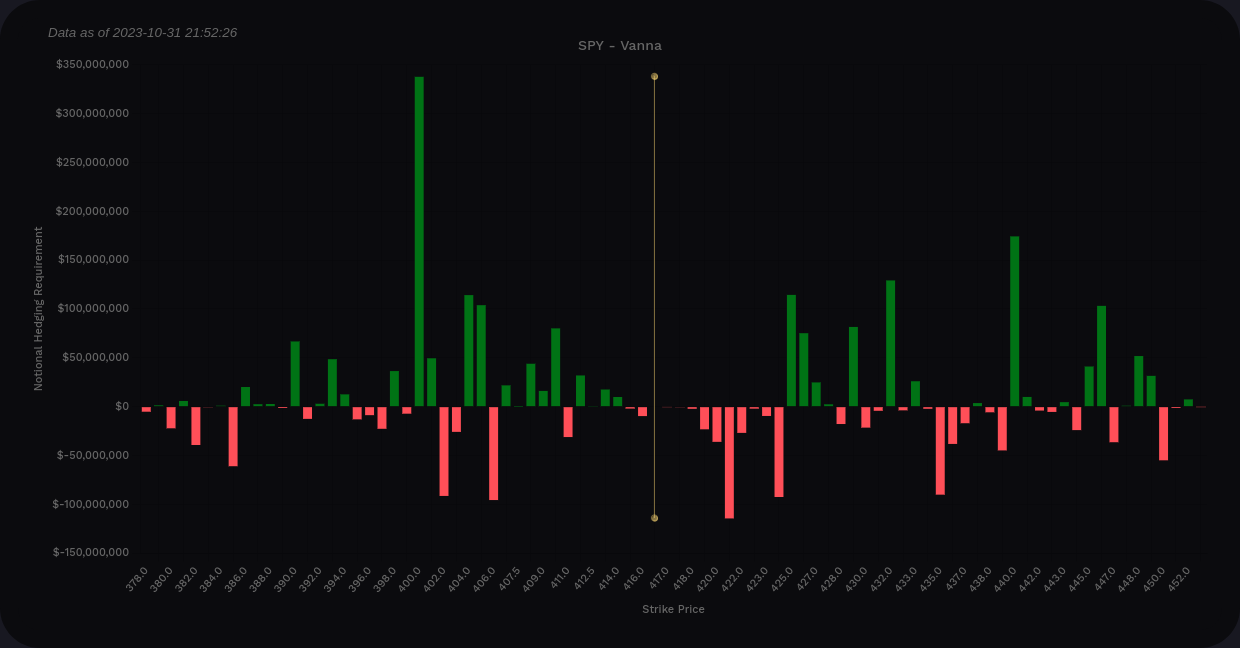
My first stop is a look at vanna for SPY over at Volland.
SPY's curve has changed a lot over the past few weeks. Overall, SPY has positive vanna at the extremes, which is bullish if IV continues to come down. The left side of SPY's curve (under the price) seems to have dropped a bit and the right side has strengthened. This seems like a bullish turn to me as that gives us more magnets above price if IV declines.
On the strikes themselves, the one that sticks out the most is $400. It looks like some decent support if price continues to decline. We have some potential magnets above the current price at $425, $432, and $440. Yes, $440 is coming back! 👏
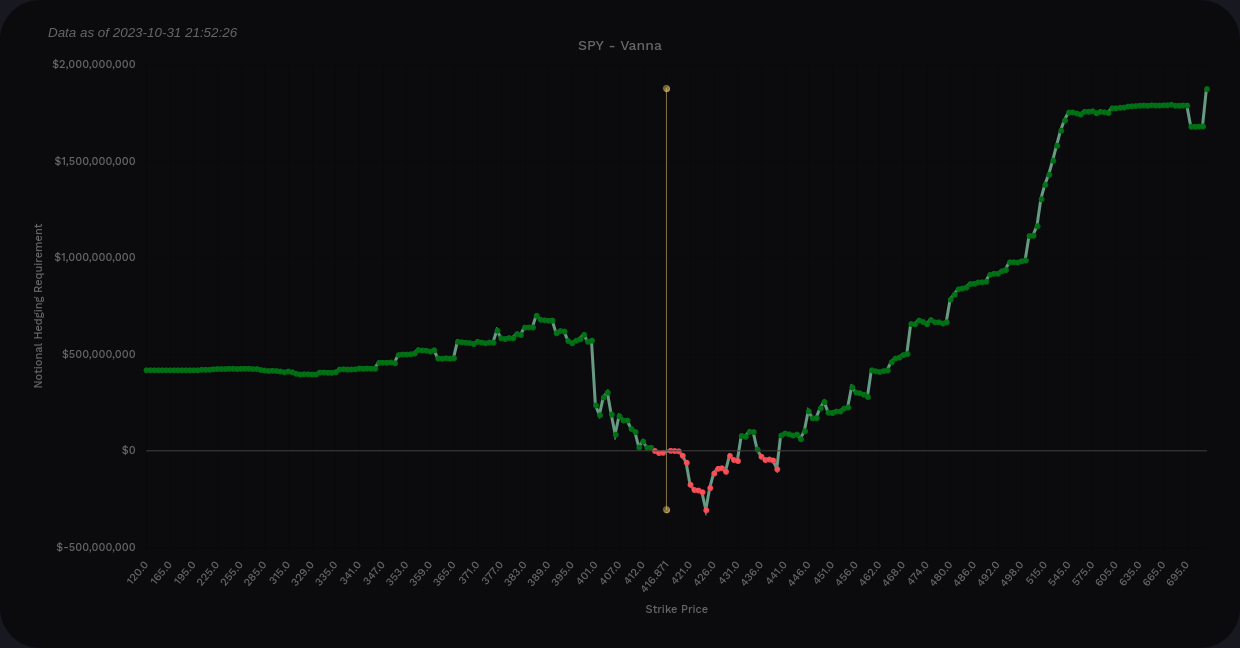
SPY aggregate vanna
Compare the curve above to the historical look at SPY from last week:
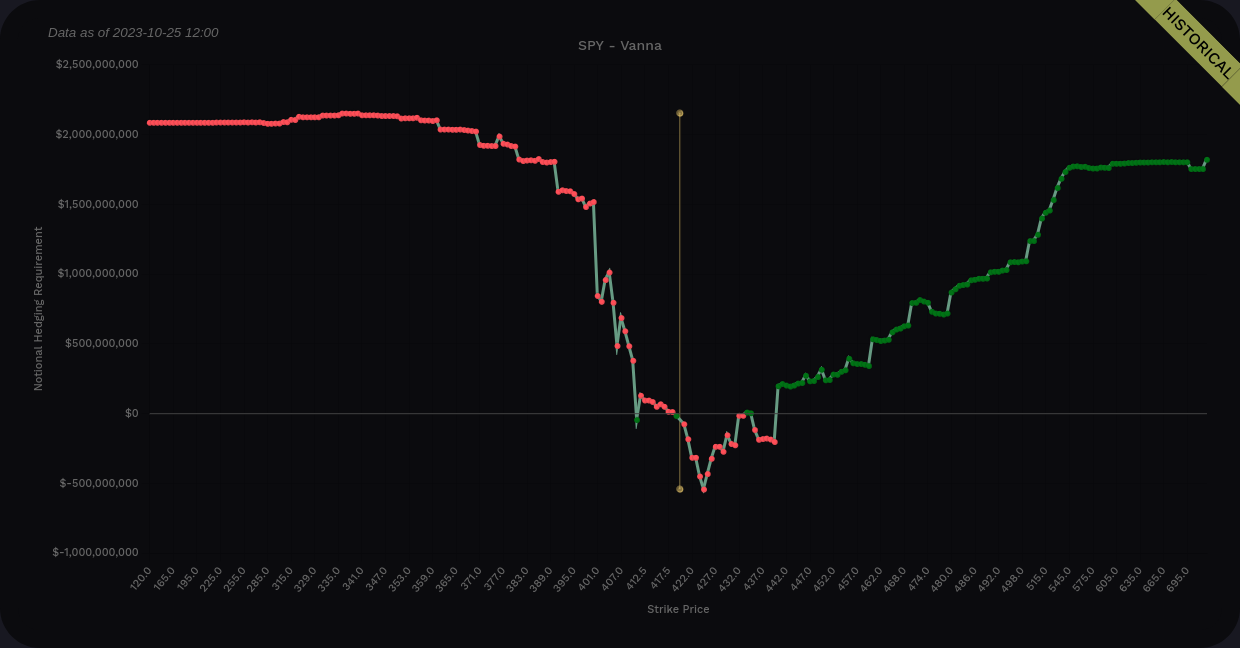
Volland's new historical views are extremely handy for situations like these.
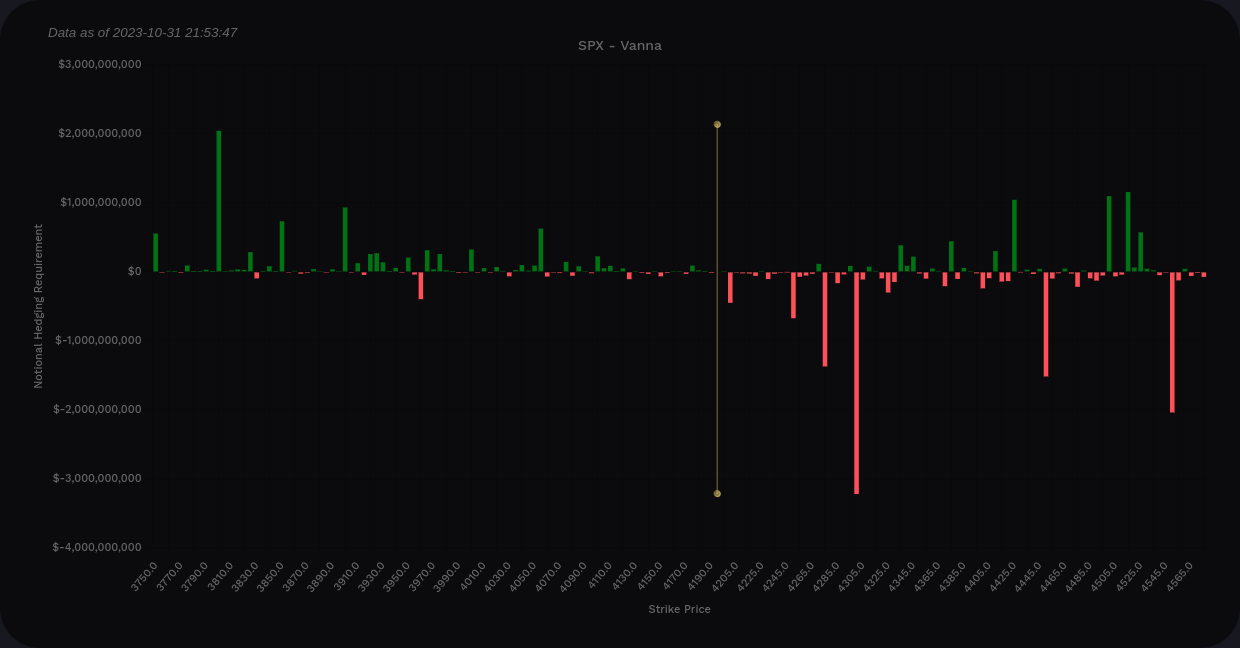
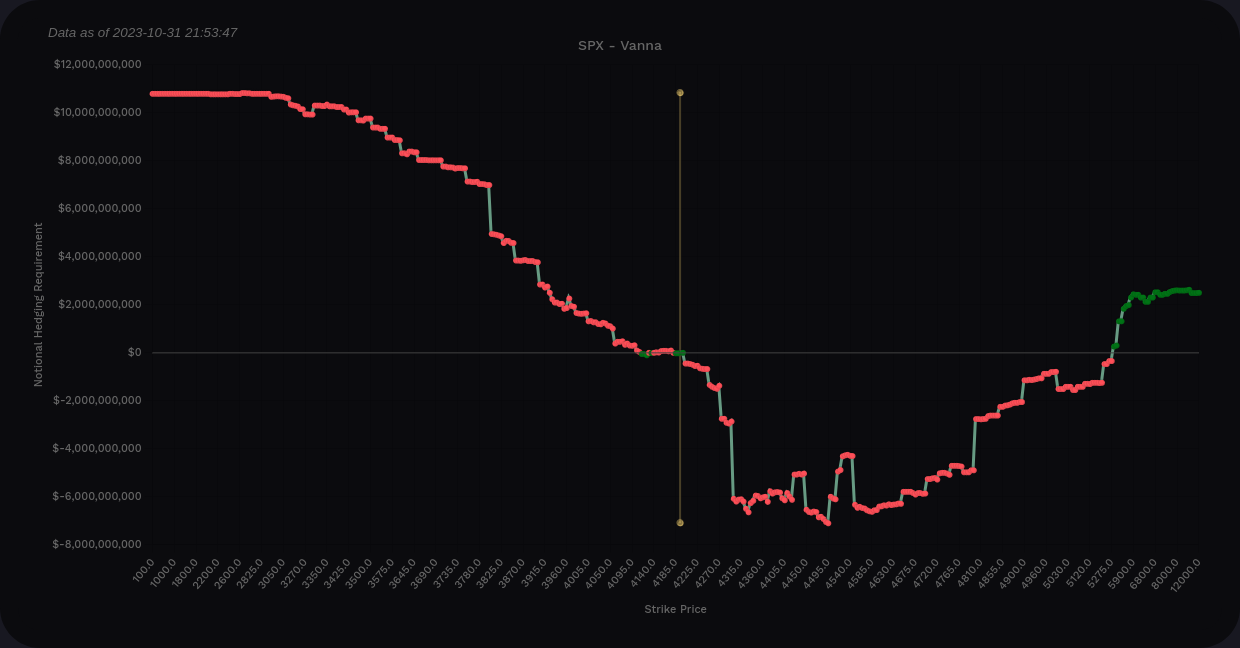
SPX vanna
Do we see the same patterns in SPX? Let's get a look.
The curve is positive overall, which is bullish as long as IV comes down. However, there's still a decent amount of negative vanna above the current price and the right side of the chart is significant lower than the left.
On individual strikes, the negative vanna at 4300 catches my eye first. There's also positive vanna below the price at 3800, 3850, and 3900. 4055 still has a small positive vanna bar as well.
Above the price, 4425 is the nearest tall positive vanna strike, but SPX must get past that 4250-4300 negative zone to reach it.
SPX aggregate vanna
Again, if we go back a week and look at the vanna curve, the right side barely crawled over the zero line. Note that much of the negative vanna pattern itself hasn't changed much but it's higher on the right side lately.
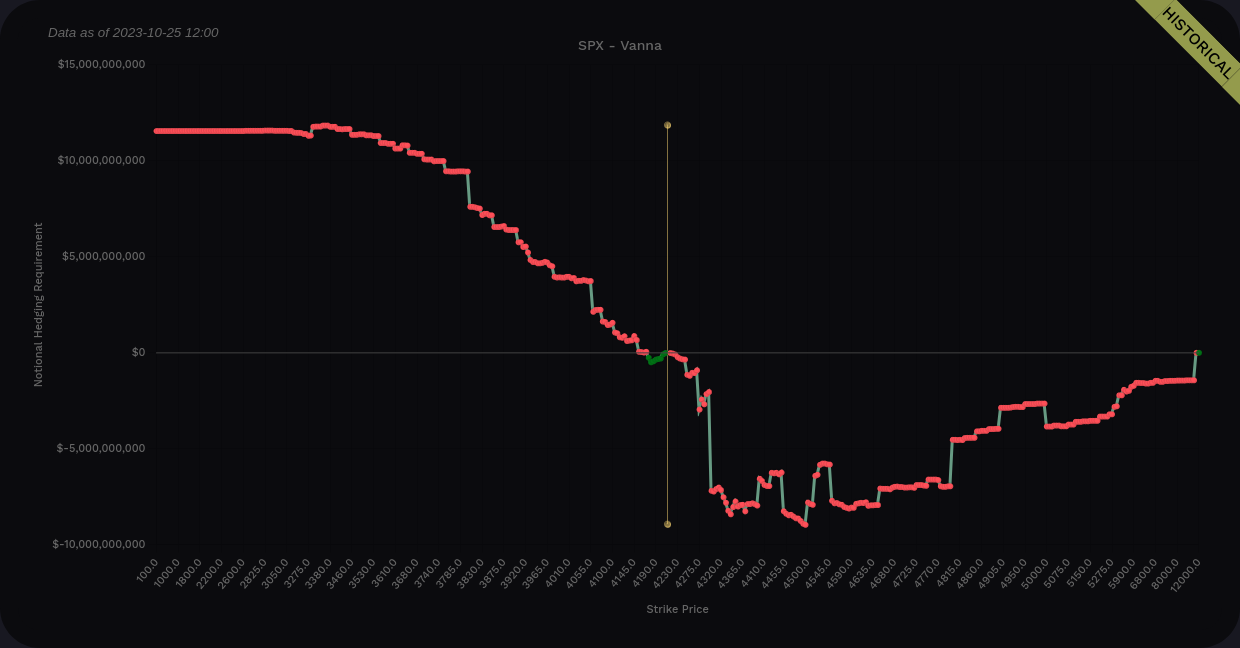
This strikes me as more bullish than last week, but SPY definitely has the more bullish chart of the two.
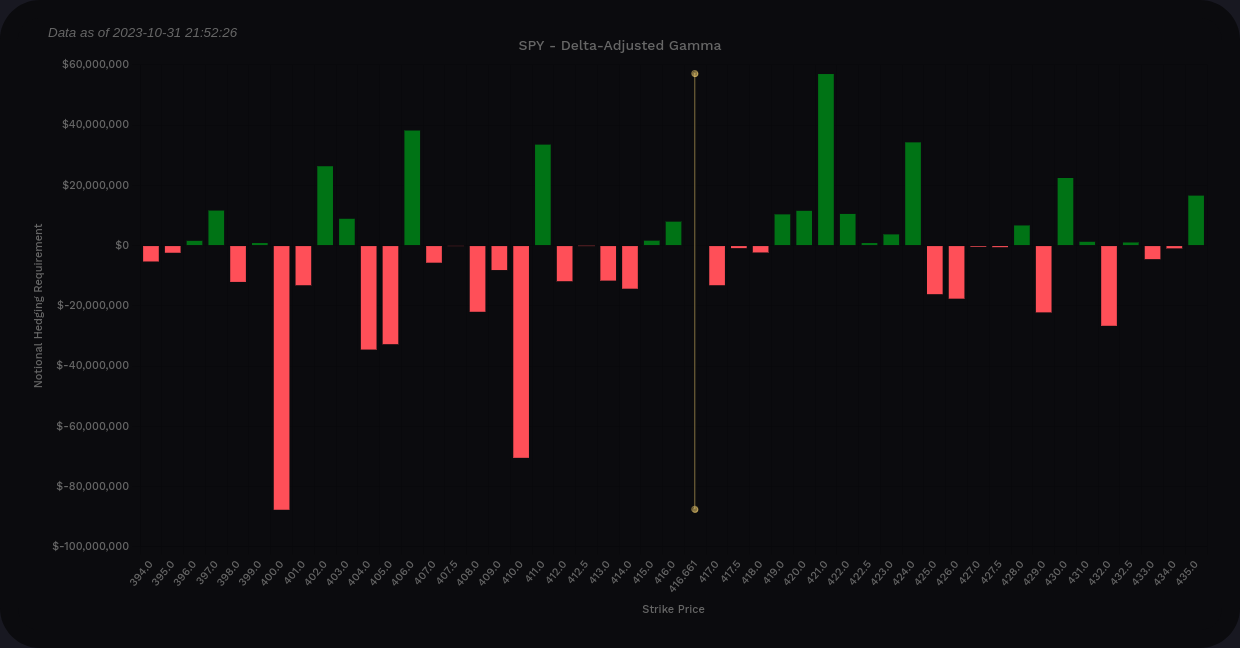
Gamma
I'll be using Volland's delta-adjusted gamma (DAG) charts here for SPY and SPX. First up, SPY's DAG suggests $421 might be a resistance point above price. Any moves down to $410 and $410 might add a little momentum to a move down.
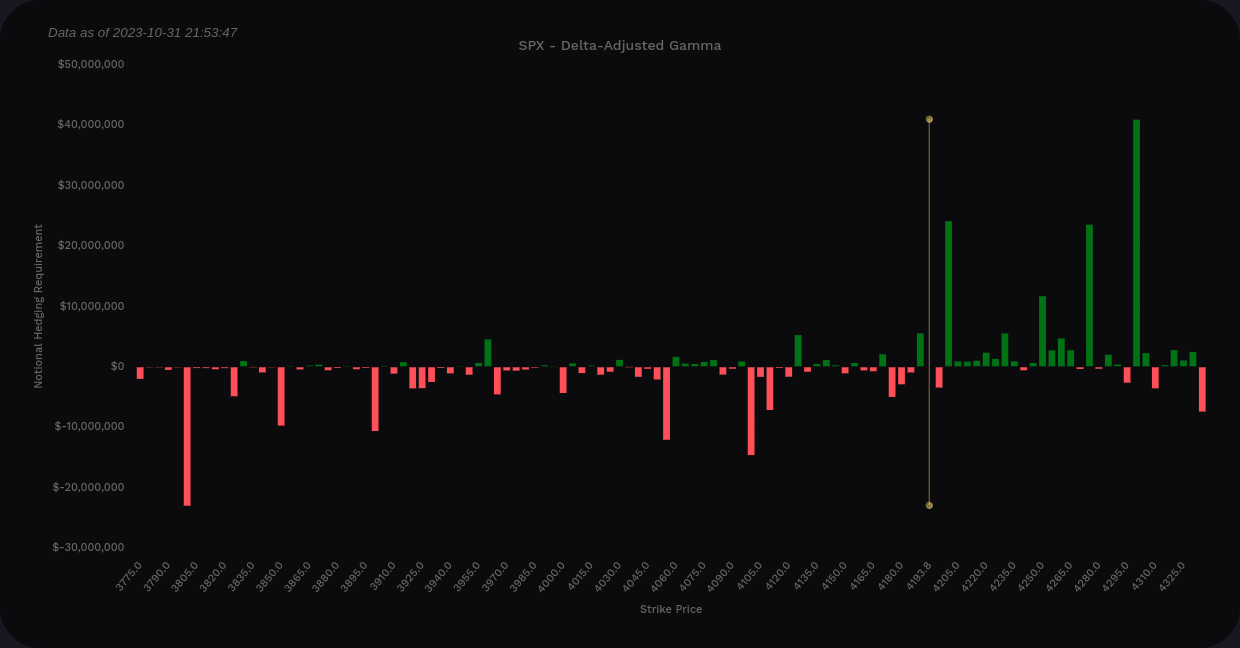
SPX has some resistance on the upside around 4200, 4275, and 4300. However, it doesn't look like there's much to slow SPX down from gamma to the downside. 3800 is the biggest negative gamma bar on the chart and I'm certainly hoping we don't need to visit that level anytime soon.
Chart
I'll focus on the SPX chart here since it's very similar to SPY's. At the moment, we're bouncing off one of the two order blocks from May 2023 when the rally began. Price is moving into the equilibrium zone (from ICT concepts) and that's the grey zone on the chart. Note that price moved through one order block and came back up, but the other order block still remains below.
SPX has two order blocks on two different time frames (4h/1d) from 4340 to 4400 that it needs to break through to keep moving higher. Vanna and gamma suggests we might run into some problems before that level.
Bullish traders will be happy to see a bullish fair value gap around 4140. I see these as signs of strong rally but these gaps might be filled later. If I see a series of these as price moves up, I begin to believe in the rally a bit more.
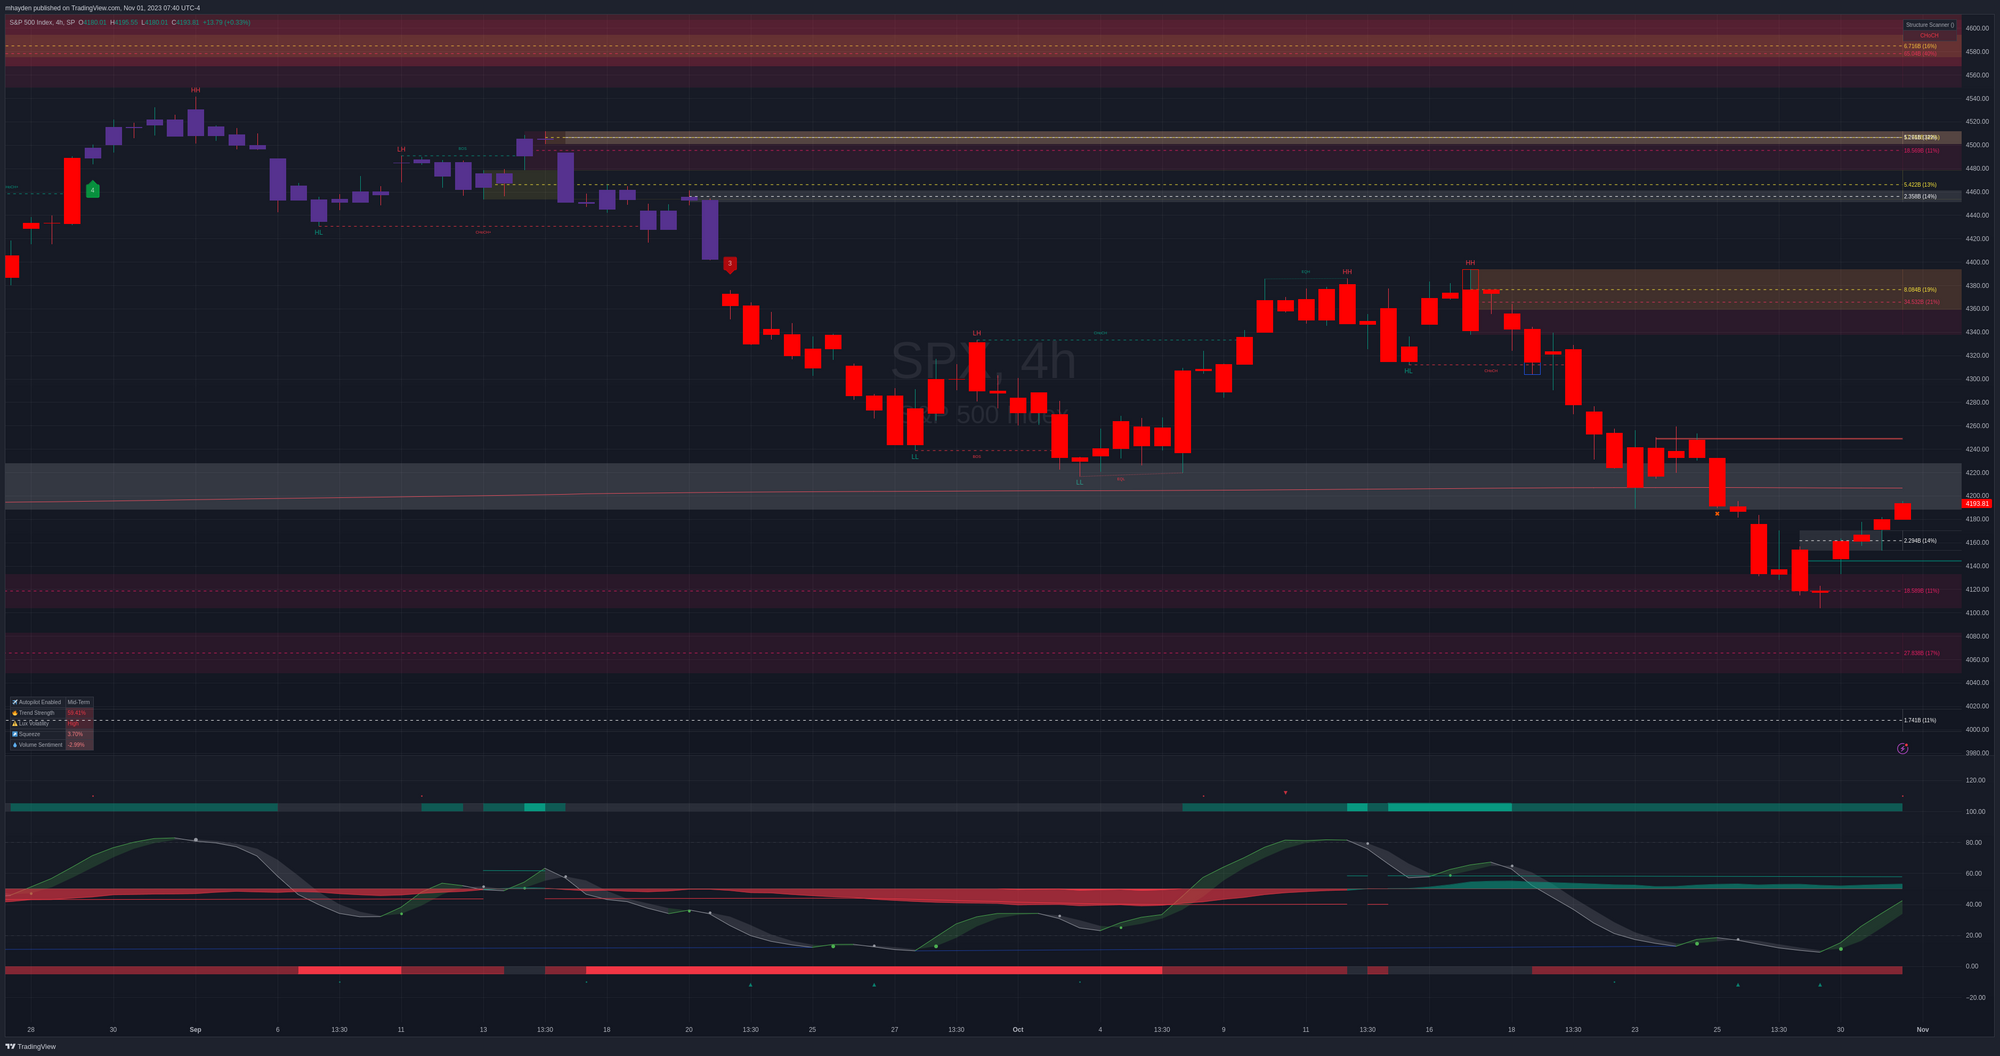
The oscillator at the bottom of the chart has two bullish contrarian signals back to back and that's something that gets my attention. The oscillator wave is rapidly headed back to the zero line.
Thesis
All of this leads me to think that we might be seeing the first signs of a rally, but we've seen some of these weak rallies followed by a lower low lately. However, I like this rally more than the others because:
- SPY's vanna has turned more positive with less negative dips above price.
- We're starting it with positive money flow in the oscillator, two tight bullish contrarian indicators, and a bullish fair value gap. The rally in earlier October was much messier.
- SPY fell through the COVID low VWAP but seems eager to retake it.
- SPY reached a strong technical level during this dip (the order blocks from May) whereas previous levels weren't as consequential.
There are still a decent amount of question marks in play, especially with FOMC interest rate decisions and USD/JPY turmoil. We also have more than one serious international conflict underway that have potential to spread further beyond their current borders.
I have a 12/15 $400p/$439c short strangle on SPY right now and it's down a bit. That one was sold a little early as volatility was still climbing, but I anticipate that the VIX coming down will help both sides come down. My overall beta-weighted delta across my portfolio is nearly even at the moment.
Good luck to everyone today! 🍀
Discussion