TSLA stock and options analysis for December 5th
TSLA's price looks primed for another big move, but in which direction?

Happy Tuesday! It's been a while since I've taken a look at TSLA data and today seems like a good time for another look. TSLA has tightened down into a narrow range since July and seems primed for a big move up or down.
All investments come with significant risks, including the loss of all capital. Please do your own research before investing, and never risk more than you are willing to lose. I hold no certifications or registrations with any financial entity.
Let's see what we can dig up for TSLA.
Vanna
Most of the stocks I track have vanna curves that look similar in one way or another whether they're bullish or bearish, but TSLA is an outlier. It's had some of the weirdest looking vanna charts in 2023.
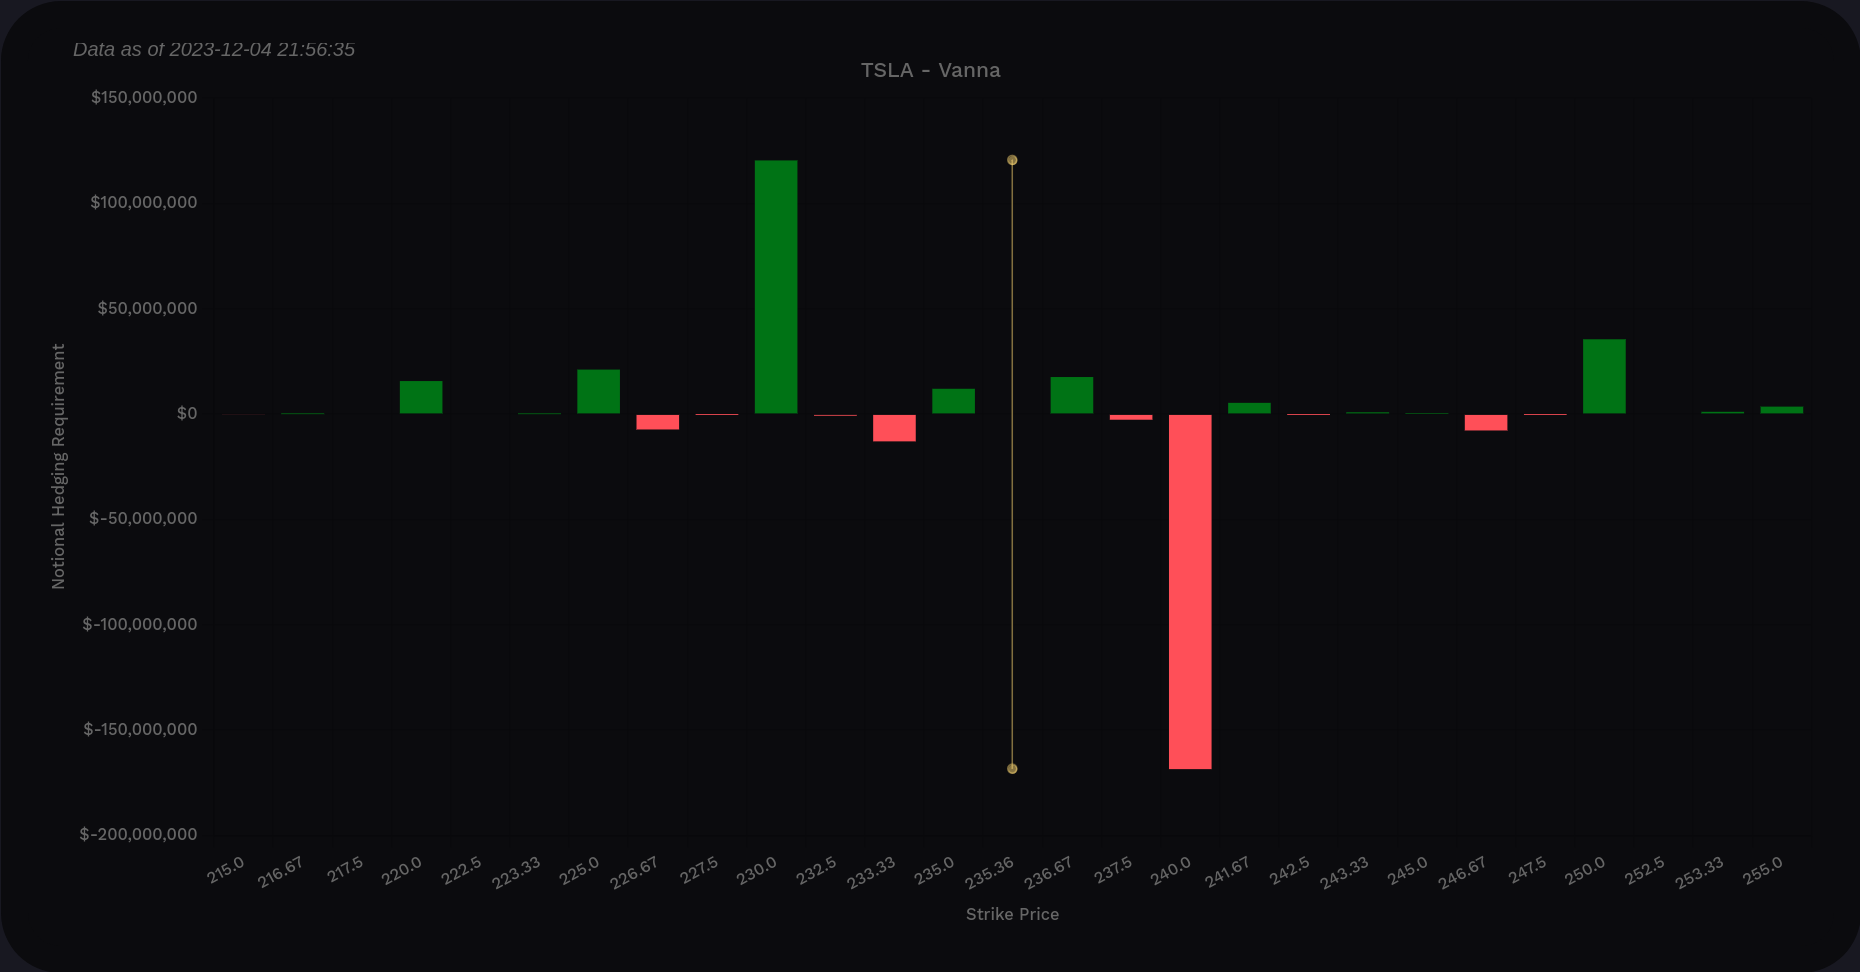
Volland's vanna curve shows a bearish tilt for TSLA. There's very little positive vanna above the current price to become a magnet for a move up. In fact, the only big positive vanna line shows up at $230 and could be a support level if price moves down. $240 is a big negative vanna level that could repel the price if it moves up.


TSLA vanna from all expiration dates
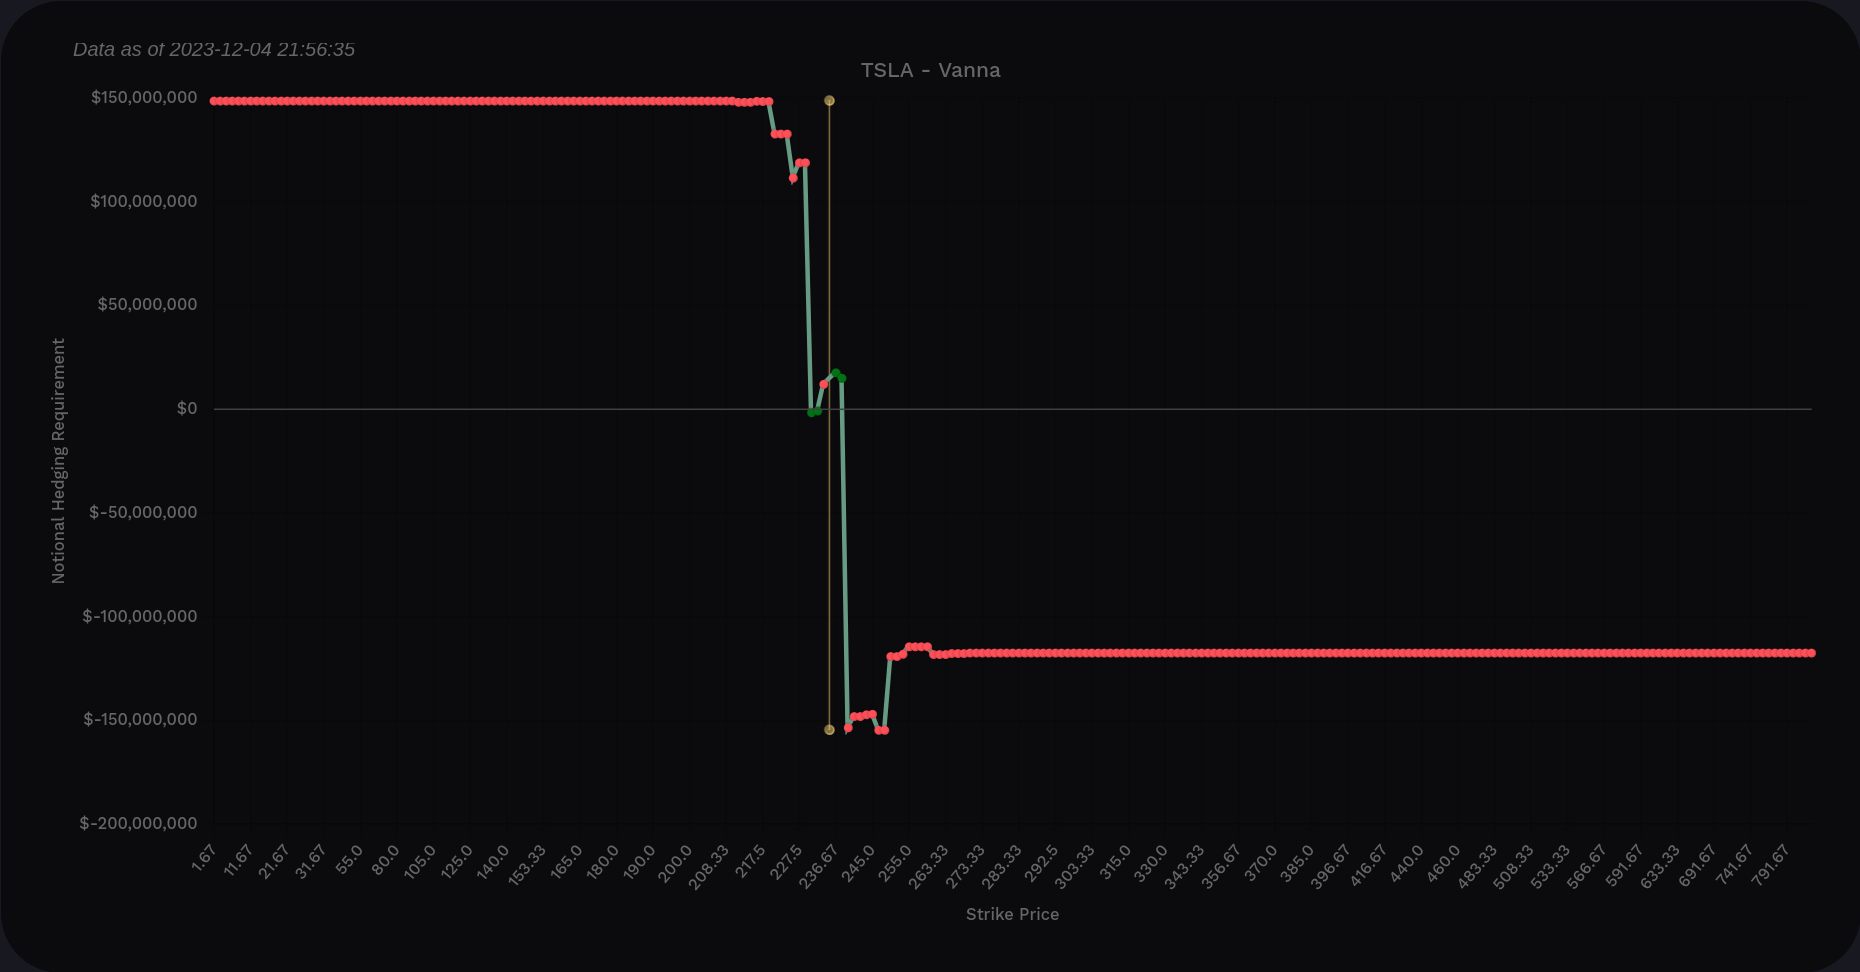
Most of my trades are focused on now through 1/19, so let's see if the vanna through that date makes more sense:

Not really. We have some positive vanna just under $237 but then there are two big negative vanna lines pinning us in between $233 and $240.
So there must be something special about this $230-$240 range. Let's make a note of that for later. ✍️
Gamma
Volland's delta-adjusted gamma (DAG) suggests dealers will sell around $230 and buy around $240. This could fuel TSLA to make a decent run out of its current narrowing channel.

Also note that the effects of gamma seem to be relatively strong for TSLA right now. Vanna levels top out around $150M and gamma is almost at $40M. These are usually a lot further apart. This suggests to me that gamma might have a larger effect on price than it normally does.
Institutional trades
Volume Leaders is a great tool to find institutional trading levels but you must determine which direction these traders are going. As a reminder, the number inside the bubbles represents the rank of the trade among TSLA's biggest trades.
The biggest level shows up around $232. That's in our $230-$240 range. More recently, we've seen the #6, #11, and #17 trades around $260. #7 was a high one right around $280 and the stock dropped after that.

It seems like institutions are bullish around $200 and perhaps a bit bearish around $260-$280.
Chart
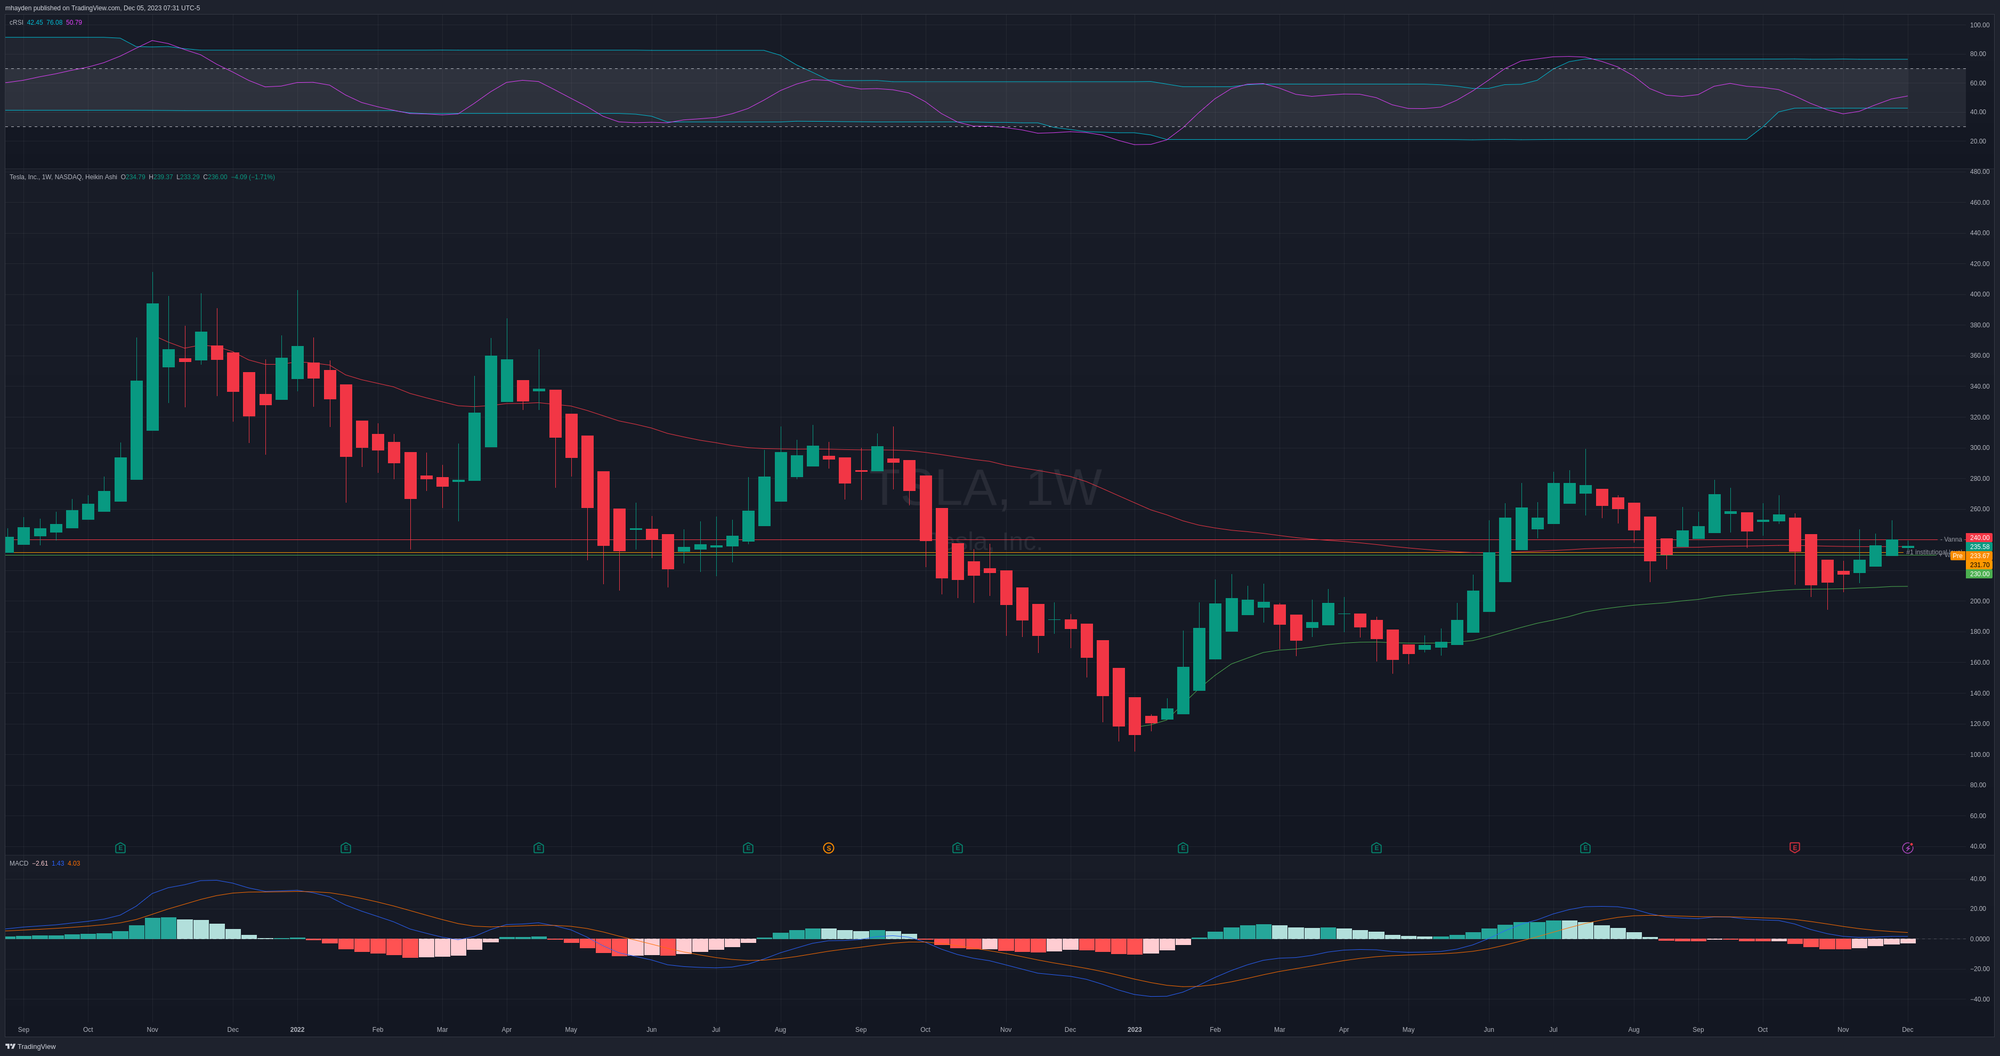
TSLA's weekly chart is trapped between two VWAPs and the cRSI is on the lower end of the current channel. The MACD is above the zero line but the histogram is slowly turning less red. All of this suggests TSLA has room to run.
If TSLA makes a move down, we have some support around $210 from a VWAP line coming up from the early 2023 lows.

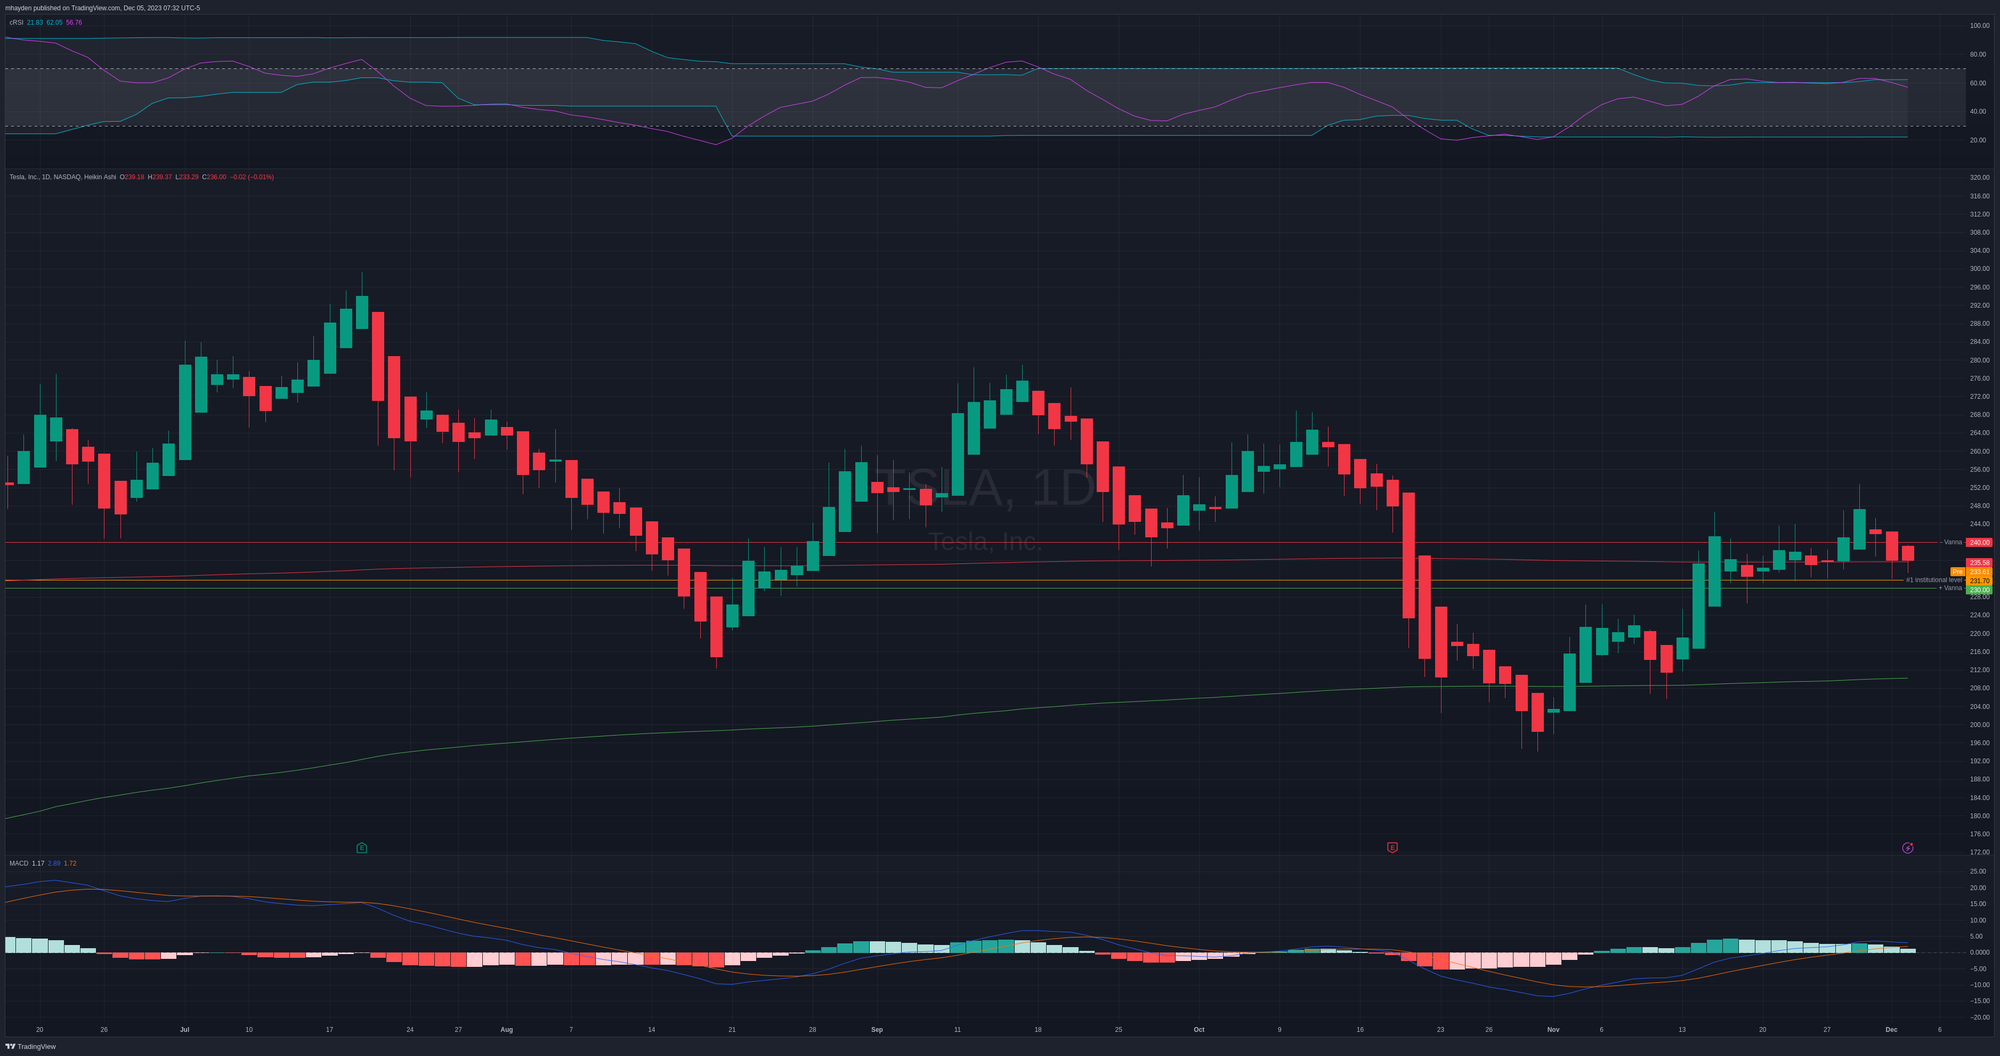
Dropping down to the daily gives us a very different view.
Our cRSI is very near the top of the channel and is taking a turn downwards. The MACD is positive for the moment but also looks to be taking a turn to the downside.
How about the VWAP lines? Price is resting on the VWAP line that comes down from the all time highs and the line from the early 2023 low sits around $210. TSLA broke above the top VWAP line recently, but can it hold there?

Thesis
Vanna suggests we're stuck between $230-$240 for a while, gamma suggests we could get a run in either direction, and the longer term chart view says we have room to run up or down. Either way, TSLA's price is really coiled up recently and it's riding on a support line down from the all time high.
Institutions are really interested in the $230 level and TSLA has popped above that level twice recently after falling through. It's been a strong support level since mid-November.
My current TSLA cost basis is $217.88 and I have a covered call sold for 12/15 at the $230 strike. If I'm assigned there in about 10 days, I'll secure that profit. I'm also short the 1/19 $210 put and that's a bet on the VWAP line holding strong. TSLA respected that VWAP line in late September when the whole market stumbled.
Good luck to everyone out there. 🍀


Discussion