Deep dive into TSLA options and stock data for September 8

TSLA remains difficult to read and it seems like traders are making very short or very long term bets on it. Let's dissect the data. 👀

Happy Friday! 🌄
Quick reminder: Next week's expiration on 9/15 is a quadruple witching date. The big takeaway here is that weird things happen around these dates that can be fairly surprising. Big options traders and market makers start rolling contracts to later expiration dates as we get closer.
Watch out for your position sizing going into next week. 😉
All investments come with significant risks, including the loss of all capital. Please do your own research before investing, and never risk more than you are willing to lose. I hold no certifications or registrations with any financial entity.
Let's take a look at TSLA today. If you're looking for AMD information, go review yesterday's post. 🚀
Options flow
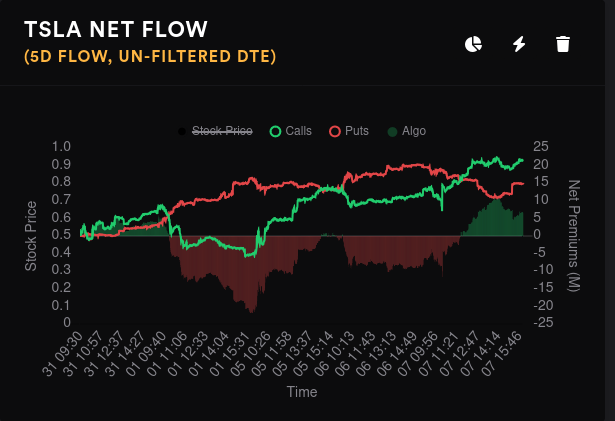
The flow was bullish yesterday with puts trying to creep in slightly in the late afternoon. On the five day, bullish premiums crossed bearish ones for the first time in a while.
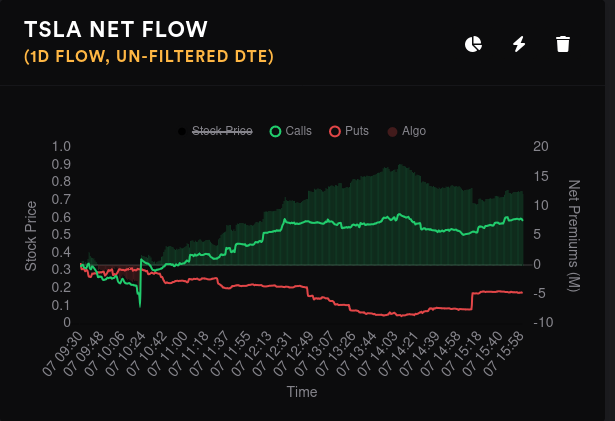
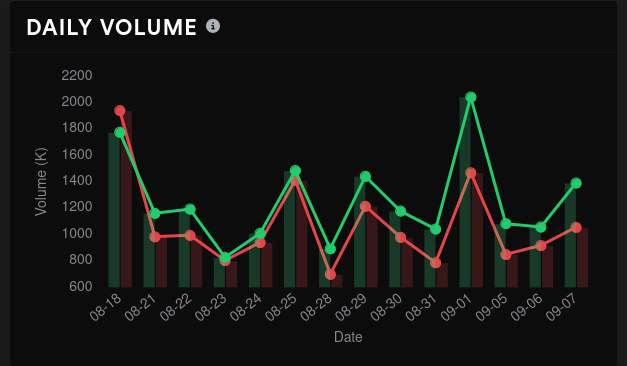
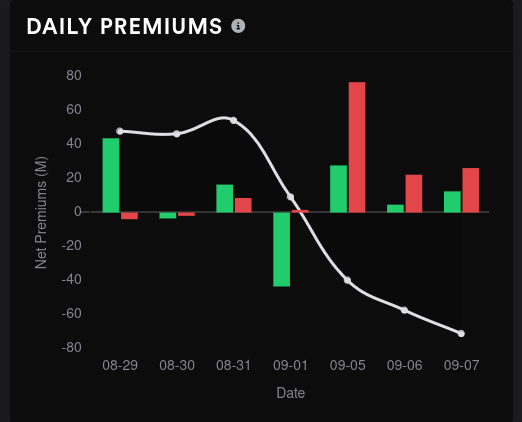
Options volume increased yesterday after dropping from the 9/1 peak. Premiums have come down after the call selling on 9/1.
Vanna
The simplest explanation of vanna is that it measures how much deltas move around based on changes in volatility. As volatility changes, dealers find themselves sitting on options contracts with rapidly changing deltas, which can lead to them having directional bias – which they definitely do not want. This forces them to buy or sell shares to remain dynamically hedged.
Trading with vanna means looking for spots where there's a big pile-up of vanna on certain strikes and then making educated guesses of what dealers will need to do near those levels. 😉
Let's start with the aggregate vanna first:
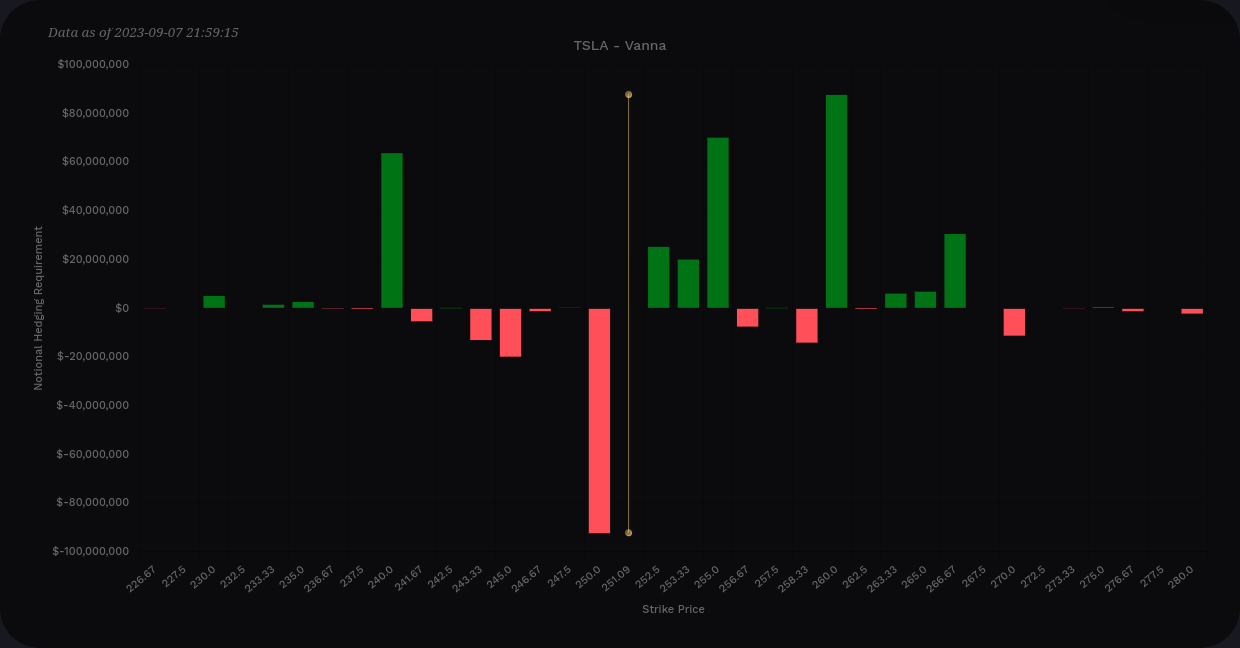
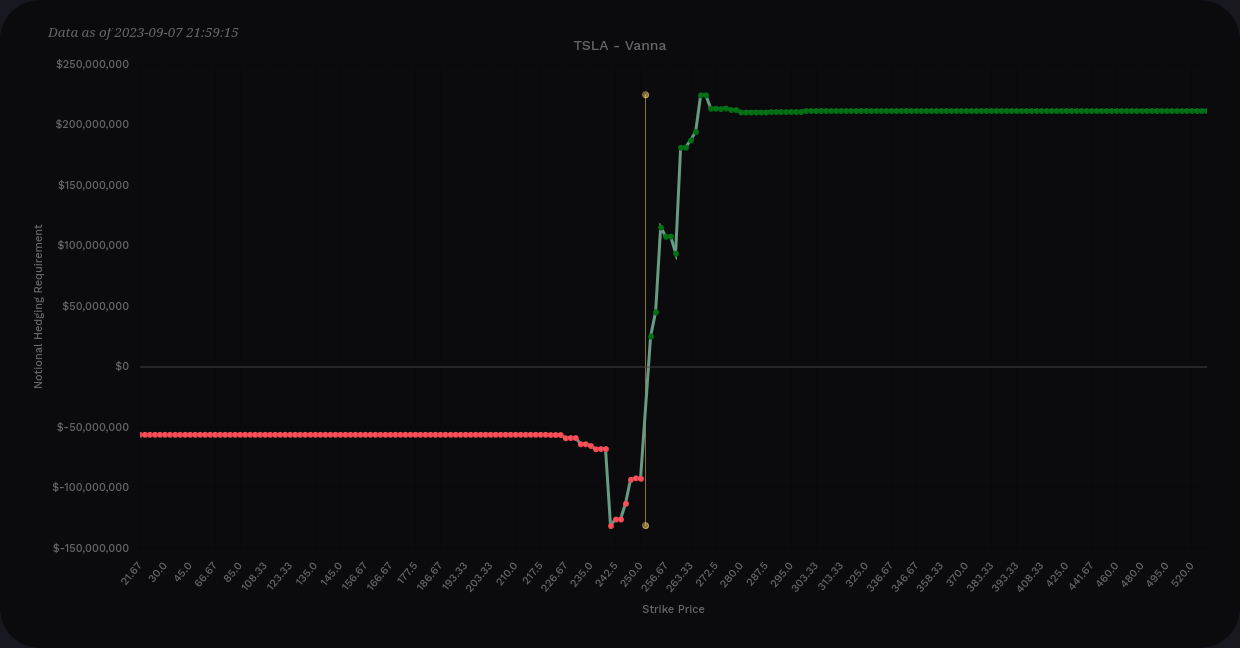
The curve shows that we have almost 4x as much positive vanna as negative at the extremes. On the detailed bar chart, our biggest positive vanna level above price is $260. The lowest positive vanna level is around $240. If IV were to contract on TSLA, a run approaching $260 seems entirely possible.
If we do fall to $240, the biggest negative vanna line at $250 would flip positive and we would have three big vanna levels above price that are all positive. This could have the potential of a dip-then-rip, scenario, but I want to check more data first.
Let's crunch the numbers between this 9/8 and 10/20 only and see what we get:
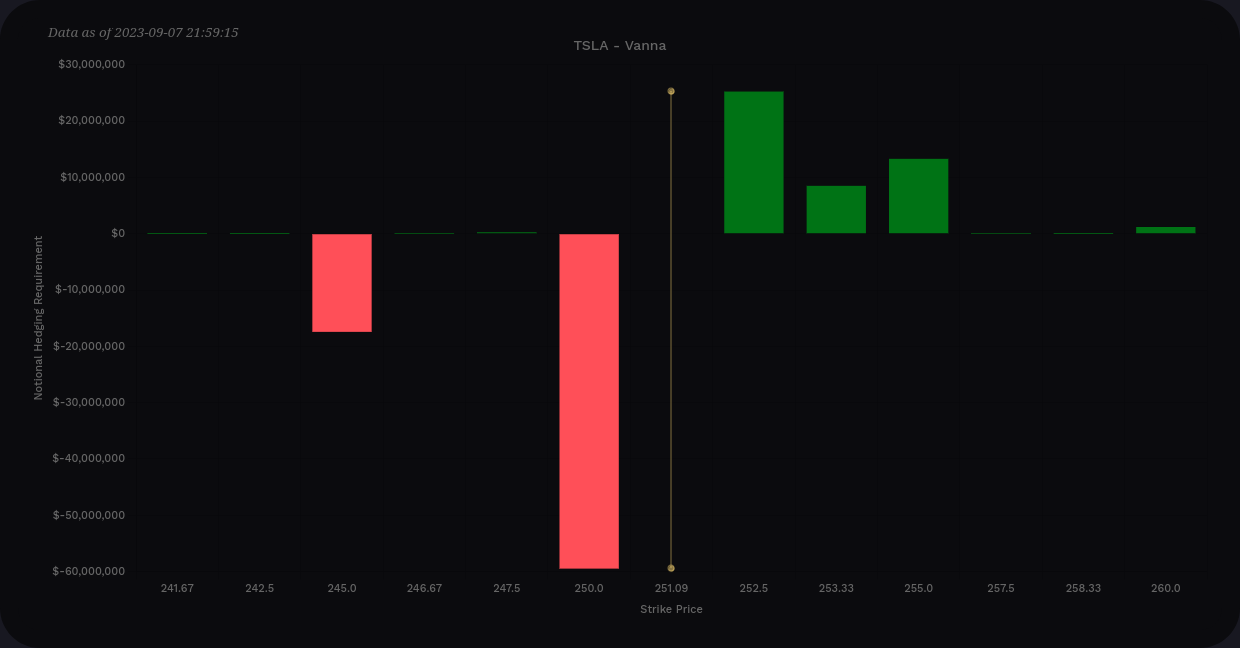
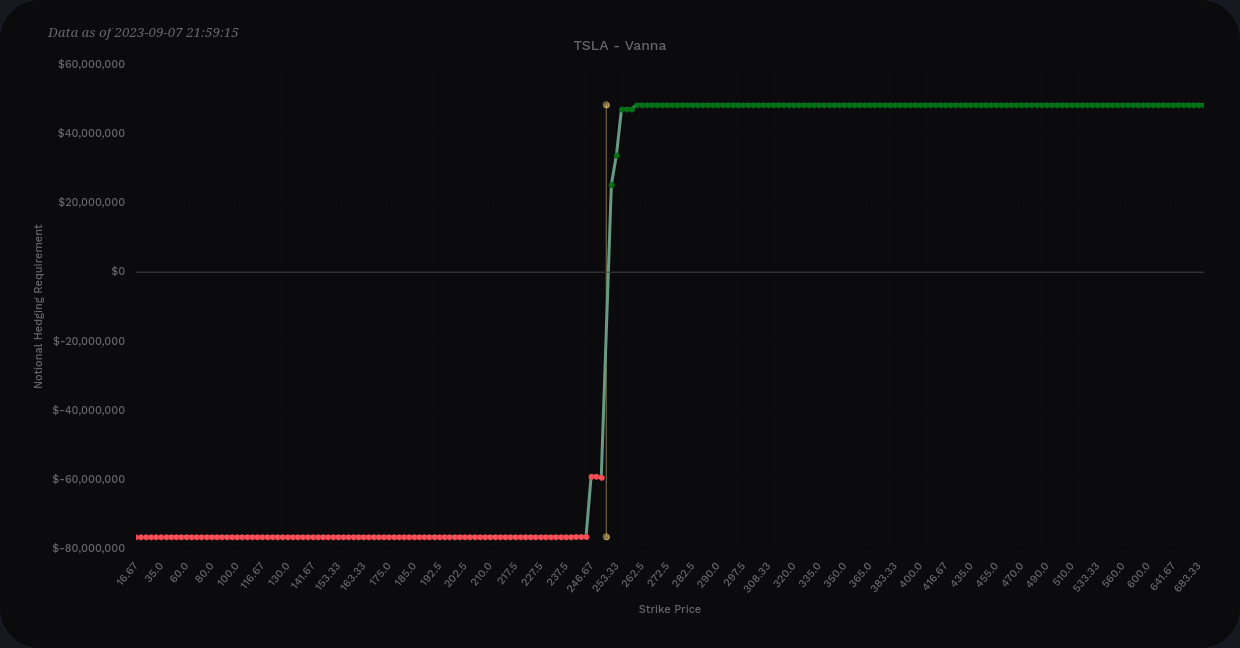
Negative vanna here wins out at the extremes by about 1.5x. Our big $250 negative line is still there, but our positive gamma lines are fairly short and very close to the current price. IV contraction might pull us a bit, but I doubt it.
If we somehow get some IV expansion from CPI next week and fall to $245, $250 suddenly turns green and we have mostly positive vanna here.
Gamma exposure
Reading GEX is tricky here because traders have piled so heavily into 9/8 that it skews the data heavily:
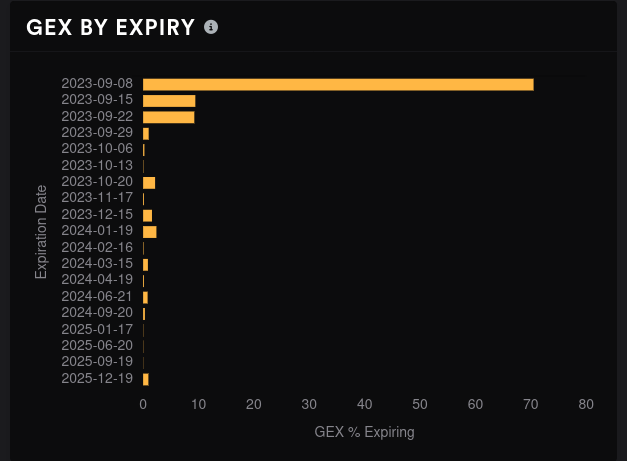
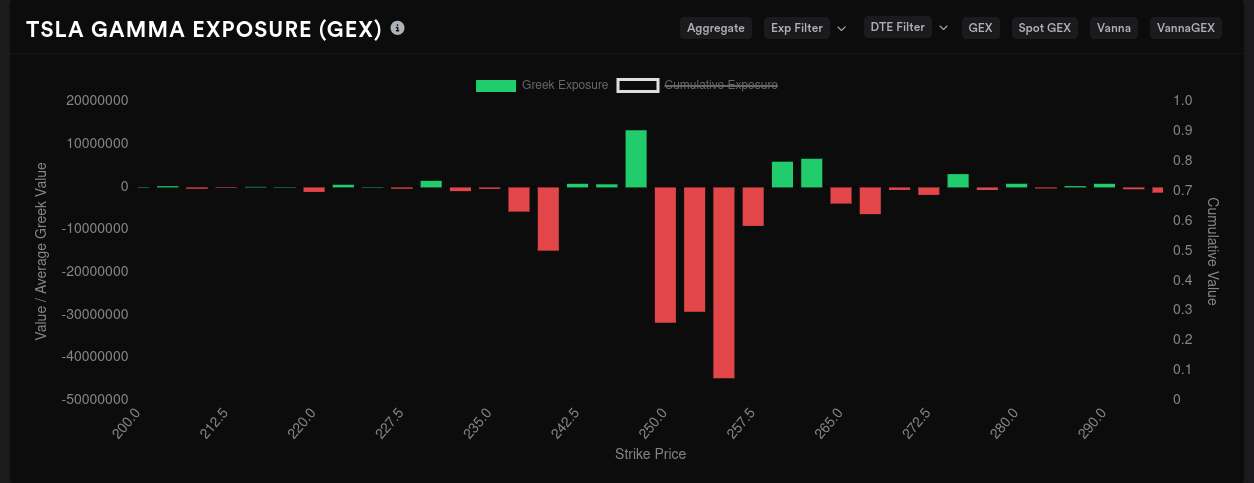
The aggregate GEX across all available expiration dates suggests $250-$255 as the biggest price magnets with some decent resistance at $260. This matches up with the vanna chart where there's not much help past $260.
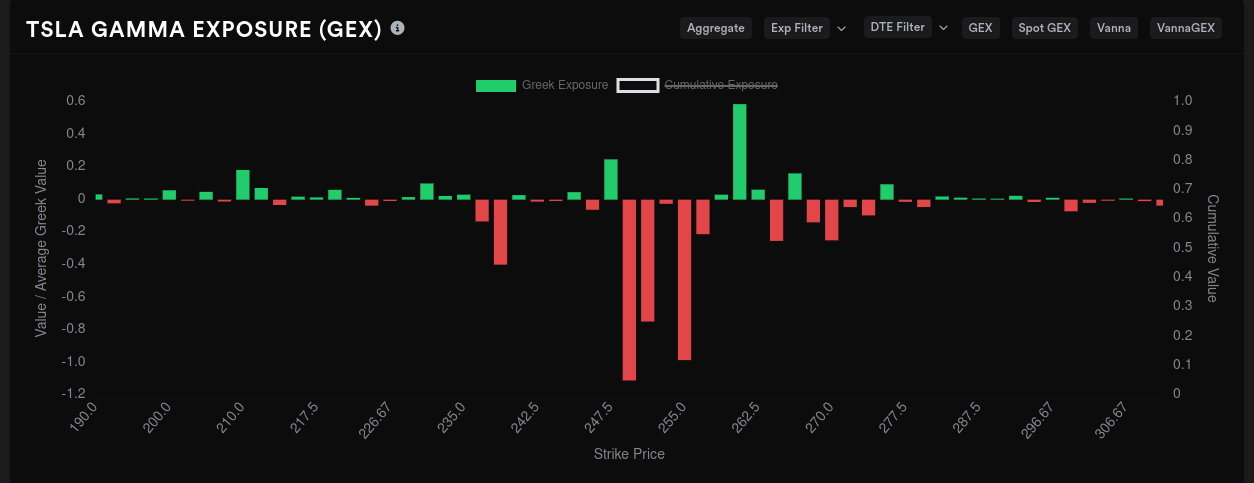
9/8 is the biggest GEX expiration date and it looks like $250-$255 is definitely the target. $240 is possible, but it's going to take some work to push down there.
9/15's magnets show up at $250 and $270. That $270 level has fluctuated in size a lot over the past few weeks but it's always been a standout.
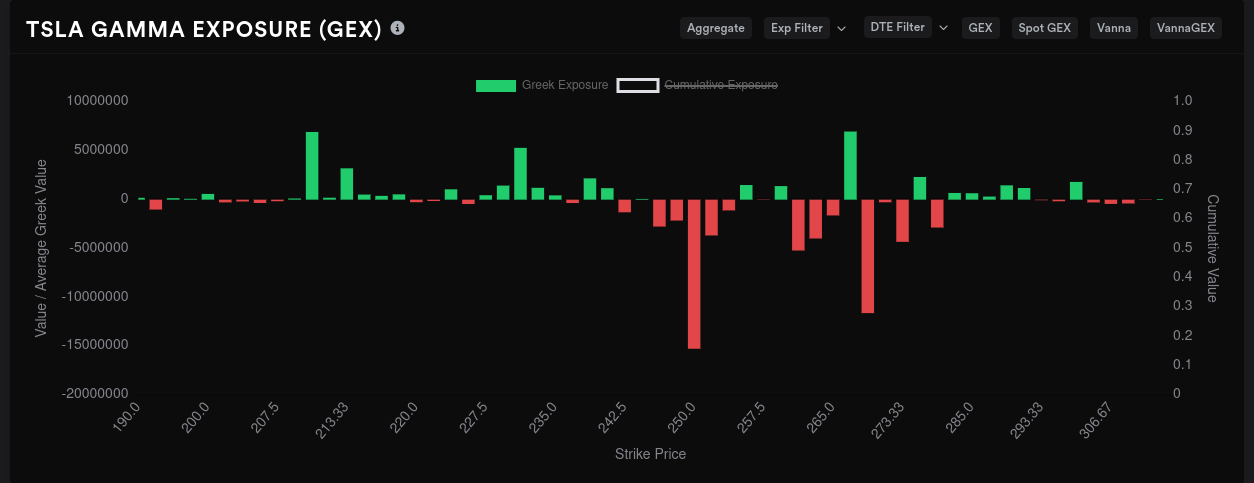
10/20 is still a ways out and the data here is pretty messy. $220 looks to be a likely downside support level with a range of $230 to $290 as magnets for price. That's not terribly helpful.
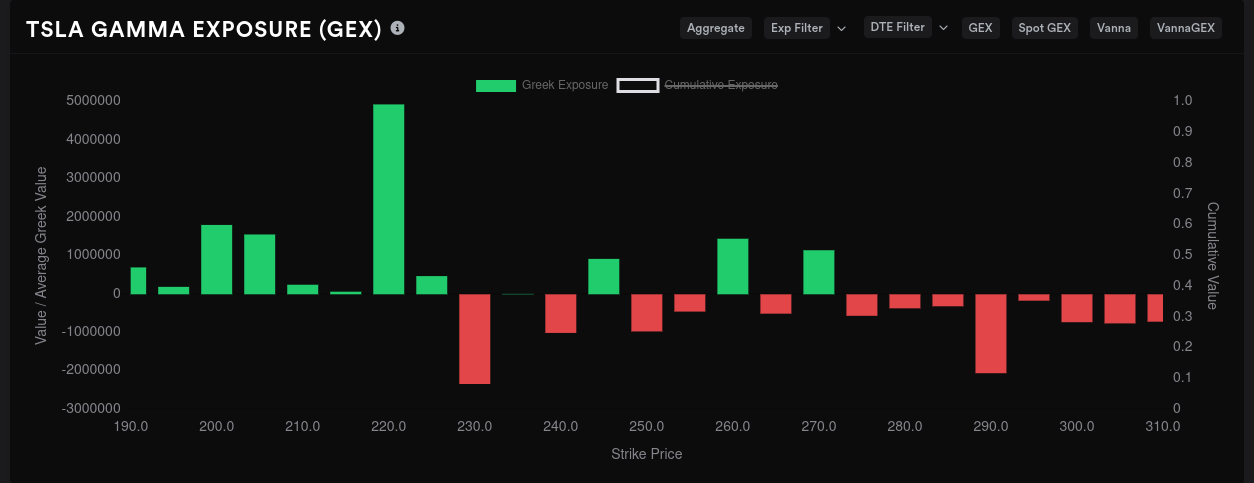
So GEX is telling us that $250-$255 is a hot zone for price and that lines up with our $245-$260 vanna levels, too. This might be a good range to play.
Whales
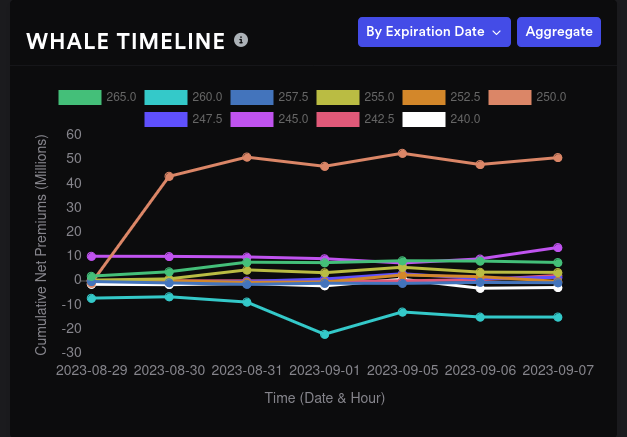
Across all expirations, the big options traders are quite bullish about $250. That's almost $51M in premiums on that strike. 🤯 This shows up across multiple expiration dates through the remainder of 2023.
Chart
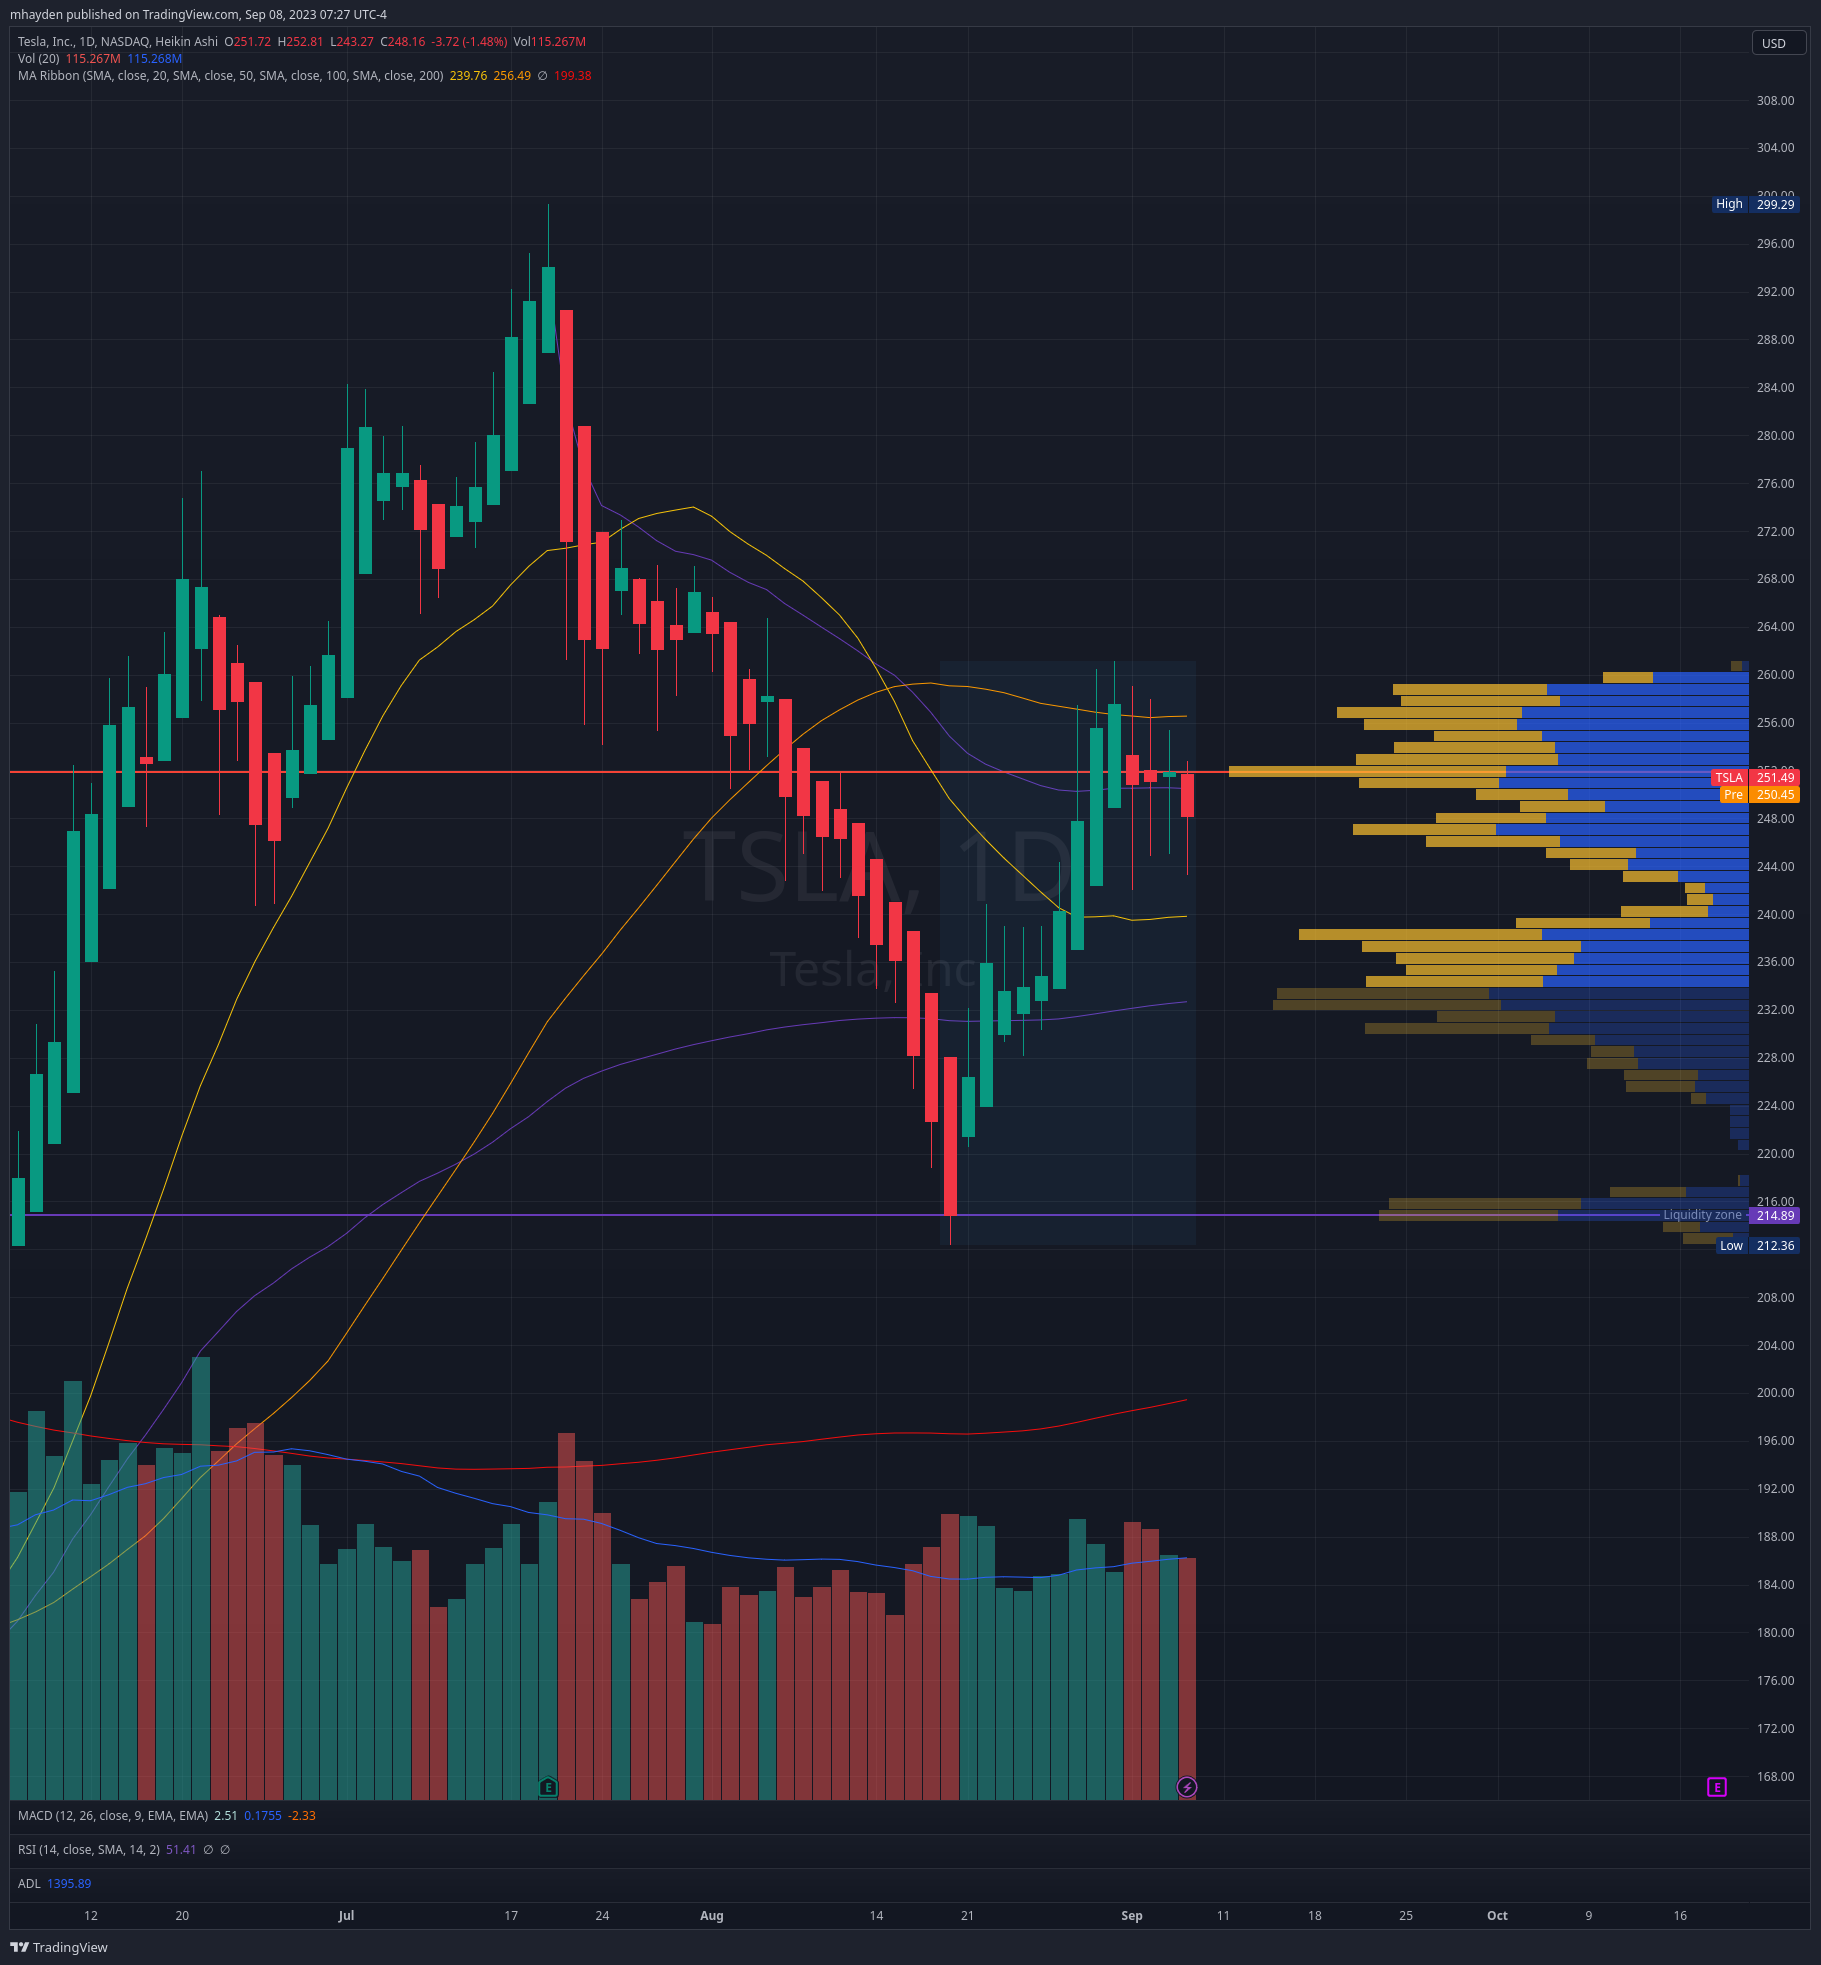
TSLA's daily chart shows that the highest volume since the most recent dip is atound $252. The VWAP from the recent high is also down here around $250 as well. The 50MA line is just above $256.
There's a decent volume shelf from $230-$240 which could provide support on a dip and those levels were important on the vanna/GEX data, too. We're in the middle of a high volume zone right now.
Thesis
TSLA seems to be stuck in a $250-$255 range based on the data I can find. It's totally possible that the boundaries of that range are really a little further out to $245 and $260.
One of the challenges of judging TSLA right now is that most people seem to be playing it on weekly expirations or on contracts that are months or years out. TSLA has tons of vanna wrapped up in a 2025 LEAPS contract and tons of GEX in this week's 9/8 contract.
I'm playing TSLA fairly conservatively with a $220/$290 short covered strangle for 10/20 right now. I also have a short $255 covered call that expires on 9/15. I'm happy with that call there because it's at the top of the smaller TSLA range. My trades are always updated on Theta Gang.
Good luck to everyone today and have a great weekend! 🍀 🌴
Discussion