Checking back in with TSLA on December 15

TSLA looks like it's building a base for a move higher, but how likely is a rally? Let's use data to get an edge. 📈

Welcome to the last OPEX day of the year! ⛅ I haven't looked at TSLA in a while so that will be the subject of today's post.
All investments come with significant risks, including the loss of all capital. Please do your own research before investing, and never risk more than you are willing to lose. I hold no certifications or registrations with any financial entity.
Let's get into that data! 🔎
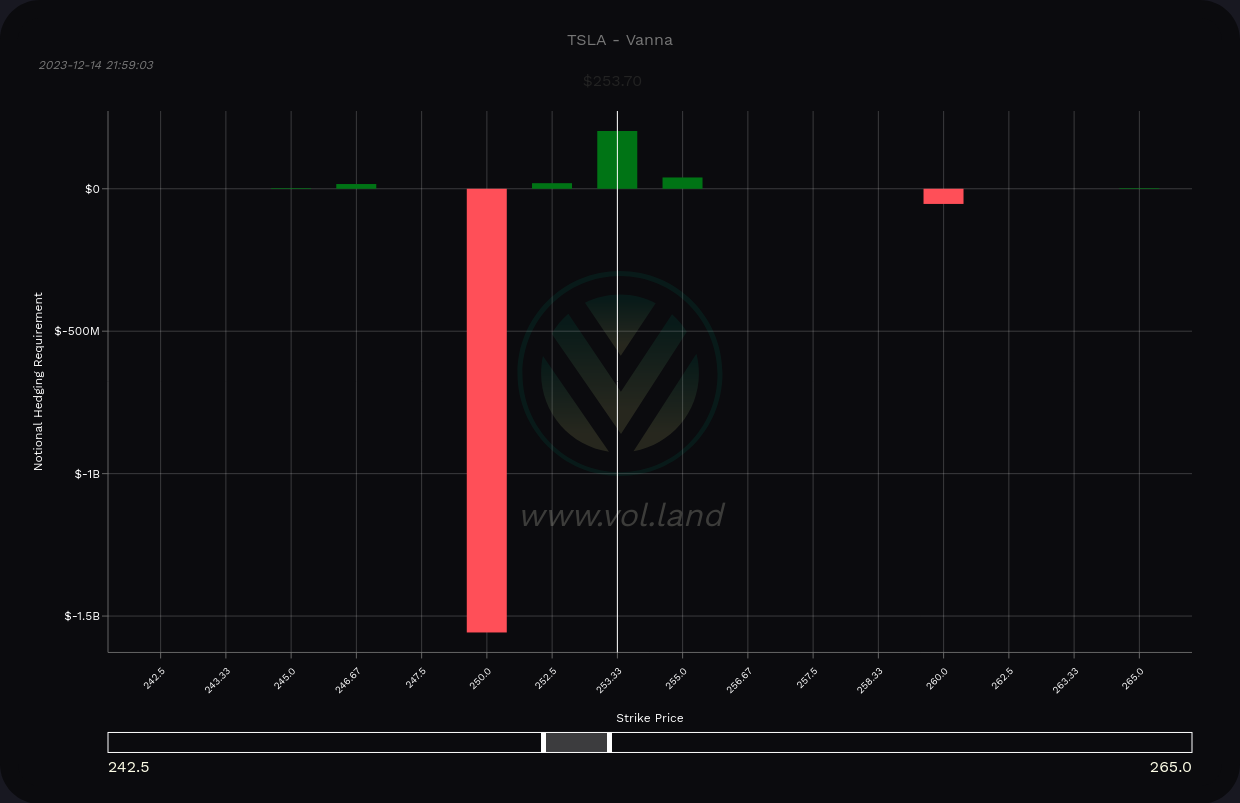
Vanna
Volland changed up their charting controls and I'm still getting used to them. 🥴
TSLA has a massive negative vanna bar at $250 and it's really the only vanna level worth talking about on the whole chart. This should repel price away from this level, but then again, vanna charts for TSLA have been pretty worthless since the summer of 2023. This is the only ticker I've found that has vanna charts like this.
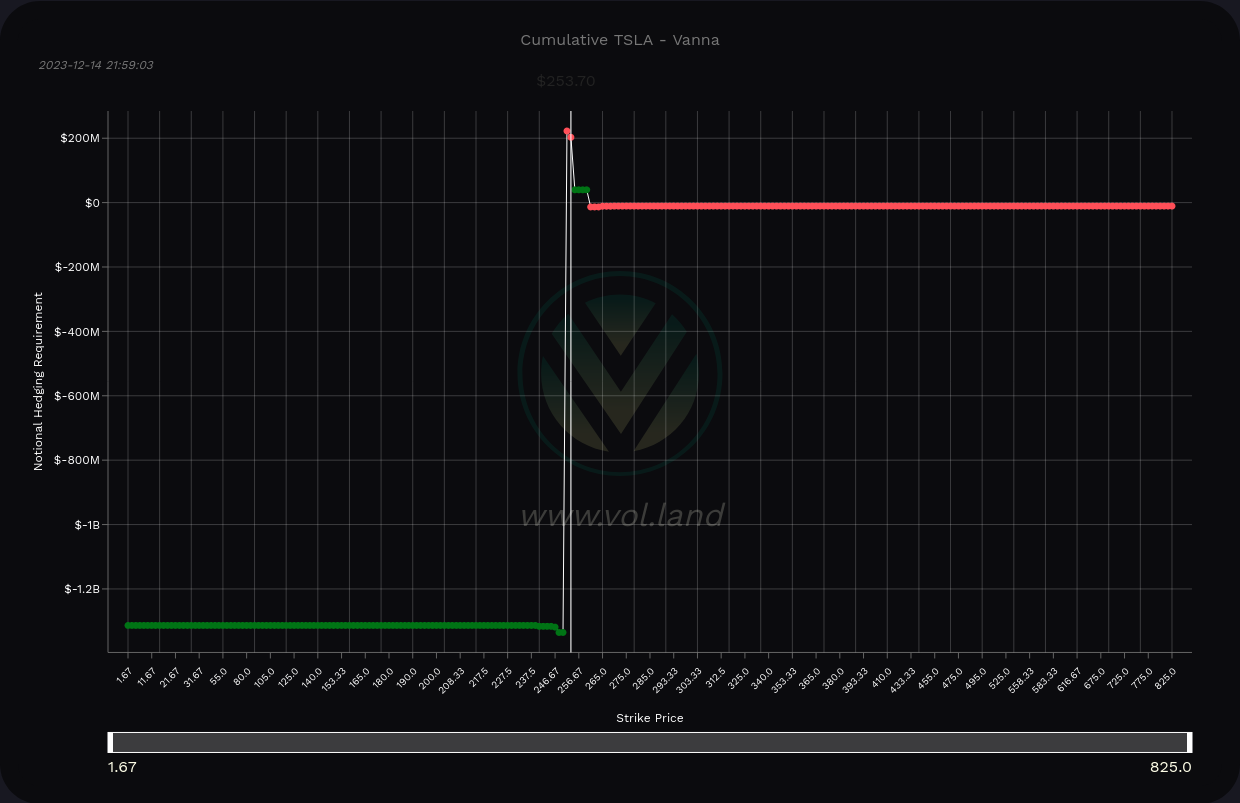
TSLA vanna across all expiration dates
I won't even bother with gamma either because the chart is equally worthless right now. 😉
Institutional trading
Much of the institutional interest in TSLA ranges from about $230 to $270. The biggest trade of the year is the #6 trade at $260 back on July 21. Then we saw #7 appear near the highs at $274 in September.
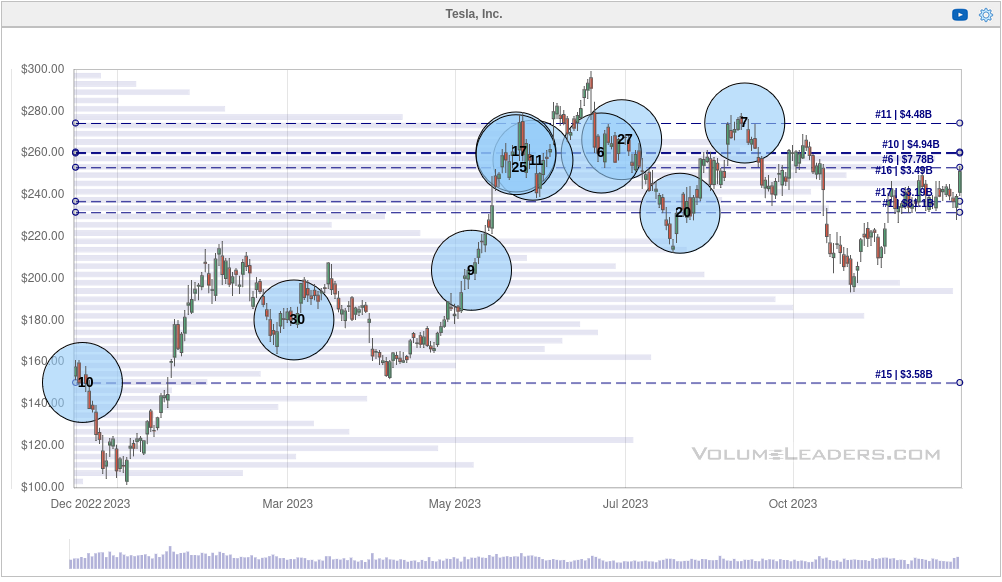
If I zoom in a bit for the moves since June 2023, more patterns appear. Institutions have been quiet in TSLA since the big #7 trade on September 15th even as TSLA drifted down to $200 (which lines up with the 9th biggest trade of all time).
What can we tell from this?
- $230-$275 is a high volume region
- $200 is a strong support level
- Institutions are taking a "wait and see" approach here.
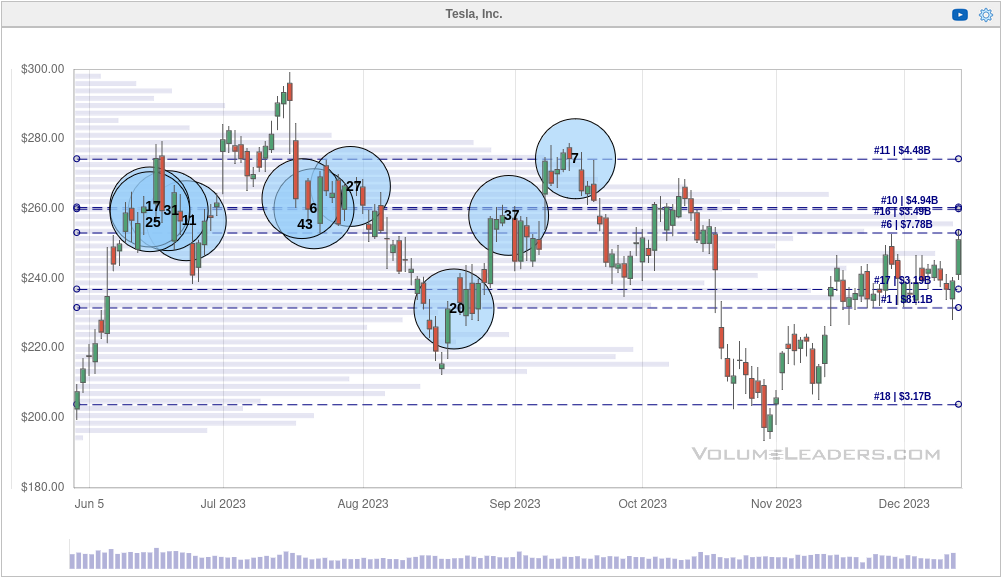
But let's go one layer deeper. What if we examine the ten biggest trades since the gap down in October?
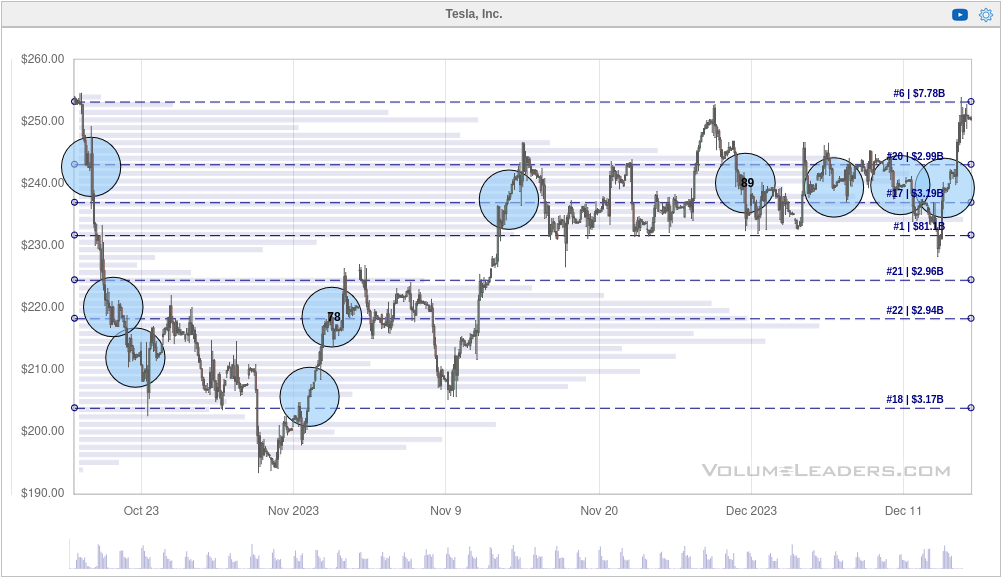
$225 shows up as the highest volume level here and institutions have been "nibbling" on TSLA in the $240 zone since November 14th. Some of these nibbles are as large as $2.9M shares. 👀
Why is this important? I keep seeing a pattern from institutions where they nibble away at a trend by making relative small to medium sized trades and when they believe the trend is in their favor, they do a massive trade that ranks in the top 20 of all time trades. It looks like institutions are building a position here in TSLA quietly but it's difficult to tell if it's a long or short position.
Charts
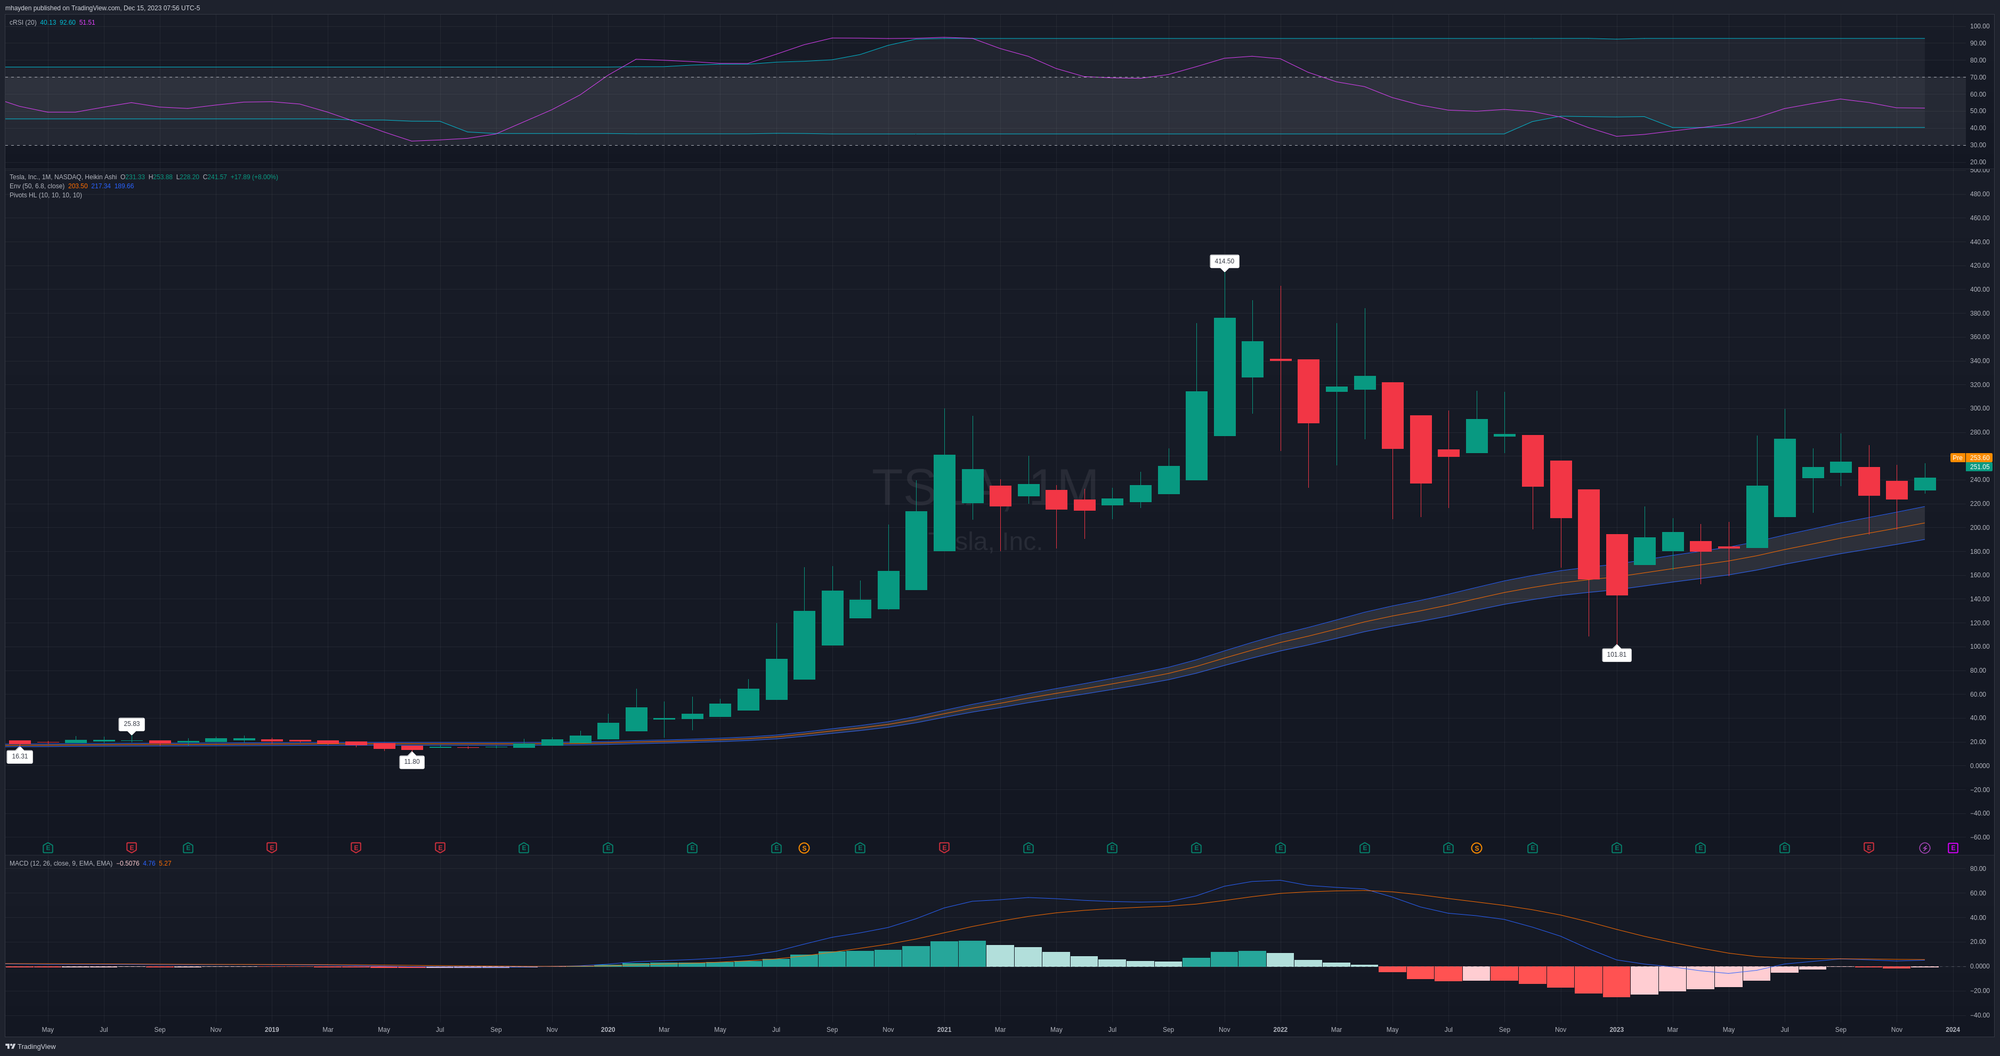
TSLA's monthly chart shows a fairly low RSI (relative to its channel) and a calming MACD that remains above zero. TSLA returned to its 50-month moving average and has been using it as support since the fall of 2022. We have an upward sloping 50 month MA here and that's a bullish sign.
This chart tells me that we've consolidated a bit and that's a good base for a move up. This might also explain why we're seeing so many nibbles from the institutions. I wonder when they will be confident enough to make their big trades. 🤔
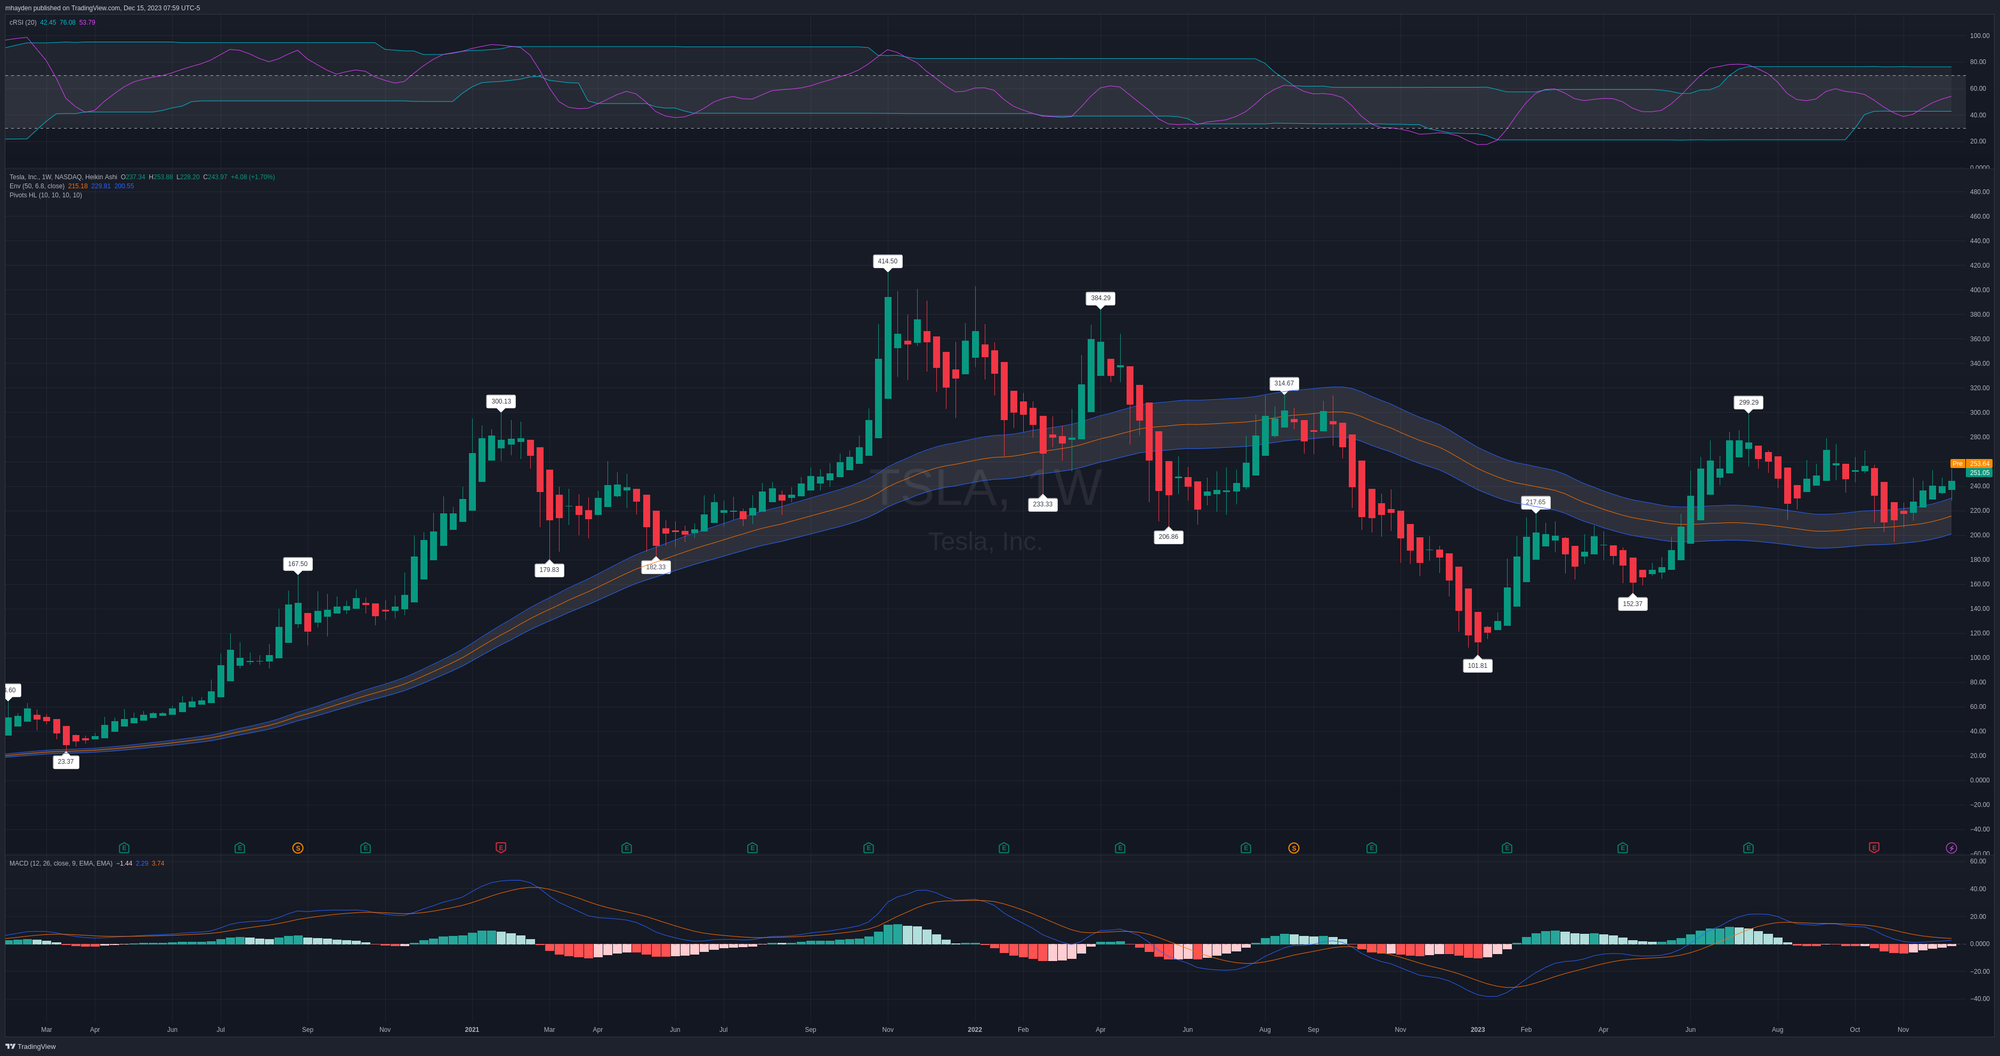
The weekly chart shows a rising RSI with a bullish confirmation (latest low is higher than the previous) and a MACD over zero that might make a bullish cross soon. Price returned to the 50 week moving average and climbed higher recently. All of this looks like much more healthy price movement than the run to $400+ that we saw back in 2022.
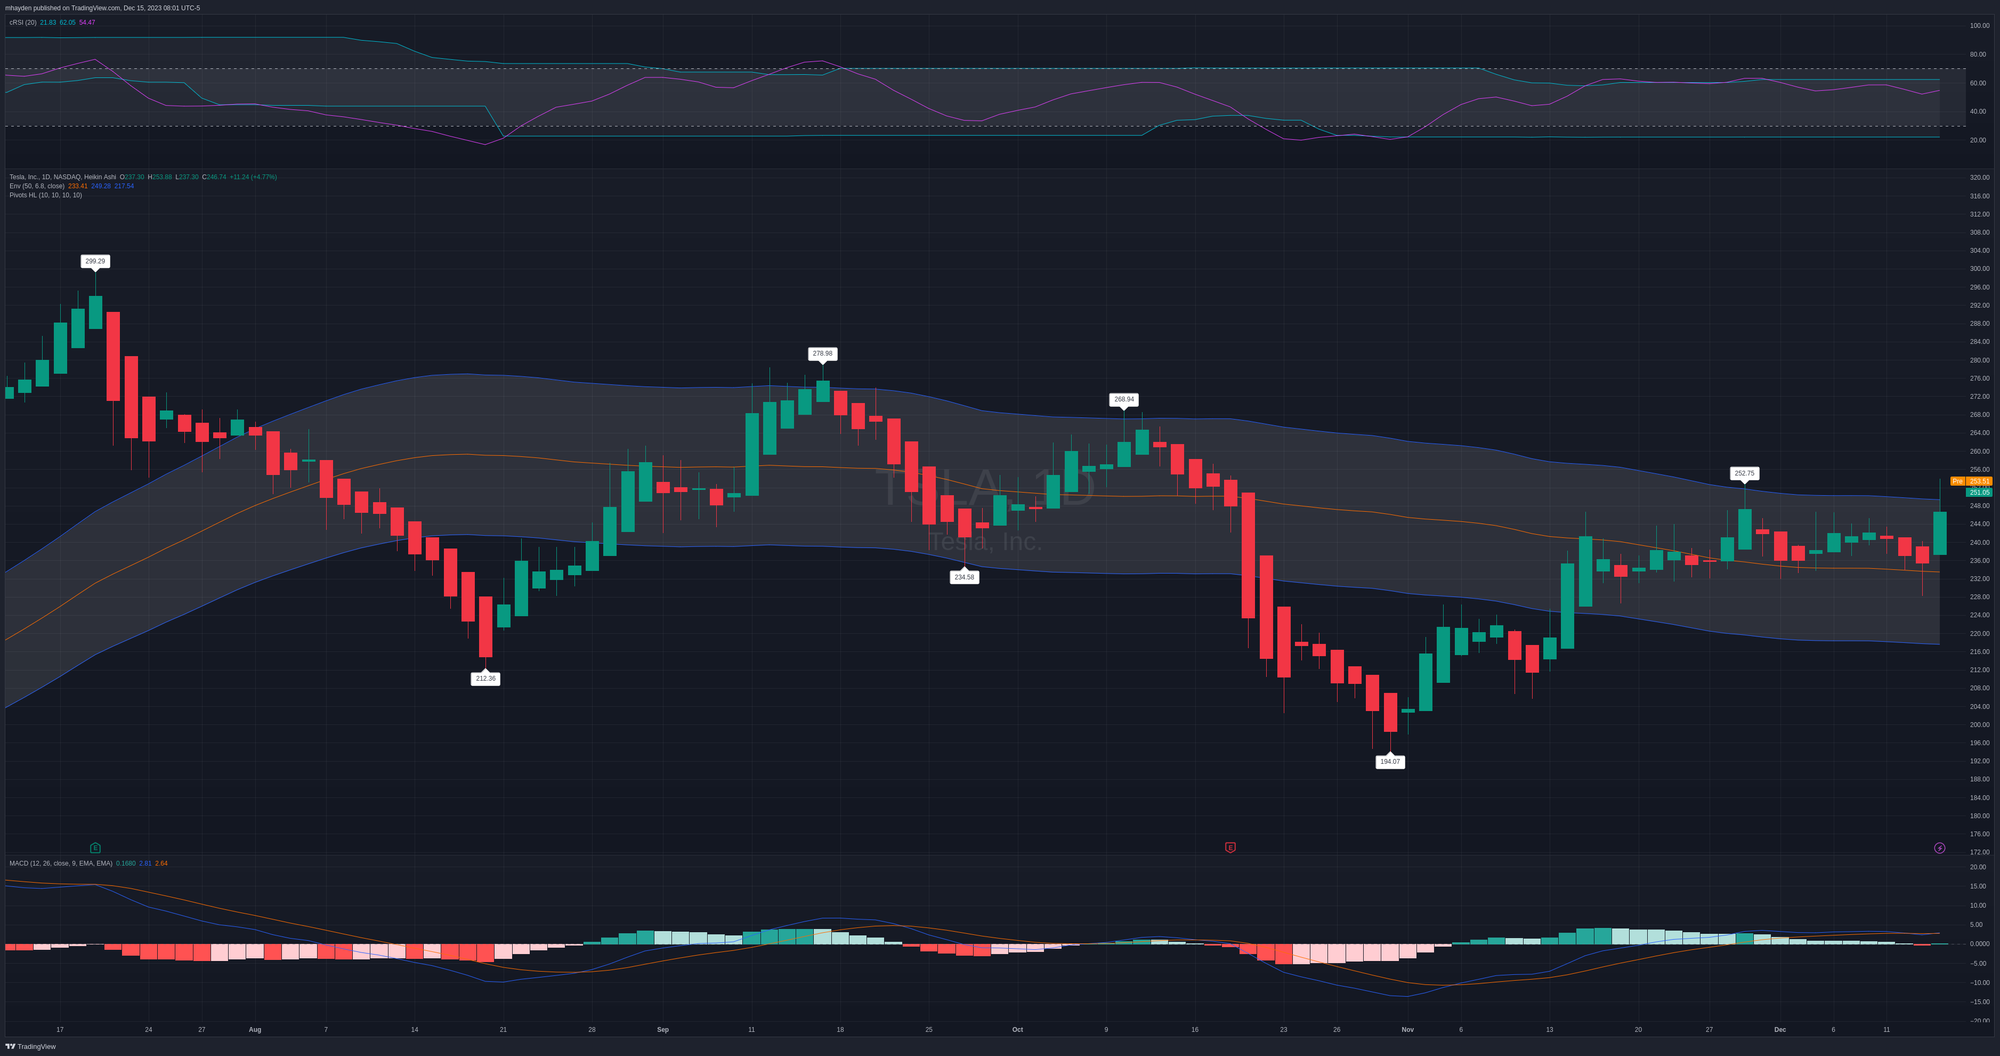
Finally, let's examine the daily chart. RSI is a little high in the channel and MACD is above zero with both lines moving together in tandem. We've had some good consolidation since late November and this could form a base for a move higher. Remember that institutions have been trading during this consolidation at some critical levels.
Thesis
TSLA's incredible moves during 2021 and 2022 definitely calmed down over 2023, but we're in a much more sustainable pattern now. The recent consolidation could be due to a number of factors (lots of news recently), but it's a sign of a healthier market.
We have a lot of good things in place for a potential move up. We have institutional trades active in the $240's just above the 50MA on multiple time frames. We also have vanna/gamma support at $250 that should reduce the chances of a move lower.
If TSLA makes a big move to the upside, it needs to contend with that $275 level which has been a problem recently. Institutions aren't eager to go long up there unless something changes with TSLA's price action. The recent consolidation could change that, but only time will tell.
I'm currently sitting on 100 shares that I've accumulated since June 21. My current cost basis is $214.30, but it started at $275 after getting assigned on a short put. I've whittled down the cost basis carefully with short puts, covered calls, and making some smaller stock trades during dips and rallies.
I also have a $280 covered call for January 19 that sits just above the level where institutions have gone short in the past. If TSLA makes it up there before January 19th, then I'll gladly take assignment and lock in my long stock profits. If not, I'll close the call for a 50% gain and look for another one.
Good luck to everyone today! 🍀
Discussion