TSLA options analysis for September 19
Trading TSLA lately feels like riding a roller coaster. Let's dig into the data and get a smoother ride. 🎢

Good morning and thanks for reading! 🌅
I received an awesome note via Telegram yesterday about how my way of parsing market information helped someone learn! That's the best feeling in the world and it makes this work feel worthwhile. 🫂
I'll go back to TSLA today to see if I can tease out some information about where it might be headed in the future. We have a Federal Reserve interest rate decision rapidly approaching while economic data continues to come back mixed.
All investments come with significant risks, including the loss of all capital. Please do your own research before investing, and never risk more than you are willing to lose. I hold no certifications or registrations with any financial entity.
Let's get this underway. ⛵
Options flow
The overall flow for TSLA gives me an idea about the general momentum of traders and how they're betting on future moves.
On the five day timeframe, we're still looking very bullish with a gap of around $20M between bearish and bullish premiums. Yesterday was definitely mixed, but the gap between the lines was fairly narrow and it narrowed even more just before the market closed.
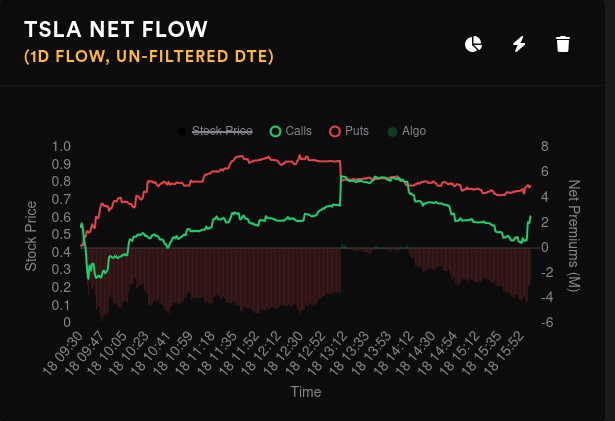
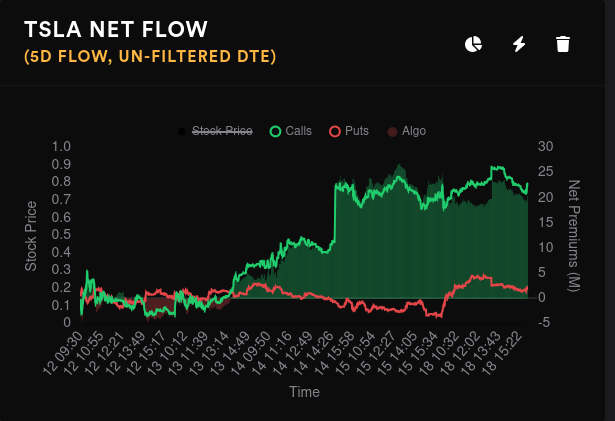
TSLA's options volume dropped abruptly yesterday relative to last Friday, but that makes sense as TSLA rallied last week and the quadruple witching day is always unusual. Overall daily premiums are down.
TSLA's $260 strike for January 2024 received a lot of positive attention yesterday with an increase of $10.5M in premiums spent there. On the shorter timeframes, $270 saw a lot of bullish volume yesterday and $280 leads in bullish volume for the week.
Vanna
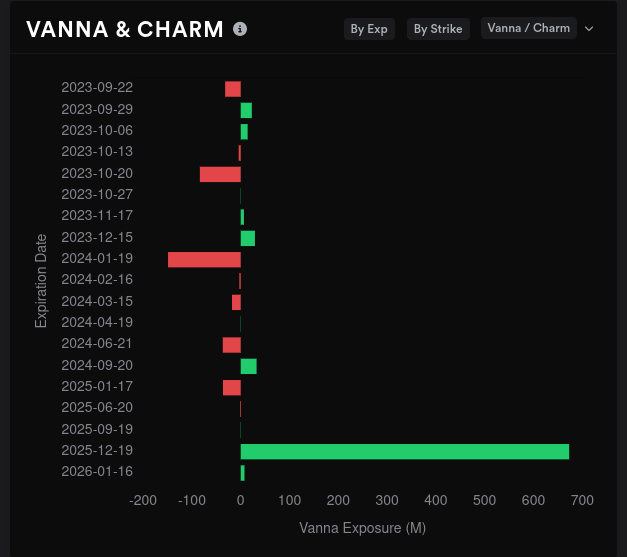
TSLA has a weak vanna profile and much of the vanna it does have is stuck way out in 2025. Volland shows vanna being fairly balanced with a slight edge to the positive. $260 shows up as the most negative strike with positive strikes around $265, $267.50, and $300. Yes, $300 is creeping back in.
However, don't get your hopes up on $300 just yet. Those bets on are on longer terms past January 2024.
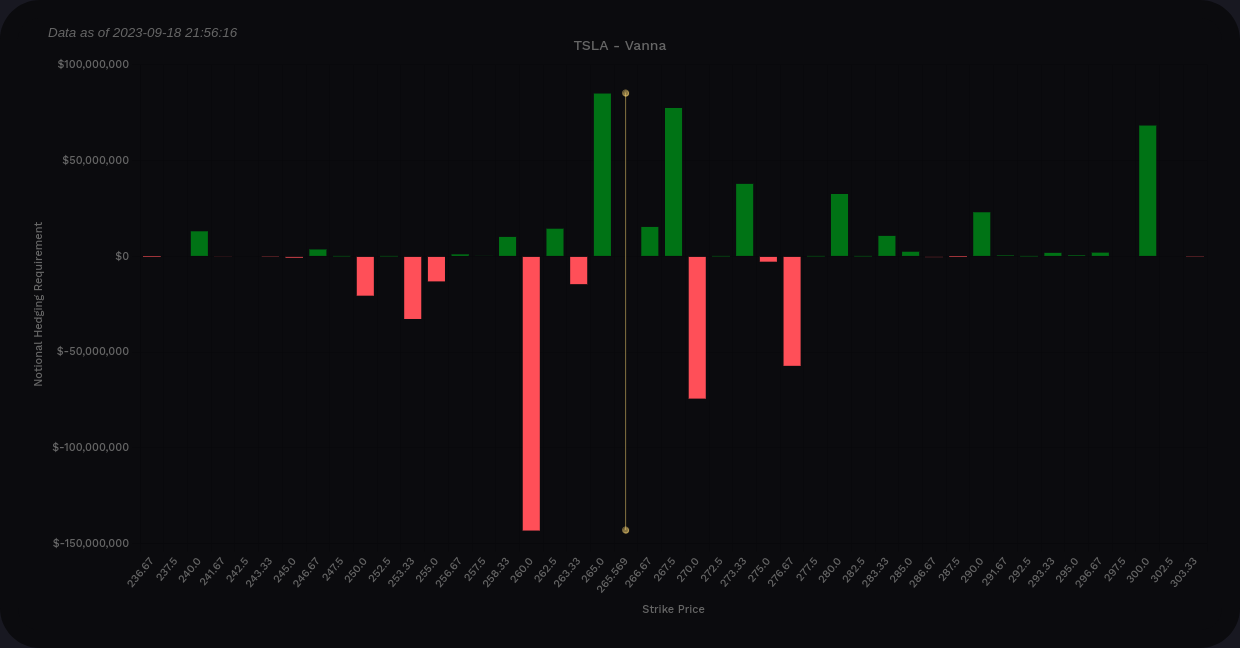
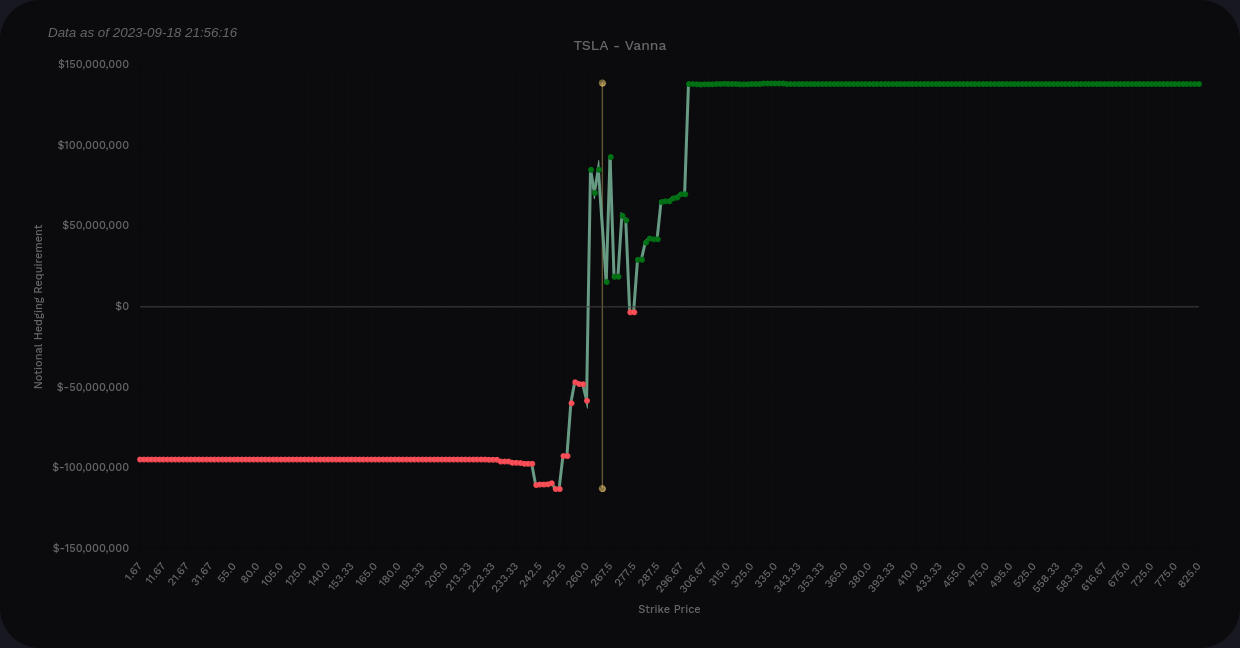
TSLA's vanna through 11/17 is almost entirely positive with negative strikes at $260 and $270 that might pin us in for a while.

Gamma exposure
Aggregate GEX is fairly flat outside of a big resistance line at $260. Negative GEX price magnets are spread out across the chart with the one at $280 having a slight edge. TSLA is right around $266.50 this morning.

The biggest GEX expiration dates are 9/22 and January 2024.
9/22 has the big $260 resistance and room for TSLA to move from about $262.50 to $270. The biggest magnet for price is $280.

10/20 is light on GEX but the biggest magnet shows up around $290. There's an entire zone of negative GEX up there that could pull price upwards. However, don't ignore the $250 and $230 levels here. $220 shows up as a clear line of resistance.

Going all the way out to January 2024, it's fairly clear to see what's happening here. The main magnet for price is $300. Wow. Resistance looks flat, but we're looking at an expiration that is very far away.

Dealer positioning
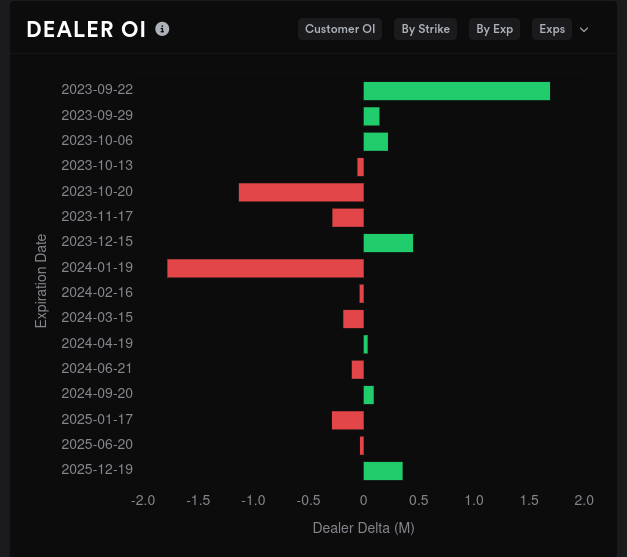
Dealer delta buildup over a 15 day momentum turned long yesterday which suggests customer momentum shifted short. This has typically signaled a downturn or sideways trading for TSLA in the past.

Dealer open interest suggests that we get our first bullish expiration on 10/20 and another for January 2024. Much of TSLA's vanna is still packed into that 2025 expiration date for some reason. (If you have ideas, please let me know as I haven't found another stock with the same vanna pattern.)
Whale traders
Traders with deep pockets for big trades are betting bearish on $270 on aggregate:

Traders are betting bullish on $260, $270, and $280 for this week. $270 had a short hiccup but the bets on $260 and $280 have been steady.

11/17 is where our bearish $270 bets show up:

I can't see whale date for January 2024 quite yet, but 12/15 shows a noticeable jump in bullish bets for $260. $300 and $350 are trending up.

Dark pool trades
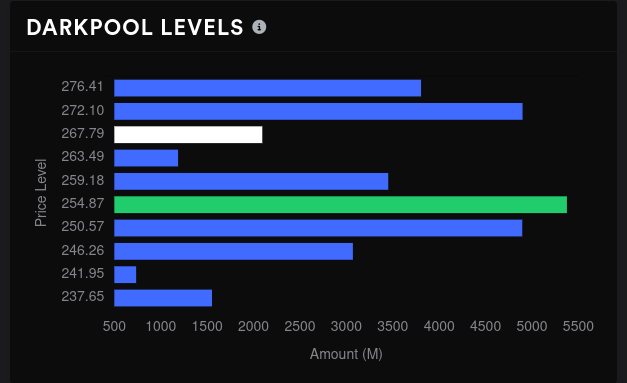
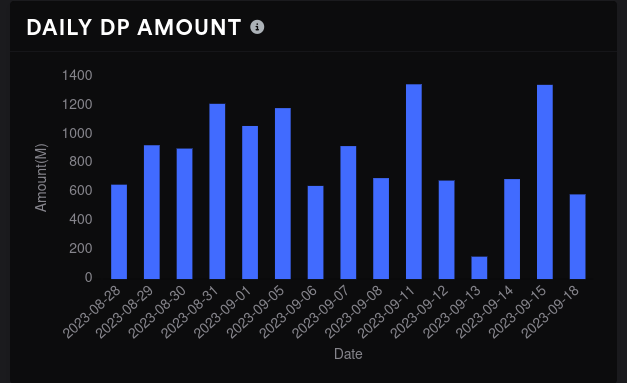
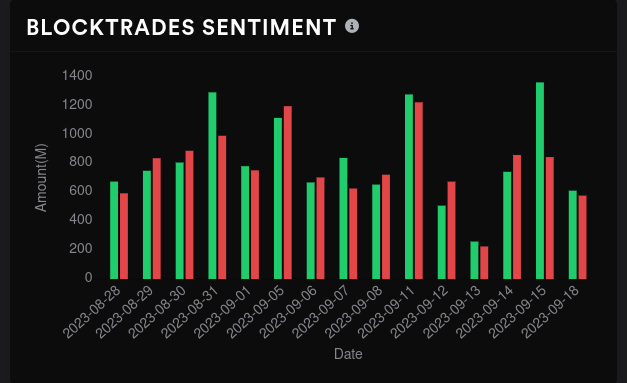
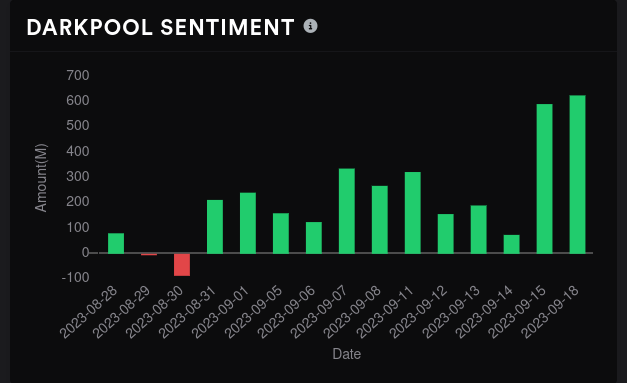
Yesterday saw mediocre volume with balanced trading. TSLA's biggest level remains at $255 with a volume shelv from $246-$259. There's another volume shelf around $272 that could become resistance. Overall sentiment is bullish and still trending more bullish.
Thesis
If you read Sunday's Charts and Coffee post, you'll remember that I found most of TSLA's volume since the pivot just under $260. That lines up fairly well with the volume shelf on the dark pool trades above. This could turn into a good level of support and that aligns with the GEX levels we saw earlier for 9/22. TSLA has some moments of weakness after this week where a drop could happen, perhaps to $220, but strength returns into December and January.
TSLA's price action often defies logic, so be prepared for anything. If you want to be aggressive with trades, this $260-$270 range could be a good window for trading over the next week or two.
If you're looking for something a bit more conservative (is anything conservative with TSLA?), a bet on the $250-$290 range makes sense to me. I was assigned last week on a call when the banks adjusted their price targets but I still have 100 shares with a cost basis of $241.65. My 10/20 covered call for $290 is still on the board and although it's red right now, I'm happy with that trade.
TSLA's IV rank is sitting just over 7%. That means that the current implied volatility level is very low relative to where TSLA has been over the past year. It has not been this low in the past 12 months. TSLA's IV rank peaked in the 90% range at the very end of 2022 and very beginning of 2023.
Lower IV means it might make more sense to use long options for TSLA. However, I'm much more comfortable selling puts and calls since that's part of my process.
Good luck to everyone today! 🍀


Discussion