TSLA rundown for September 22

TSLA remains one of the few tickers in my watch list with some bullish data still holding on after this week. Let's get into the latest options data. 🔋

Happy Friday! 👋 In today's post, I'll catch up on the data for TSLA to see where we might be going. As I mentioned in last week's Charts and Coffee, TSLA has all the mechanics for a move higher, but it's a finicky stock for sure.
This week's interest rate concerns and overall market sentiment pushed TSLA down to $256 as of this morning. With bond yields increasing, this could lead to more bearish pressure on stocks:

All investments come with significant risks, including the loss of all capital. Please do your own research before investing, and never risk more than you are willing to lose. I hold no certifications or registrations with any financial entity.
Let's get into that data! 💪
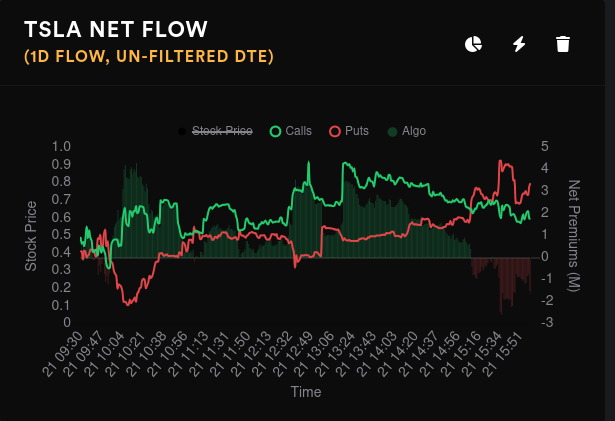
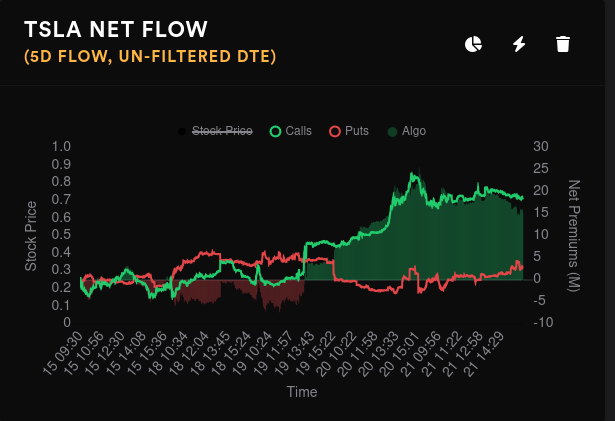
Options flow
TSLA certainly has a different look on its five day flow relative to most stocks I've seen. Although puts are ticking up, there's still a decent gap between call and put premium flow. Yesterday saw quite a bit of indecision and it finished the day slightly bearish.
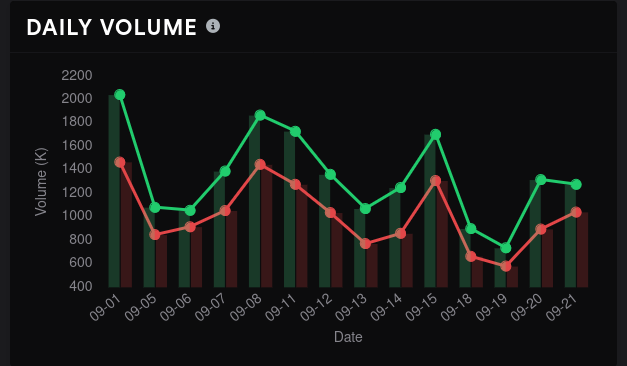
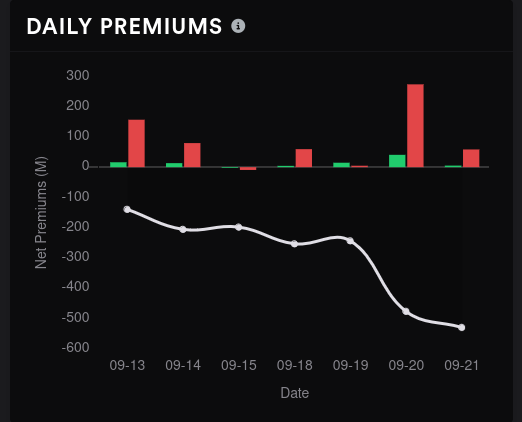
Daily options volume is trending down over the last few weeks and options premiums have drifted down, especially after the interest rate announcement this week.
The $260 strike has been hit with more calls than puts lately and $255 has received most of the bearish attention.

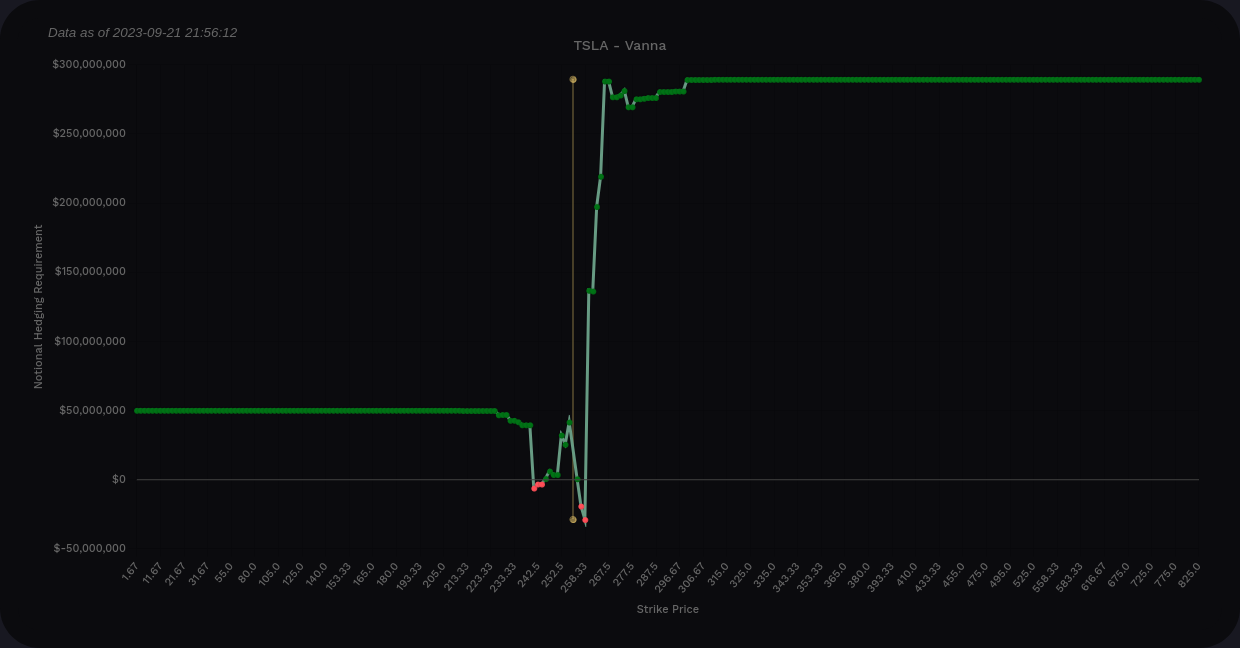
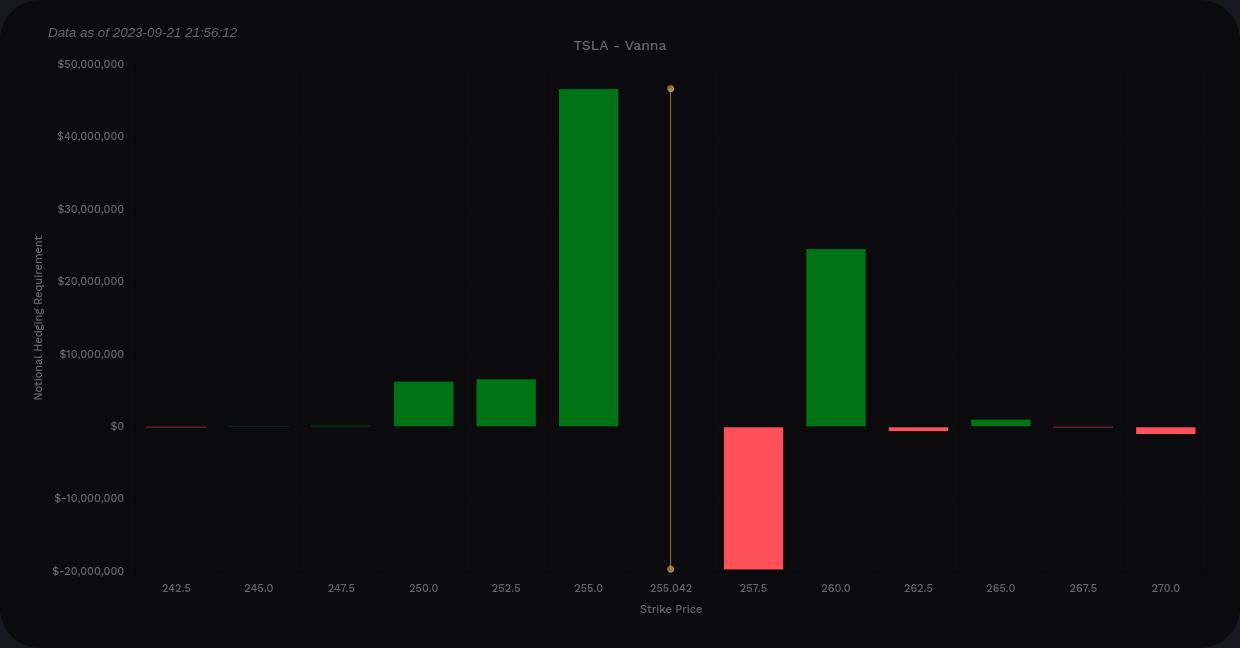
Vanna
TSLA has seen a very low impact from vanna recently. Much of TSLA's vanna is tied up in expirations in the far future, especially 2025. It's still worth a look since it can help us narrow down the levels in play.
Aggregate vanna is almost entirely positive, which is a bullish sign if IV is contracting or remaining steady. We have positive vanna above price and that's also a good sign. If IV contracts, there's a good chance of a run to $260-$265, but not much further than that. IV expansion could push us to $250 with an outside chance of $240.
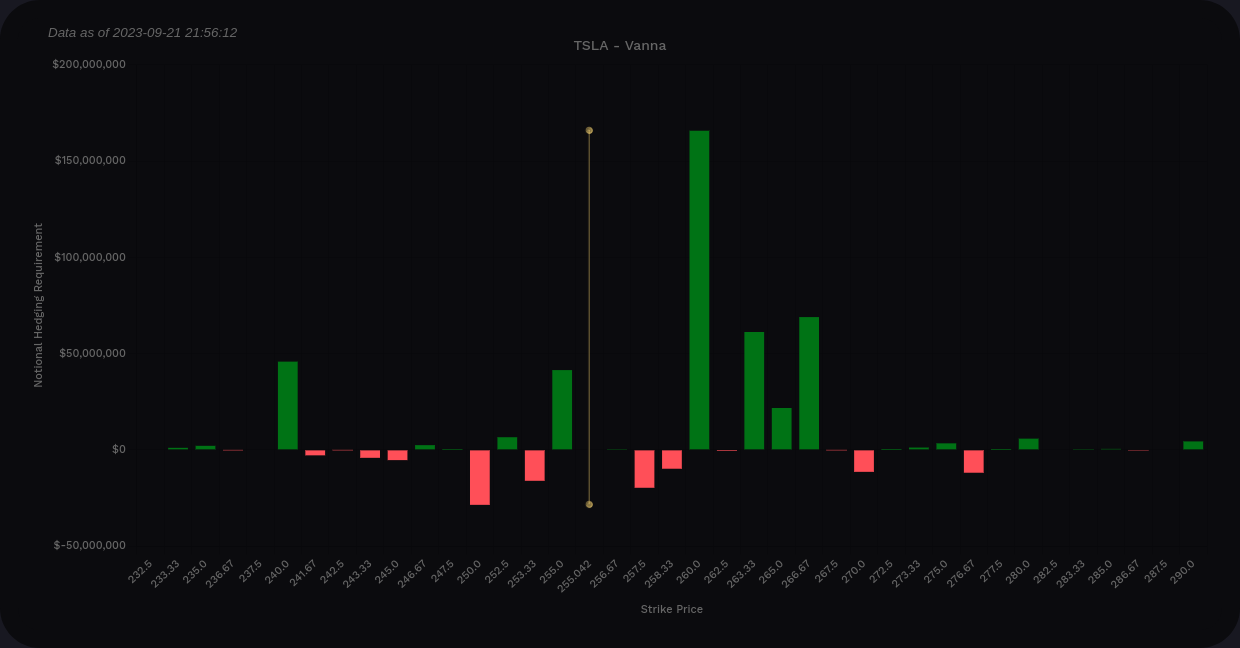
TSLA's vanna from now through 11/17 suggests we are pinned in between $250 and $260. There's a big negative level at $257.50, but this level is likely too close to TSLA's current price to have a large effect.
There's not a lot here that suggests TSLA is open to a good rally, but then again, TSLA's vanna is quite weak right now.
Gamma exposure
TSLA's GEX profile hasn't moved too much since I last looked. Aggregate GEX suggests that $260 will repel price in both directions. If we can hop past $260, it might give us a little momentum into the largest negative GEX at $265. There's another decent price magnet around $270.

TSLA's 9/29 and January 2024 expirations have tons of GEX caught up in them, so let's get a look at those.

9/29 GEX suggests $265 as a price target with a secondary price target around $280. There's not much resistance here yet, but that could change as traders roll contracts from the 9/22 expiration.
10/20 has much less GEX but there's a decent negative GEX zone above $280 worth watching. There are other likely price magnets around $230 and $250.
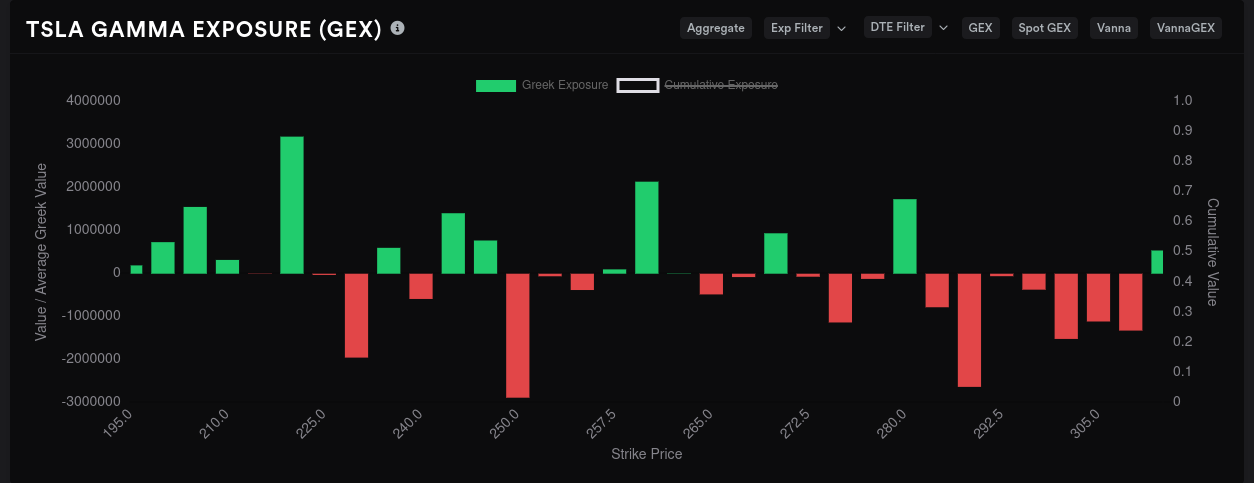
Where did our TSLA $300 friends go? They all moved out to the January 2024 expiration. Nothing else comes close here to $300's negative GEX level. Wow. It dwarfs all the other levels.

That's still a ways out, but this is definitely something to watch! 👀
Other options data
TSLA's whale traders have made some large moves this week. A bullish move to $260 started on 9/18 and has held steady for the most part. A bearish move on $270 preceded that and it has mostly held in place as well.

We saw that 9/29 is a big expiration earlier, so what are whales doing there? $280 is getting some bullish attention while $260 and $265 are bearish.

10/20 has $280 trending down and $260 trending up.
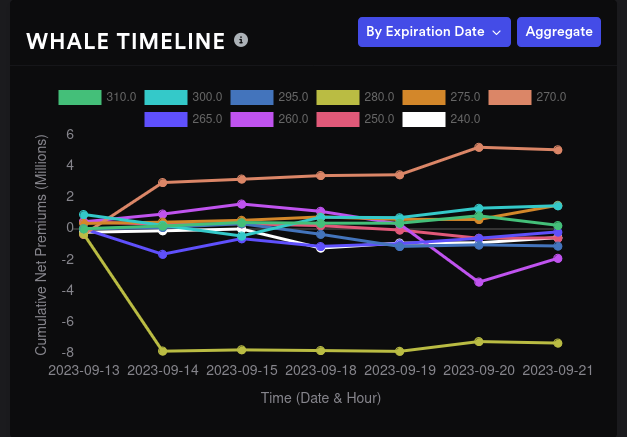
11/17 has a big move down for $270:

I can't see January 2024's expiration yet for whale trades individually, but the aggregate paints a pretty good picture of range from $260-$270.
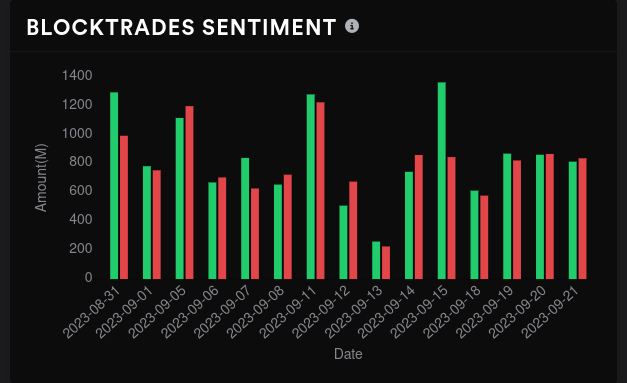
TSLA's dealer delta buildup shows dealers long and that implies customers are short.

Over the past 18 months, if you bought shares when this chart was red and shorted shares when it was green, you would have done pretty well:
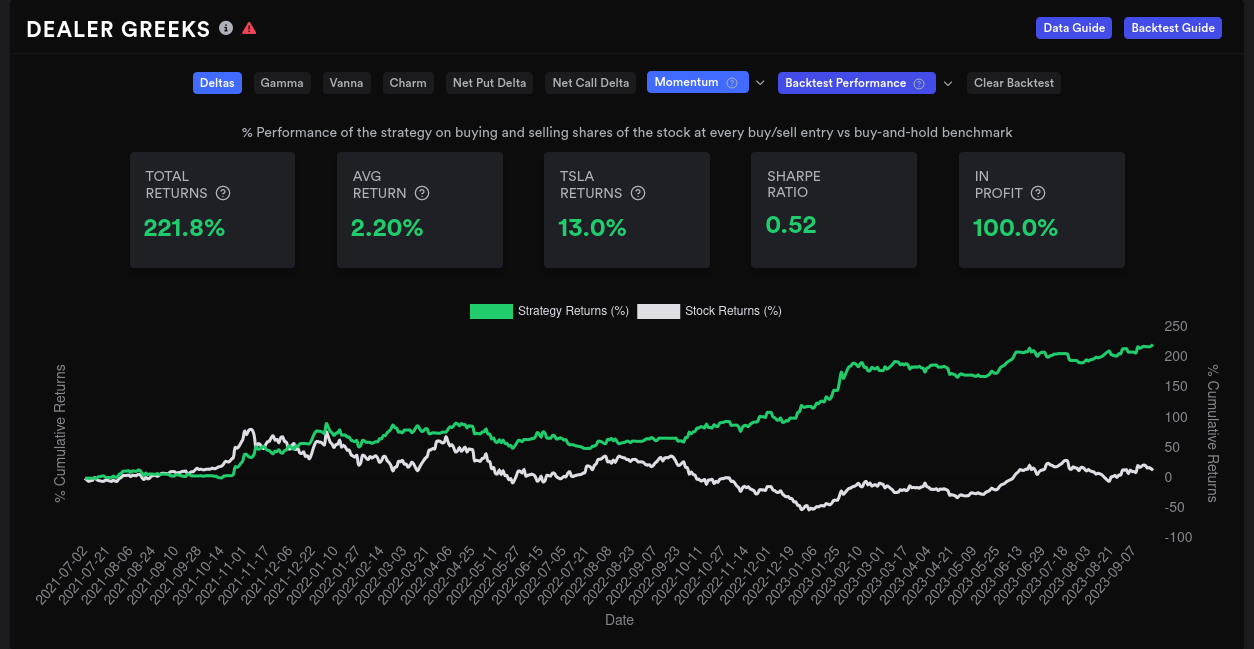
Past performance doesn't dictate future performance, though. 😉
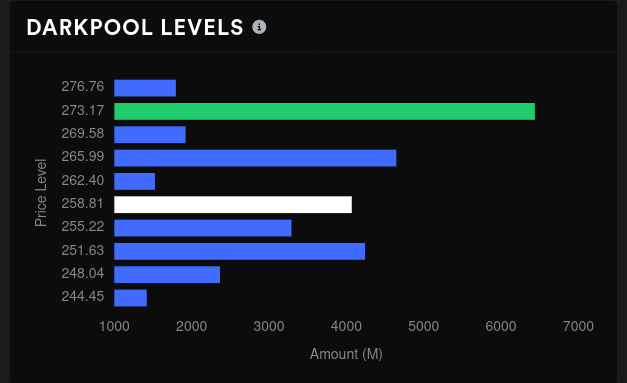
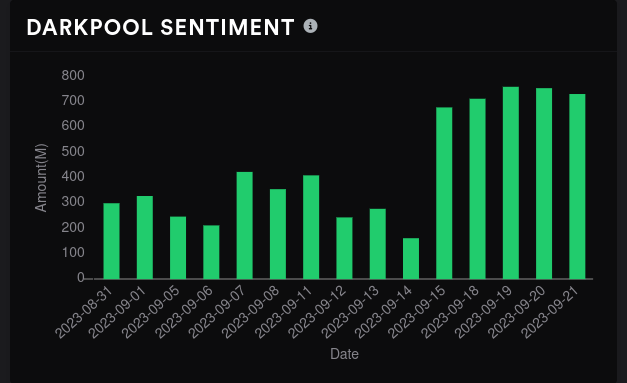
Dark pool trades
Sentiment remains very bullish with bulls and bears in an even fight over the past four days, even as dark pool volume increased! Our biggest volume level sits around $273 and we have a decent volume shelf from $251-$259. Volume drops off quickly below $248, so a dip below that level could send us to that liquidity zone around $215 where we had a great bounce recently.
Thesis
Although January 2024 is getting plenty of bullish bets for $300, TSLA looks like it might be trapped in a range through the next two monthly expiration dates. Earnings are coming up on 10/18, so anything could change after that.
The $250-$260 range seems like a good trading range for aggressive traders at least up to 10/20. Conservative traders might want to look at a $250-$270 range for their trades. I can't find much evidence of TSLA being likely to lose the $250 level, but this stock does move in some rather mysterious ways.
I took an aggressive trade yesterday and sold a $260 put for September 29th since most of the GEX levels are above the current price, but overall market sentiment could push me to getting assigned here. My break even on that trade is $252 and I'm happy with buying at that level.
My $290 covered call for 10/20 is still on the board and is actually green from yesterday's price moves. I may take that off today if it's still green and re-evaluate where I want to sell these shares.
Good luck to everyone today! 🍀
Discussion