TSLA stock and options analysis for October 25

TSLA vanna and gamma data suggests we're stuck in a tight range for a while, but the chart says we might be turning a corner. 🤔

Happy Wednesday! 👋
I'll be taking another look at TSLA today to see where we might be going after the big gap down from earnings last week.
All investments come with significant risks, including the loss of all capital. Please do your own research before investing, and never risk more than you are willing to lose. I hold no certifications or registrations with any financial entity.
Let's get into the data. 🔎
Vanna
I wrote a long post last night about understanding vanna as well as how you can use it with your trades. If you didn't get a chance to read it, go back and give it a look!
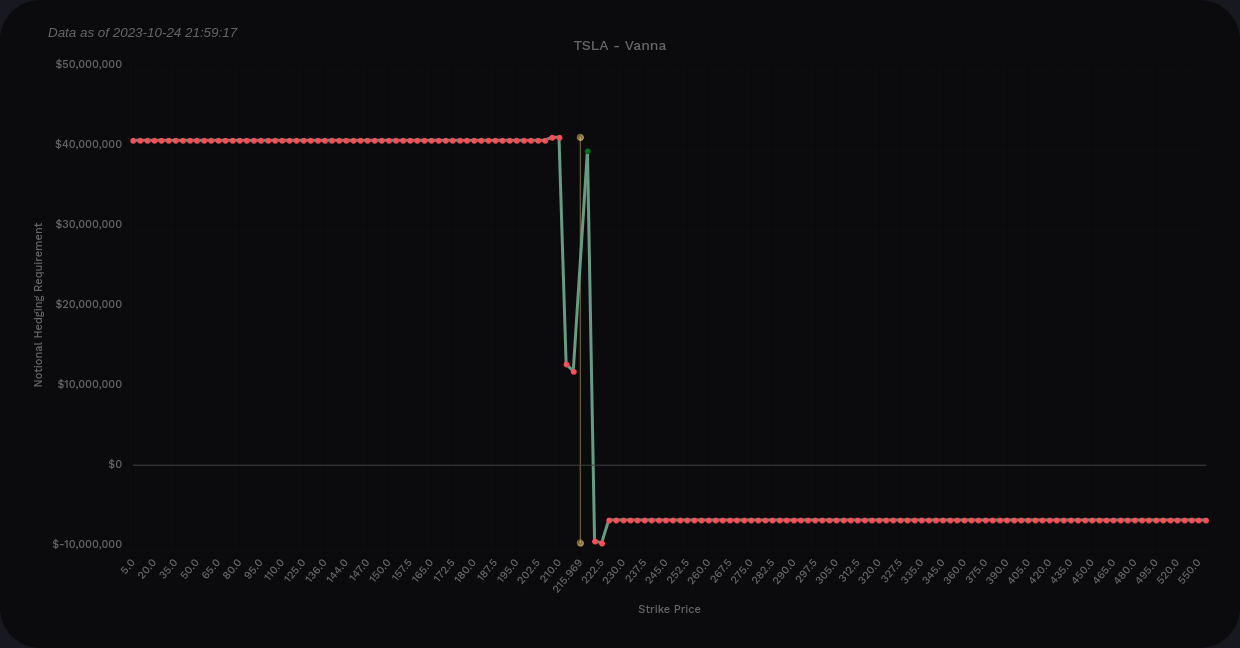
The vanna curve is quite sharp for TSLA, but it's mostly positive at the extremes. We have strong negative vanna above the price and that doesn't make me terribly optimistic for a rally. Also remember that positive vanna is bullish only when implied volatility holds steady or it contracts.
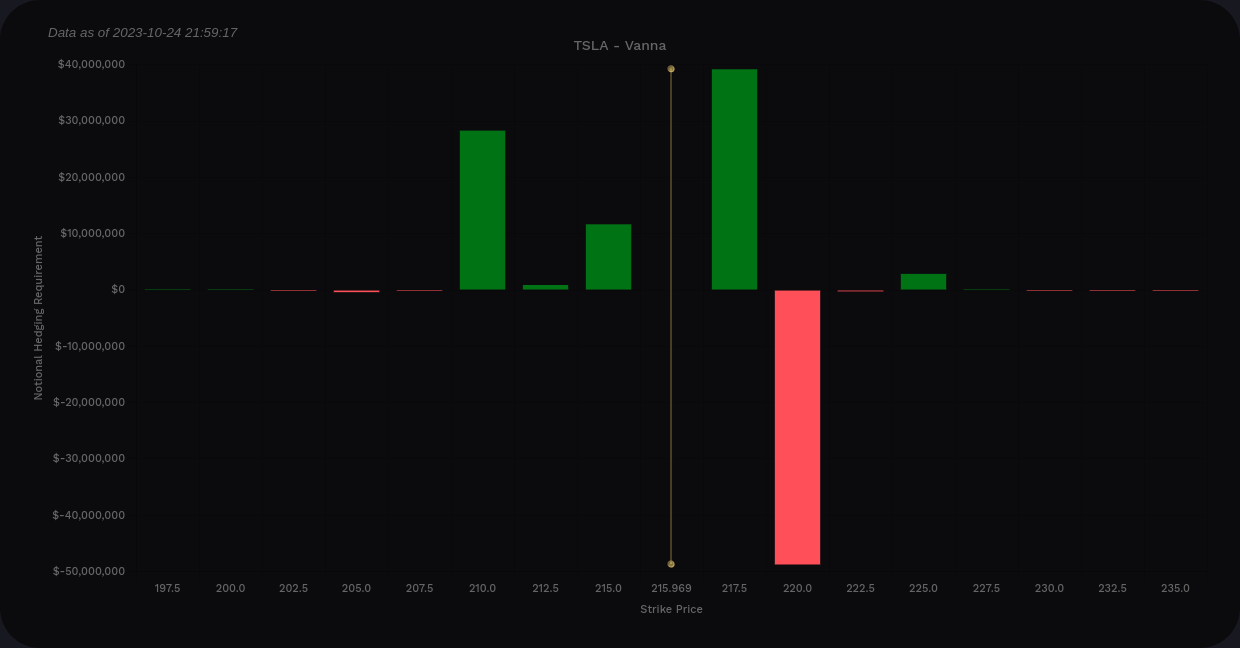
TSLA vanna 10/27-12/15
I notice that big red bar at $220 first. That's likely going to be a tough level for price to approach even if we get a decent amount of IV contraction. IV expansion could push us down to $210 but I wouldn't expect it to go further than that. This looks like TSLA might be trapped in a $210-$220 range for a while.
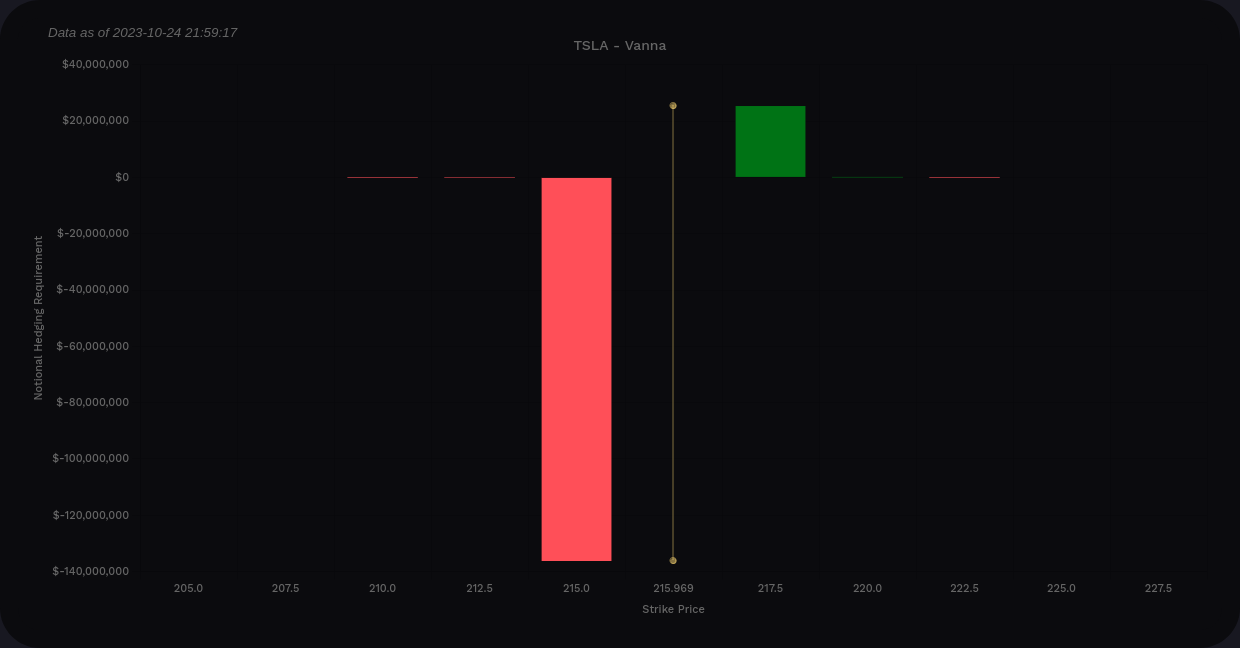
If you love trading weeklies, here's the TSLA look for 10/27. Vanna is negative this week and it tops out around $217.50. I'd expect the price to hover on either side of $215 with a higher probability on the upper side.
Gamma
I'm taking a break from Tradytics' GEX charts for now and focusing on delta-adjusted gamma (DAG) from Volland. This is a change for me but I'm looking to get my vanna and gamma data from the same source since Volland uses a different, and possibly more accurate method, of identifying the dealer side of a trades. I'm still testing out this assumption. 😉
This DAG chart suggests that dealers will sell shares to hedge as prices approach $217.50 and they are likely to buy shares as price approaches $215. This matches up with the vanna data we saw earlier and suggests TSLA is staying in a tight range for a while.

For those of you who love the weeklies, here's TSLA's DAG for 10/27:

$215 looks like a big buying level and $217.50 a weak selling level.
Chart
Let's start with a four hour chart and note what looks bullish here: 🐂
- The change of character (CHoCH from the August low seems to be providing some support for TSLA in the lower $210s.
- TSLA's money flow is leaning bearish but it's fairly neutral.
- The oscillator wave is turning a corner and has a bullish retrace indicator.
- We have an old order block that was mitigated after earnings but it still could affect price from about $227.50-$235. There's not much to slow price down under that level.
Bears might be excited about the current overall trend, which is leaning bearish. In addition, there's not much to support price below $212 until we get to $160. That would be a painful drop. 🎢

There is one small thing to notice here that I like to see as a trader with a bullish bias. The image below shows an excerpt from yesterday where TSLA made a fair value gap on a 15m time frame. I keep my fair value gaps on the 15m time frame so I only see significant ones that aren't mitigated on a short time frame. When one does appear, I pay attention.

These fair value gaps often get filled at some point, but they can act as support or resistance until they are filled. Notice that after the fair value gap was made, TSLA tried to break above it and then succeeded yesterday. This could become a new level of support to watch.
Remember the $215 gamma and vanna lines? Other traders are noticing this level, too. 😉
Thesis
TSLA's future is definitely uncertain. I typically focus on data, but it's difficult to ignore Elon's questionable financial choices and the fact that TSLA has some fierce competition now in multiple markets. More and more manufacturers are joining their charging network, and that's good, but this company has a lot of volatility for a reason. It's unpredictable and disagreements on the valuation are easy to find.
I'm sitting on a short 12/15 $220 put from before earnings that started to dig itself out of a hole yesterday. I'm also working down the cost basis for my shares with some aggressive weekly covered calls when TSLA shows some weakness. I'm not looking to add any other bullish trades unless we see a significant trend change going forward.
Good luck today! 🍀
Discussion