Where is TSLA going?

As TSLA wanders lower, it's approaching some big technical levels and VWAP lines from the COVID crash. Are there signs of a turnaround coming? Let's dig into the data. 🔎

Happy Tuesday! TSLA found itself wandering below $200 this week in a move to the downside that both surprised and didn't surprise me at the same time. 🤷♂️
In this post, I'll dig into TSLA's options data to make some guesses at future moves and visit the chart to see which levels match to other indicators.
All investments come with significant risks, including the loss of all capital. Please do your own research before investing, and never risk more than you are willing to lose. I hold no certifications or registrations with any financial entity.
Without further ado, let's dive into TSLA! Happy Halloween! 🎃
Vanna
My first stop today is at Volland for a look at TSLA vanna.
Our vanna curve sure does look negative across the board except for a small positive spike just below the current price. This looks bearish at a high level before we get into the details.
The bar chart shows negative vanna peaking at $200 and within a zone from $180-$190. Bullish traders would want to see a lot more positive vanna here with more of it above the current price. However, we have two things working against bullish traders here:
- Positive vanna is weak and mainly underneath the current price
- Negative vanna is ahead of and behind the current price
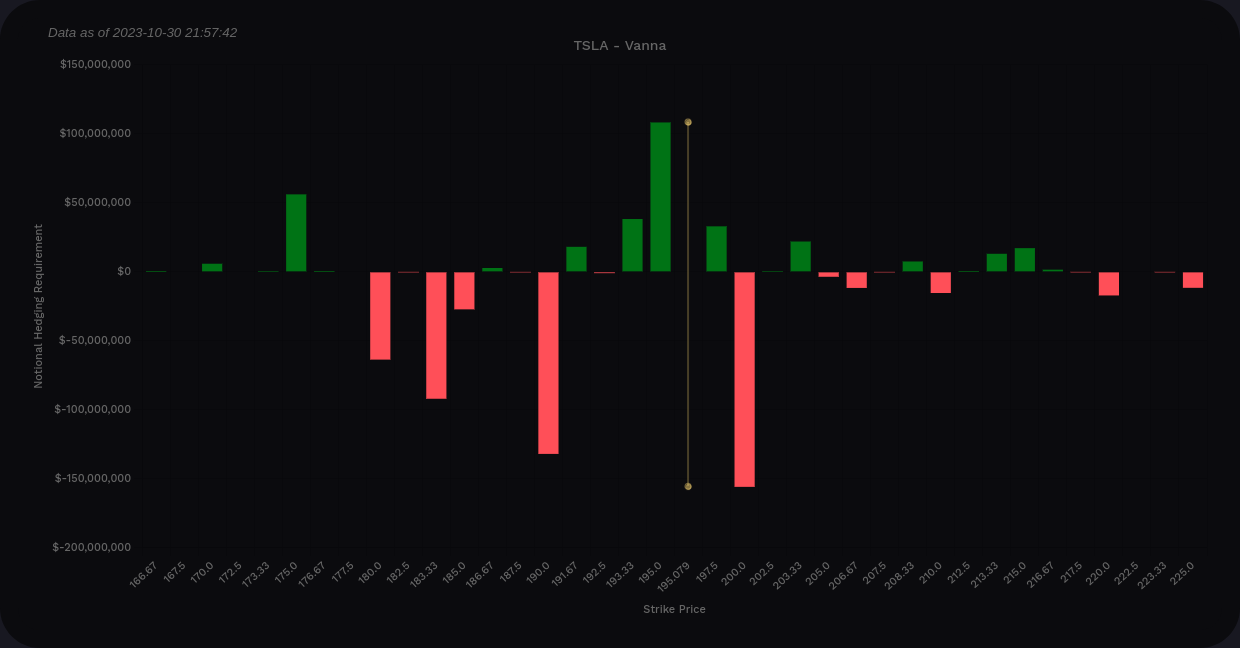
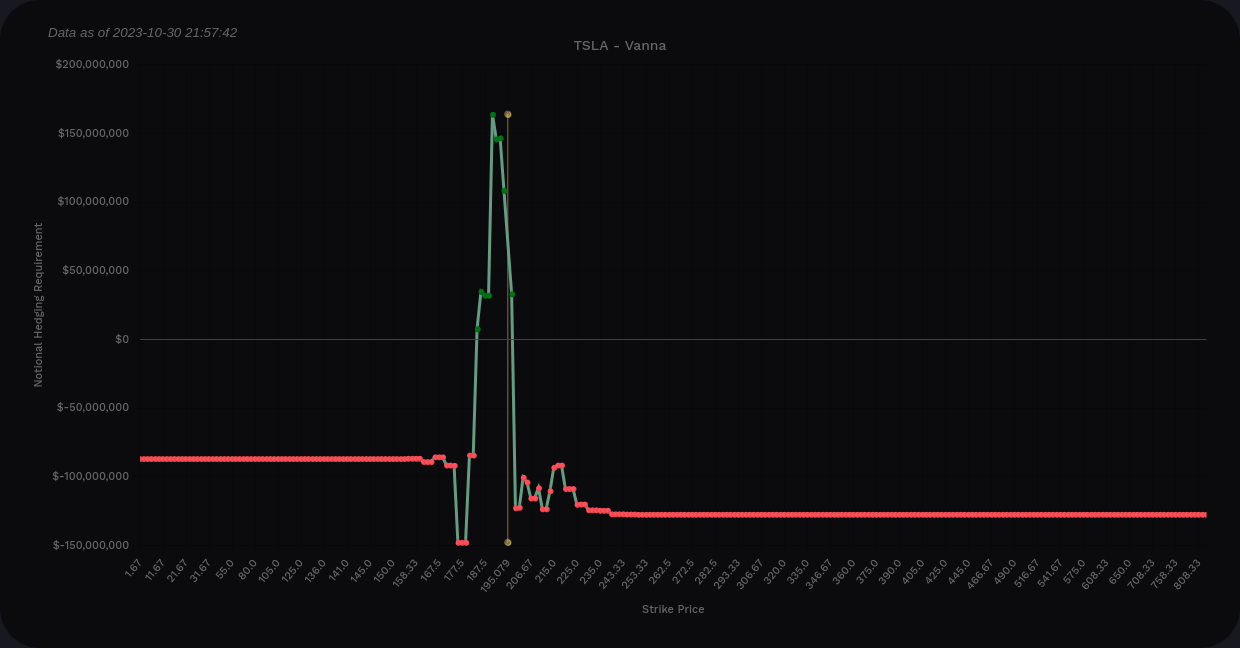
TSLA aggregate vanna from Volland
I've seen tons and tons of longer-term TSLA plays lately and that can skew vanna a bit, especially for those like me who are trying to trade TSLA in a 45-60 day timeframe. If we examine TSLA's vanna through 12/15 only, we get a slightly different look.
Vanna is much more positive on the curve chart, which is more bullish than the aggregate charts. However, our biggest positive bar is at $195 with the $197.50 bar getting canceled out by stronger negative vanna at $200.
Could we move up with an IV crunch? It's possible, but vanna might not be involved with that move.
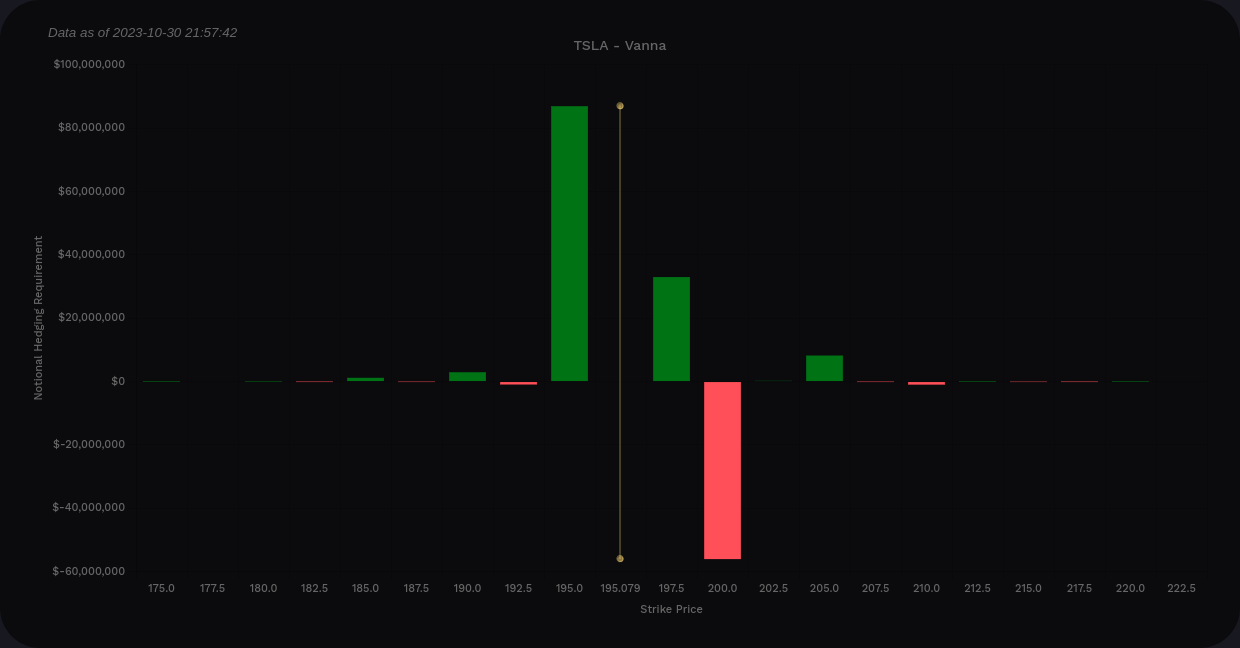
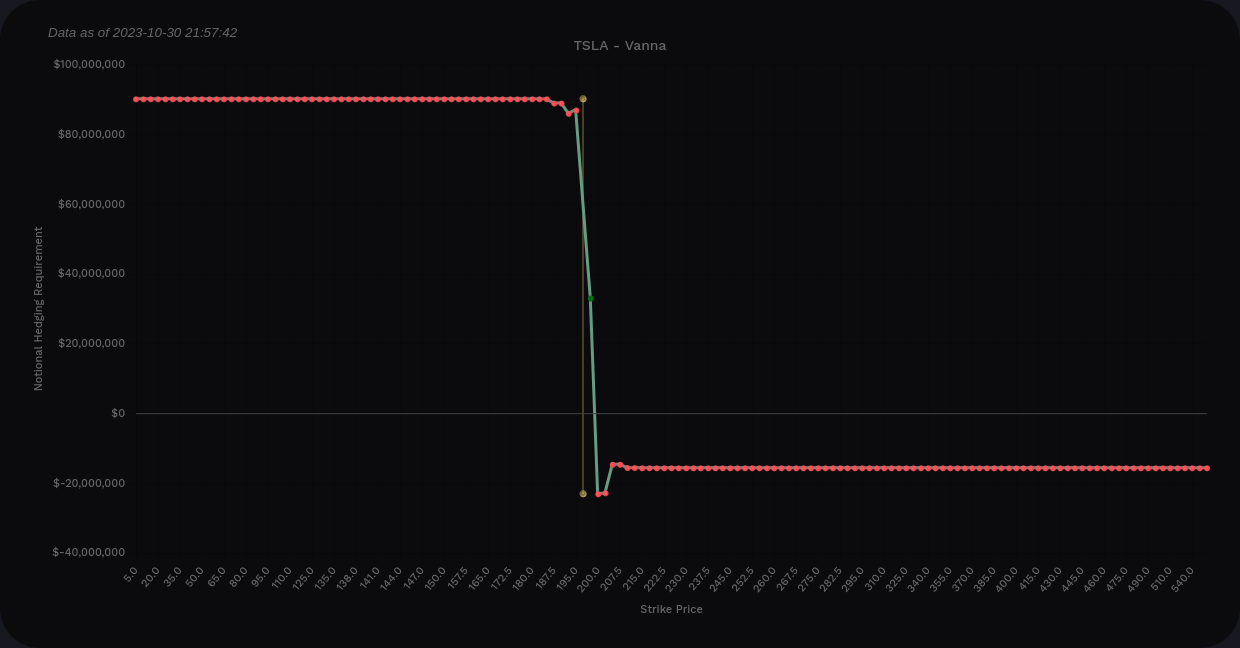
TSLA vanna from Volland through 12/15 only
Gamma
Volland's delta-adjusted gamma (DAG) flips the bars above the current price so we can look at all the bars consistently. Gamma can't tell us much about direction, but it can give us an idea of where price can move freely or accelerate (red bars) and places where it can get stuck or repelled (green bars).
TSLA's aggregate DAG suggests $190 and $200 as areas where price will be repelled, but the effect looks small. $195 is likely going to be the biggest magnet for price and that's where it was pulled to yesterday.
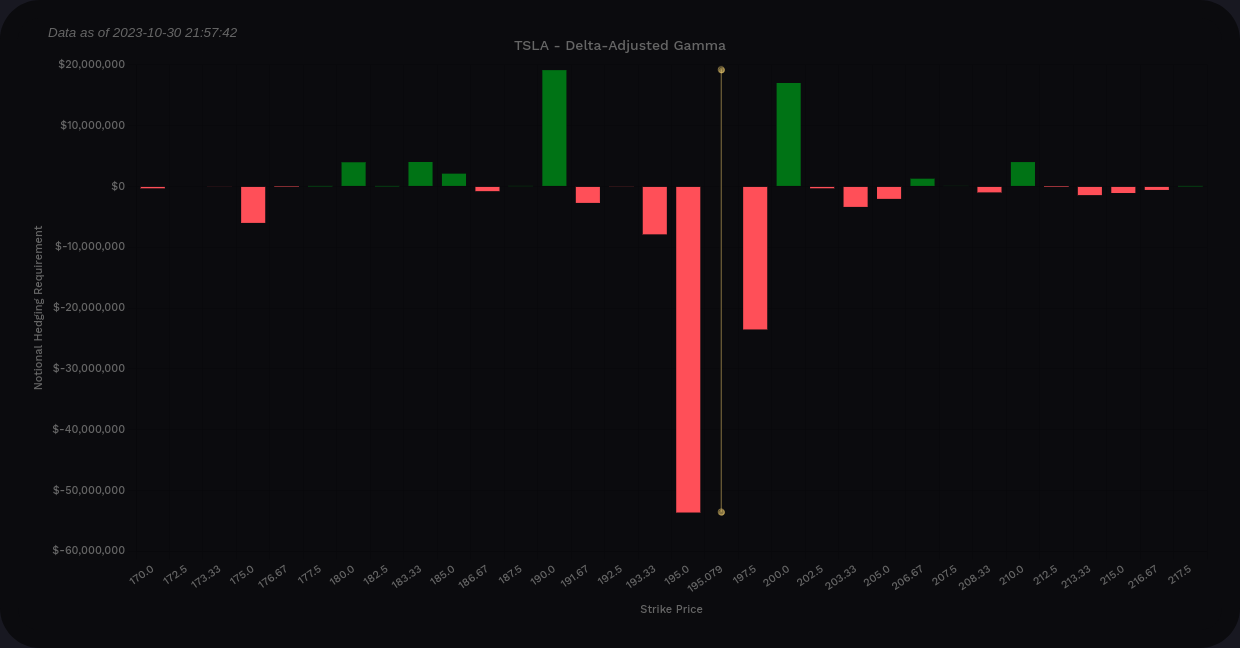
Through 12/15, it's all negative gamma and it's centered around $195-$197.50. There's not much resistance here from gamma.

Trading volume
Someone told me about Volume Leaders and I decided to do a trial just to see if it would give me more data for making trades. It tracks big volume moves in various stocks, including dark pool trades and other off-market trading.
The challenge here is that it won't show directionality. It just shows you levels where very large trades were made and then you have to infer what those levels might mean for the stock's future. TSLA had some large block trades on the exchanges earlier this week and each was followed by a move to the downside. There was another one just yesterday around $197.

I haven't figured out how to use this data yet, but if you have ideas, please let me know!
Chart
The only way I can describe TSLA's chart is very interesting. We're sitting at some key turning point levels where TSLA can make a stand or take a turn for some very low price targets.
TSLA is trading right on the discount zone this morning and the VWAP lines up from the COVID high/low sit in the $180s.
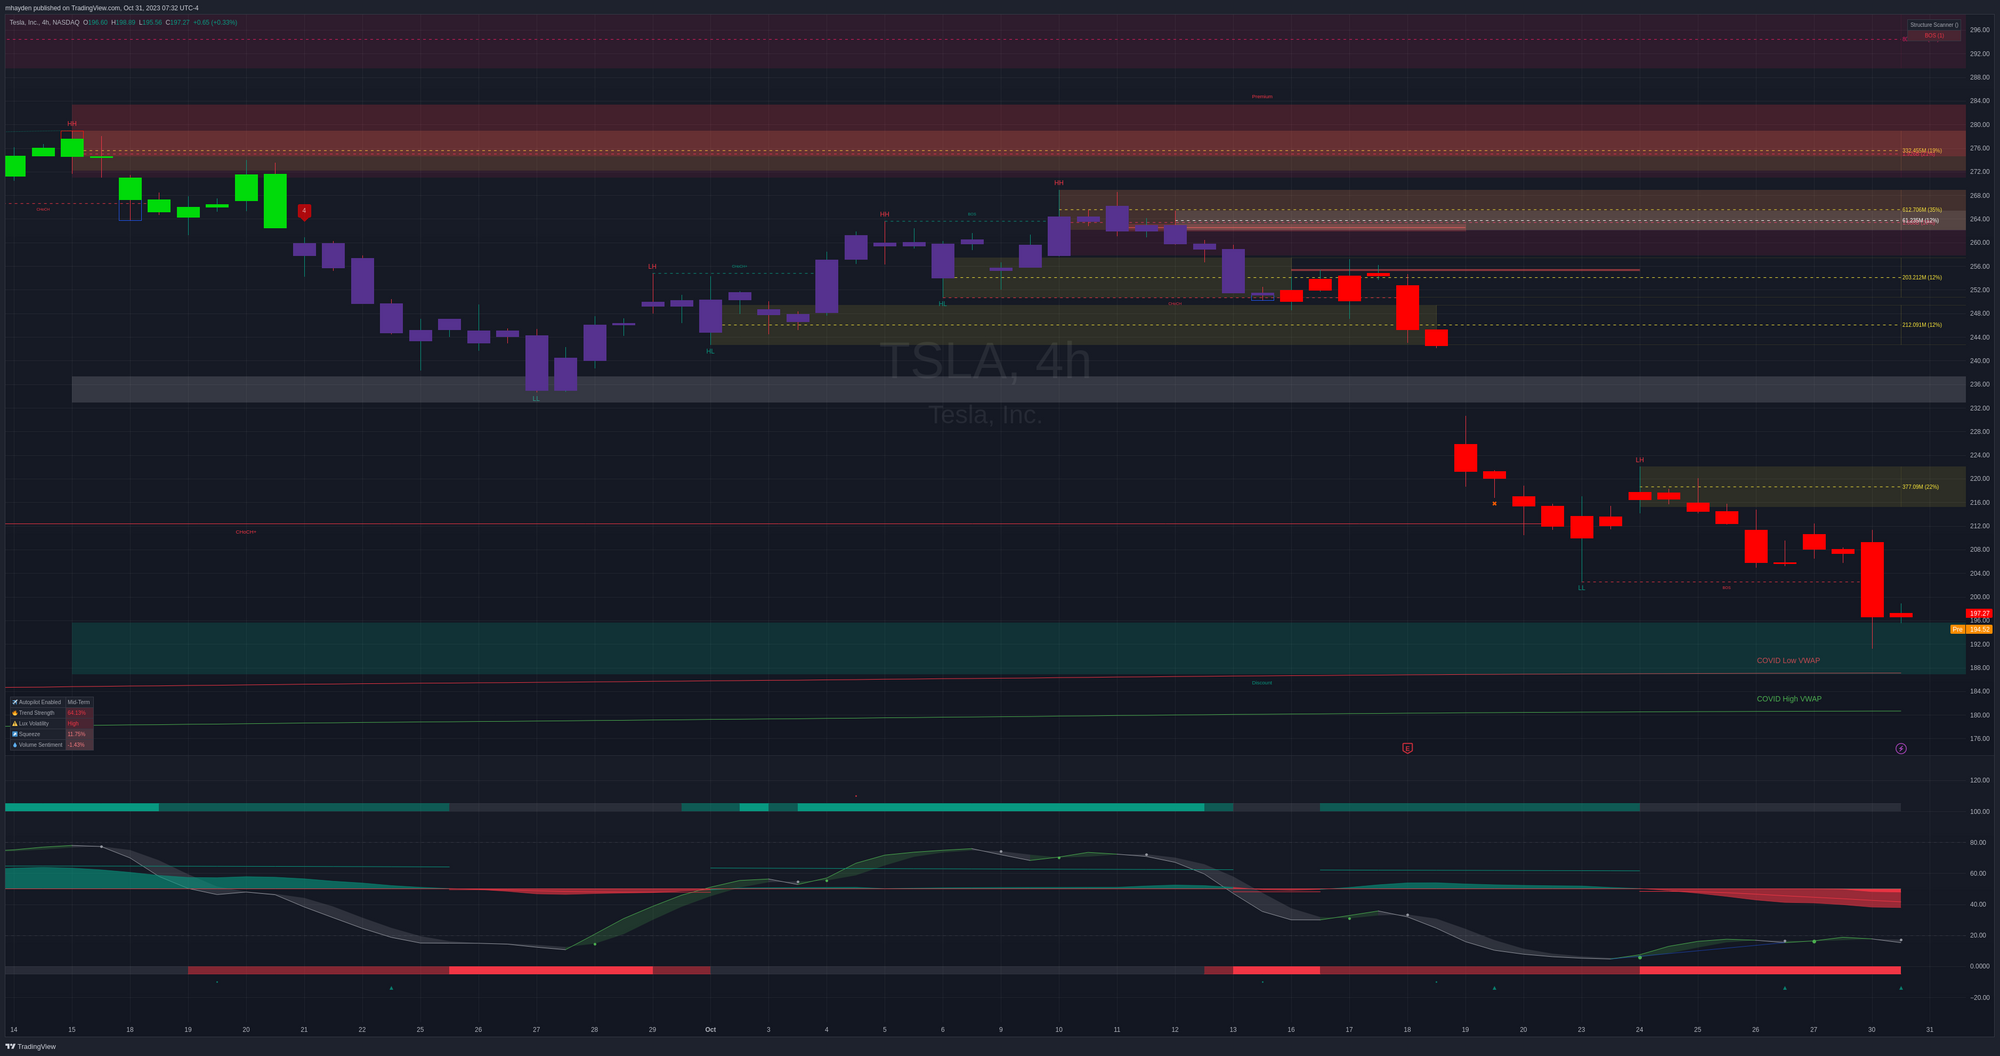
If we lose these levels, we're looking at returning to May's order blocks and those don't start until $160. Yikes. You can see those levels on the zoomed out chart below.

The oscillator along the bottom of the chart has some promising signs. Yes, the money flow is horribly bearish and getting into overflow territory (the lighter red part within the darker red area), but the oscillator wave is moving up slowly but surely as the stock heads down. The bullish divergence here is marked with a blue line on the wave.
If you scan back to mid June, the oscillator wave was really high and made a bearish divergence before TSLA began its slide down. That was a much longer time period divergence than our current one, but this will be something to watch. In addition, TSLA has had three bullish contrarian arrows show up since 10/19. I love seeing two of these and the third usually gives me confidence that something is about to turn around.
Thesis
TSLA has definitely been beaten down since earnings. The overall condition of the market and the expense of borrowing money certainly hasn't helped its situation, either. However, this is a critical spot for TSLA to slow the slide as we're near multiple critical levels.
I'm sitting on some long TSLA shares, a short $240 12/15 call, and a short $220 12/15 put. The put looks pretty terrible right now but I'm not eager to get deeper into the TSLA mess until I have a confidence that it's going to make a turn. If it does turn upwards, I have enough positive delta in play that I should be pretty happy. 😉
If I were to make a trade right now, I might eye a short strangle with the put side near the $160 order block and the call side around TSLA's gap from earnings, possibly around $235-$240. TSLA does have some really wild swings of $80-$100, so be prepared to defend that call if the Santa Claus rally gets underway.
Good luck to everyone today! 🍀
Discussion