Will Apple's earnings bear fruit?

AAPL earnings are tonight so let's see what traders are betting on through December. 🍎

Howdy! 👋 Today will be my first time covering AAPL on the blog, but let's give it a shot! I'll dig into vanna, gamma, and the chart to see what the market is pricing in for AAPL earnings this afternoon after the market closes.
All investments come with significant risks, including the loss of all capital. Please do your own research before investing, and never risk more than you are willing to lose. I hold no certifications or registrations with any financial entity.
A common refrain this week is: "Will AAPL save the market?" Let's get into the data.
High level market look
It's difficult to fight against the flow of the whole market, so let's see where we stand today across some of the charts that matter to me the most.
I have S&P 500, NASDAQ, and Dow Jones futures running across the top of the chart here. ES caught a 2 out of 4 bullish indicator according to LuxAlgo's Signals & Overlays indicator and all three futures indices are above their bearish clouds. This is a great sign for bullish traders and I'm eager to see these clouds turn blue.
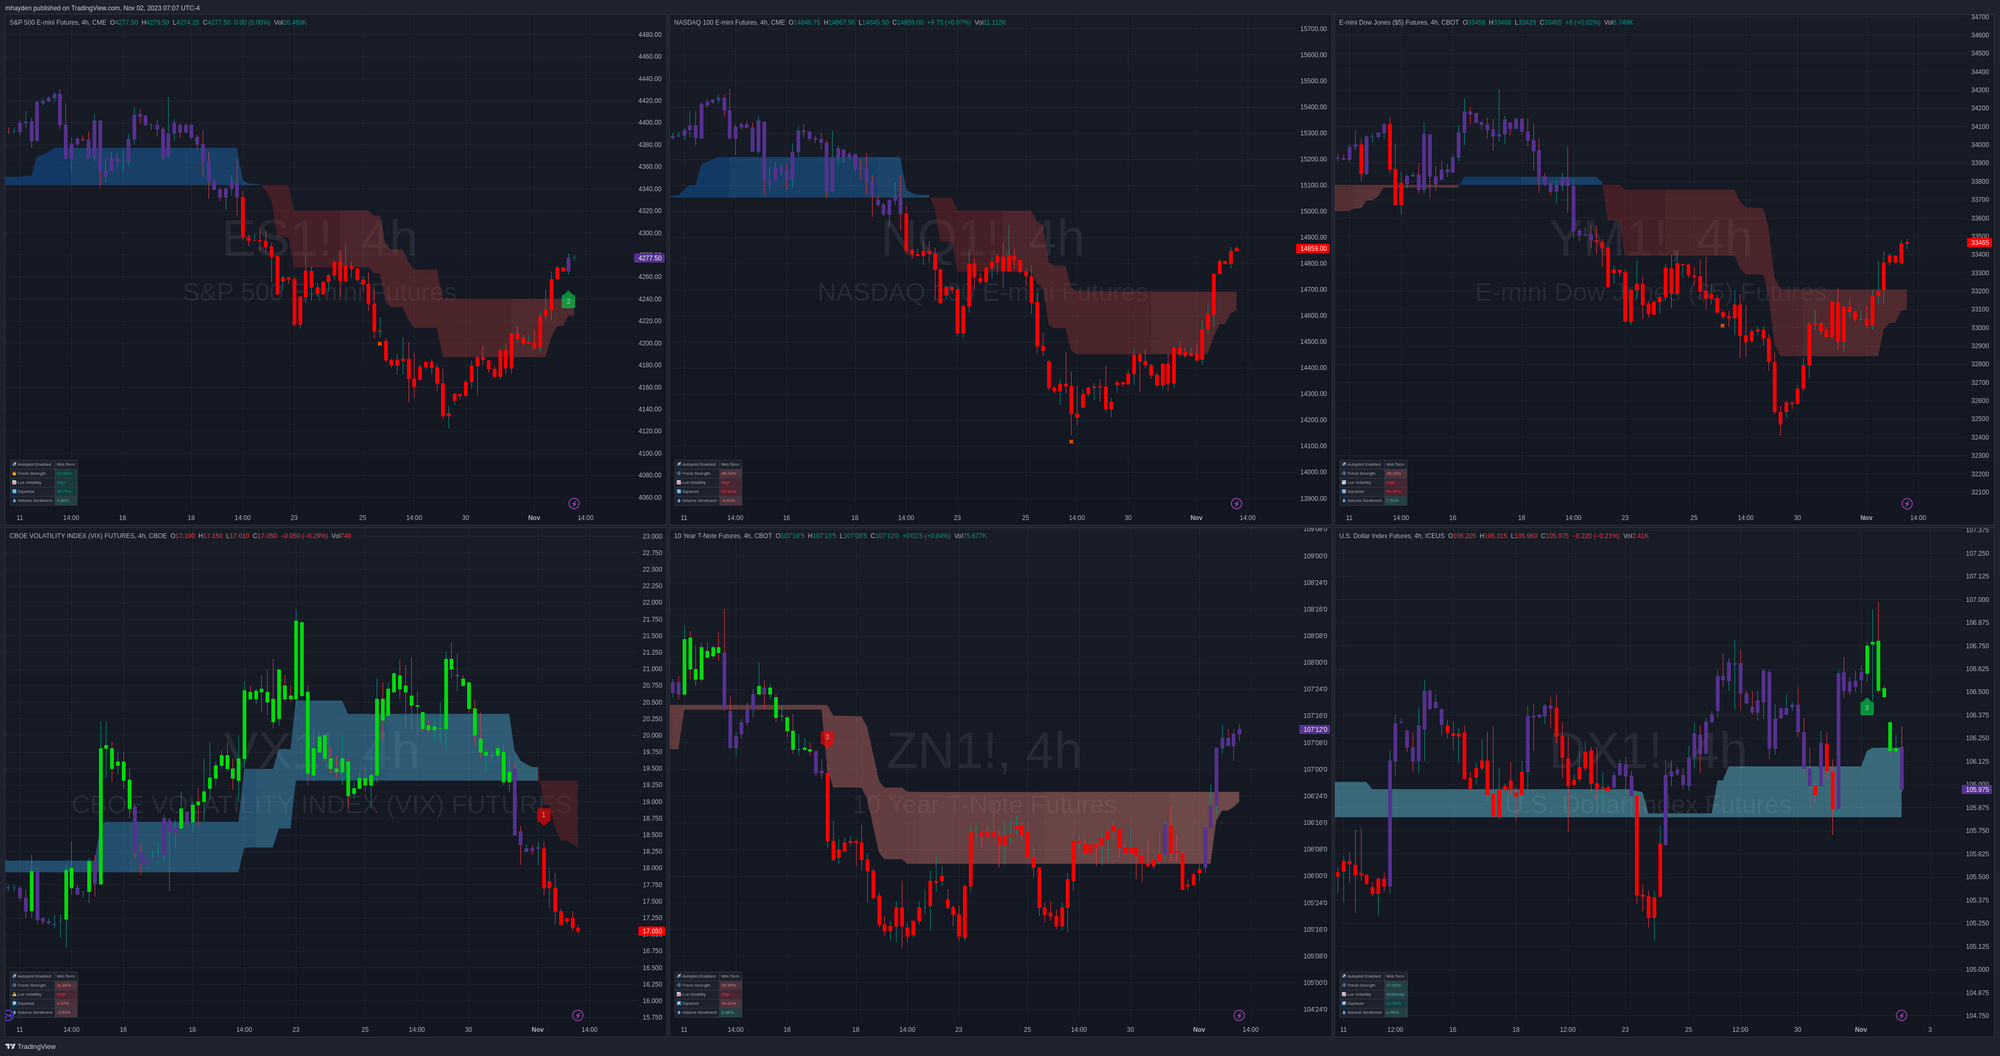
On the bottom, I have the VIX, 10 year Treasuries, and US Dollar futures. The VIX caught a 1/4 bearish trend change and the cloud turned bearish as well. Treasuries climbed and yields fell. The dollar is still on a bullish trend overall, but it gapped down and might test the bottom side of its cloud. All three of these should provide a bullish lift to equities if they continue as they are now.
AAPL vanna
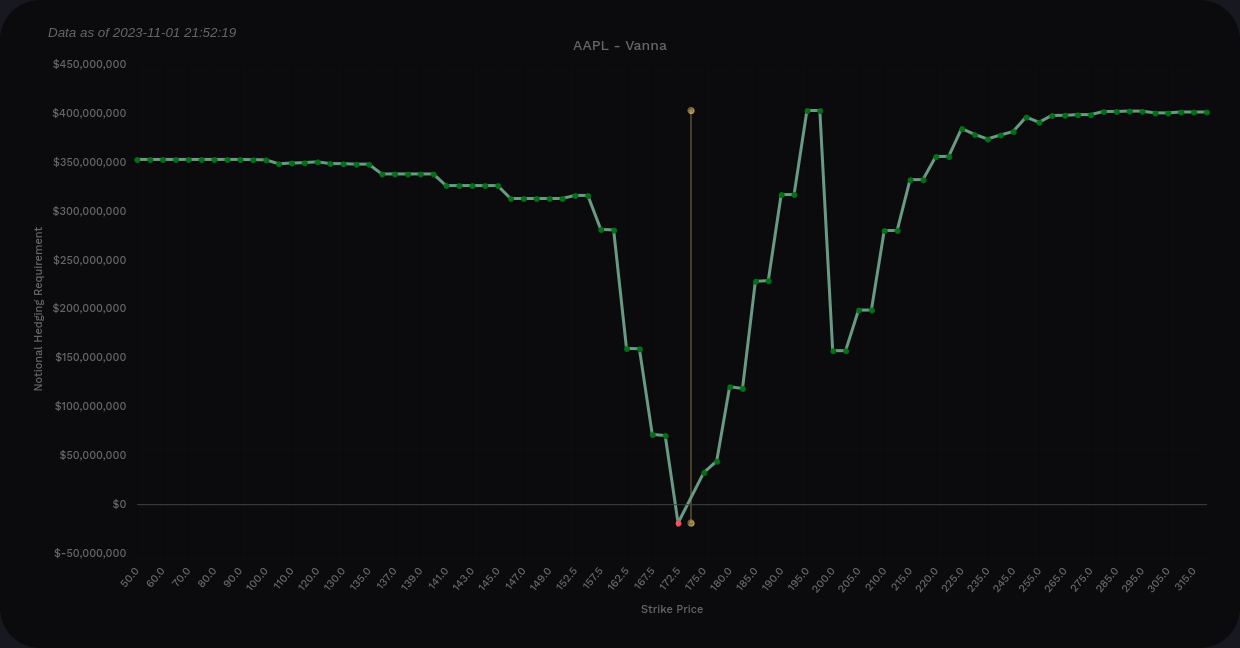
Sometimes vanna charts are mangled and difficult to read, especially those for SPY or SPX. However, AAPL has one of the cleanest vanna charts around. All of these charts come from Volland.
The curve is almost entirely positive with some decent dips in places. This should provide bullish pressure if IV continues to contract (and we saw earlier that it's likely to contract).
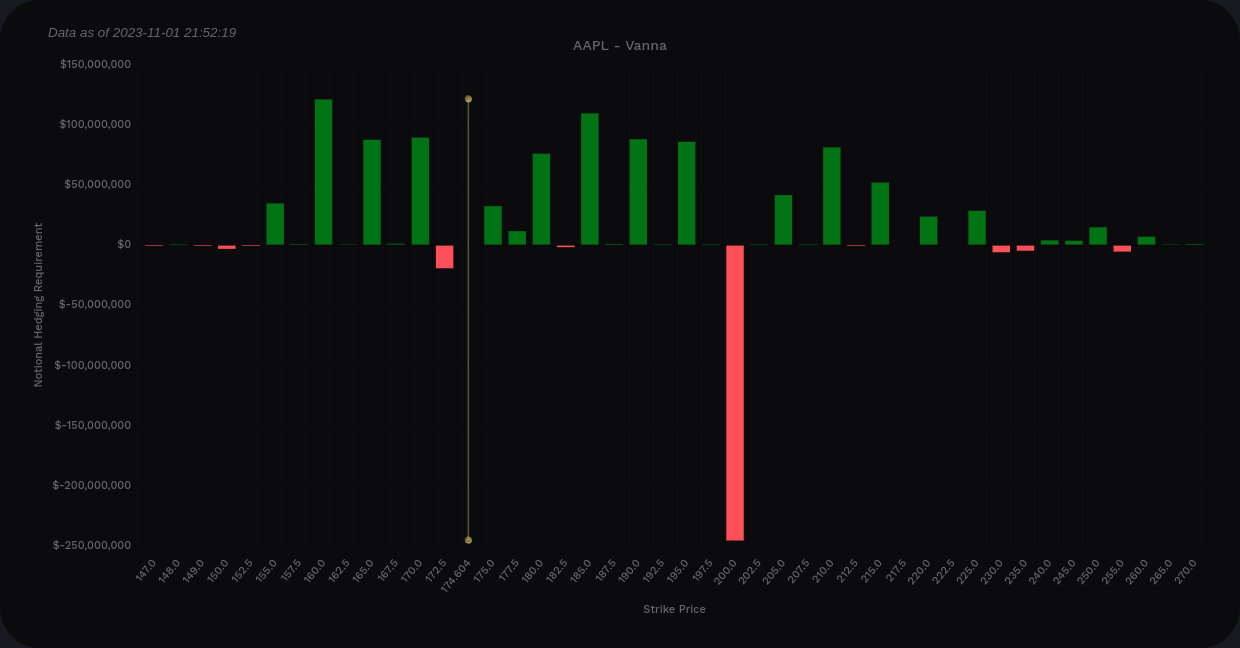
AAPL vanna on aggregate from Volland
The bar chart shows a distinct negative vanna zone at $200 that hasn't moved in weeks. This will fight upward price movement even if IV contracts. It's a good spot to watch.
Positive vanna is scattered from $160 to $225 mostly on the $5 and $10 strikes. $160 and $200 look like the "bookends" for price here. I'd love to see us over $200 again, but it's going to take some decent volume and perhaps a change in sentiment after earnings to make that happen.
I'm trading the 12/15 expiration heavily right now, so let's take a peek at AAPL for now through 12/15 only:
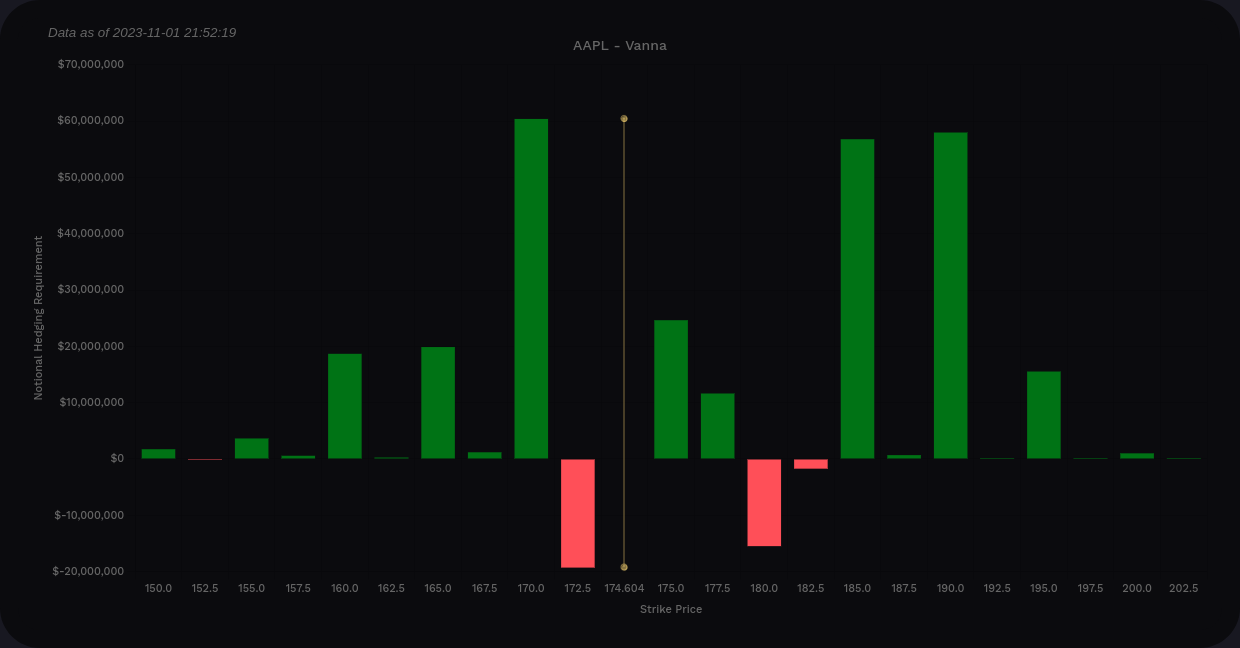
Again, we're positive almost all the way across the board with some negativity around $172.50 and $180. The big $200 negative vanna level doesn't affect us through 12/15 based on this chart. $170 to $190 looks like our boundaries for trading through 12/15.
Gamma
Volland's delta-adjusted gamma (DAG) through 12/15 shows some light resistance to moves below $172.50. $175 is the largest magnet for price, but $170 also looks like a contender here. Getting over $175 could add some momentum for a move higher.

Chart
There's a lot going on in this AAPL 4h chart with LuxAlgo's indicators, so let's break down the bullish and bearish aspects.
What looks bullish? 🐂
- AAPL had a good bounce off the discount zone around $166 and started a steady grind higher into a 4h order block at $173. It seems to be making good progress through that order block, but I'd like to see a retest.
- Next stop upward is the equilibrium zone around $178 and then some order blocks from $179-$182.
- The oscillator (bottom of the chart) shows positive money flow and the wave is headed upward strongly after a bullish indicator appeared.

What looks bearish?
- AAPL had a bearish liquidity grab yesterday afternoon as it tried to break out of that 4h order block. This does happen at times, especially on the 4h blocks. The best thing here would be to see AAPL push out the top, retest, and go higher.
- We recently made a lower low, but so did the overall market. This wasn't unique to AAPL.
- Our current market structure is still a bearish change of character (CHoCH).
Thesis
Earnings are binary events and they are almost always dangerous! I'd argue that even if I had AAPL's SEC filing sitting in front of me right now (and I don't!), I could make a bet in the market today based on that data and still lose money. 😉
Vanna suggests we're in a $170-$190 range through 12/15 and gamma suggests we're unlikely to drop below $170 again. $175 seems like the temporary target.
I sold a $170p/$190c strangle for 12/15 on AAPL and it hasn't moved much so far. I expect that should change a bit after tonight's earnings call. That trade is nearly netural with yesterday's deltas and it's one standard deviation from the current price on both sides. $160/$200 would have been safer, but it was a lot less premium.
Good luck to everyone today. 🍀
If there's a ticker you know of that you'd like to get in my blog post rotation, let me know! It needs to be one that has good options volume since that's what I like to trade. 🤔
Discussion