Wow, AMD. Where to next?

The AMD rally continues, but where does it end? More importantly, does it end? Let's dig into the current data. ❄️

Happy Monday! 🌄 I'll take a look at AMD today and see where we might be going after this recent rally.
A quick note: I'll be on the road the next couple of days and you might not see a post again from me before Christmas. I hope you and your family enjoy the holidays and I wish you and yours a prosperous new year! 🎆
All investments come with significant risks, including the loss of all capital. Please do your own research before investing, and never risk more than you are willing to lose. I hold no certifications or registrations with any financial entity.
AMD's performance this year is incredible:
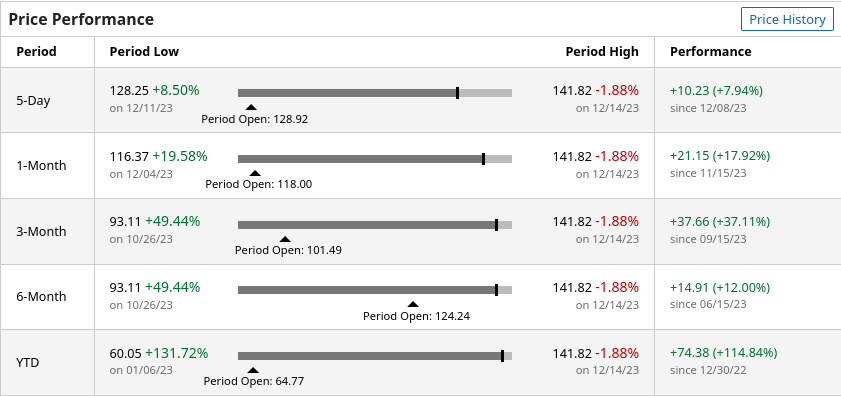
Let's see where it might be going now.
Vanna
AMD's vanna chart has remained bullish for a while now and this week's chart is no exception.
The vanna curve shows plenty of positive vanna above price that could be a magnet to pull the price upward. The biggest level sits at $150, followed by $145. The $160 level has done a slow crawl upwards over the past few weeks.
Bear in mind that this chart is bullish only if IV is remaining calm or reducing further. This chart looks pretty bearish if IV begins rising.
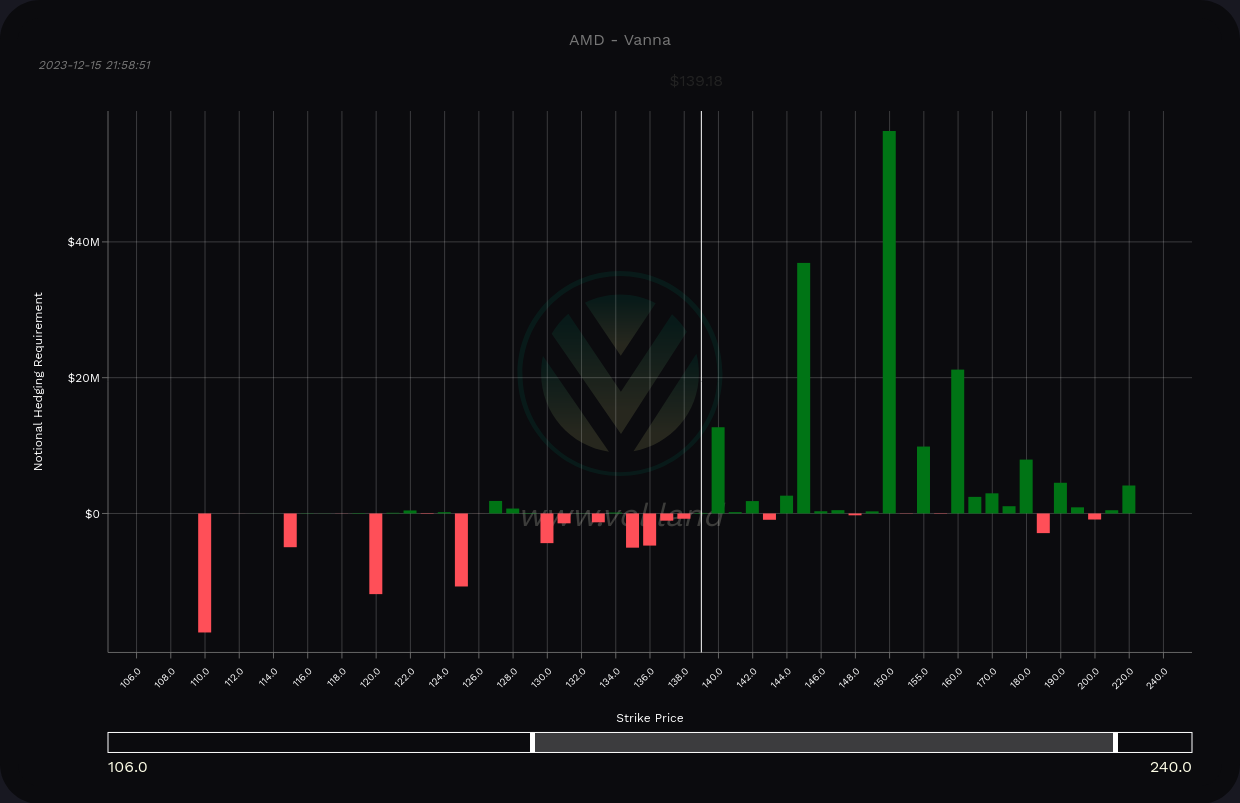
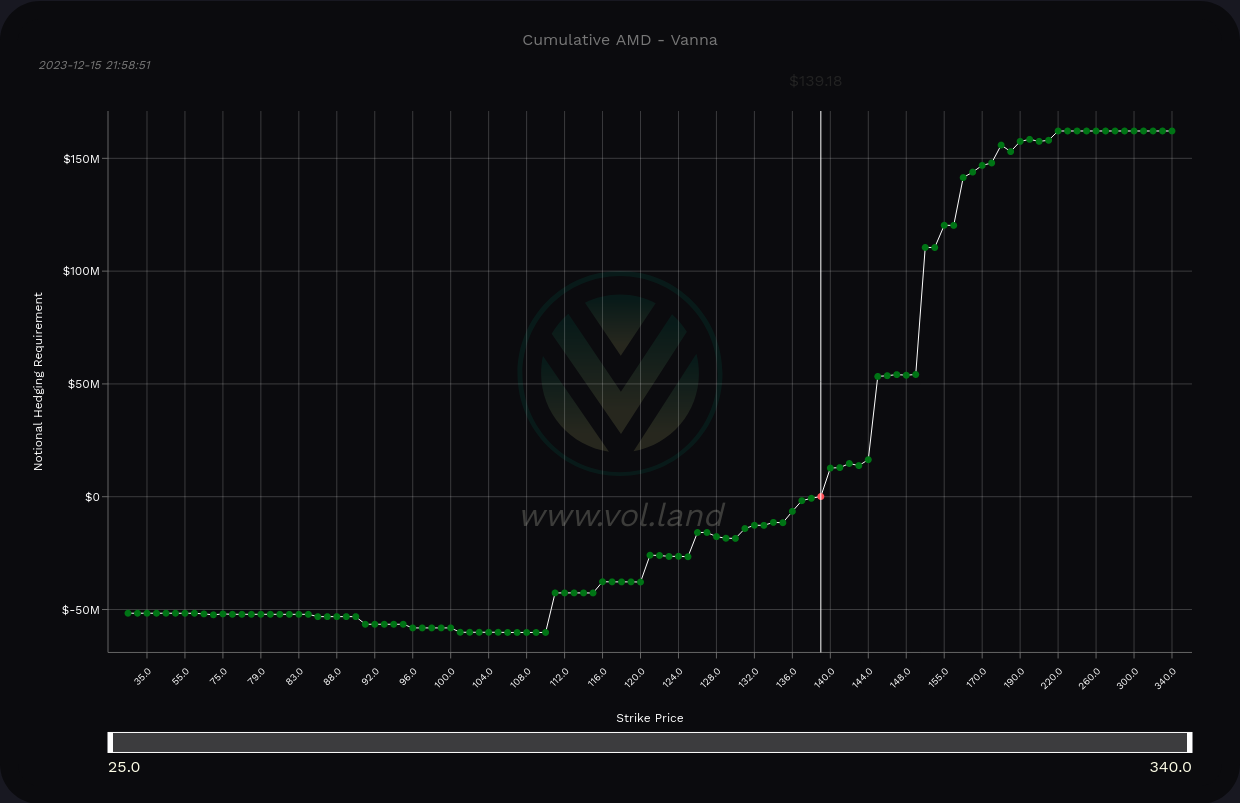
AMD vanna across all expiration dates
I'm mainly trading through 2/16 right now and AMD looks almost the same through that expiration date:
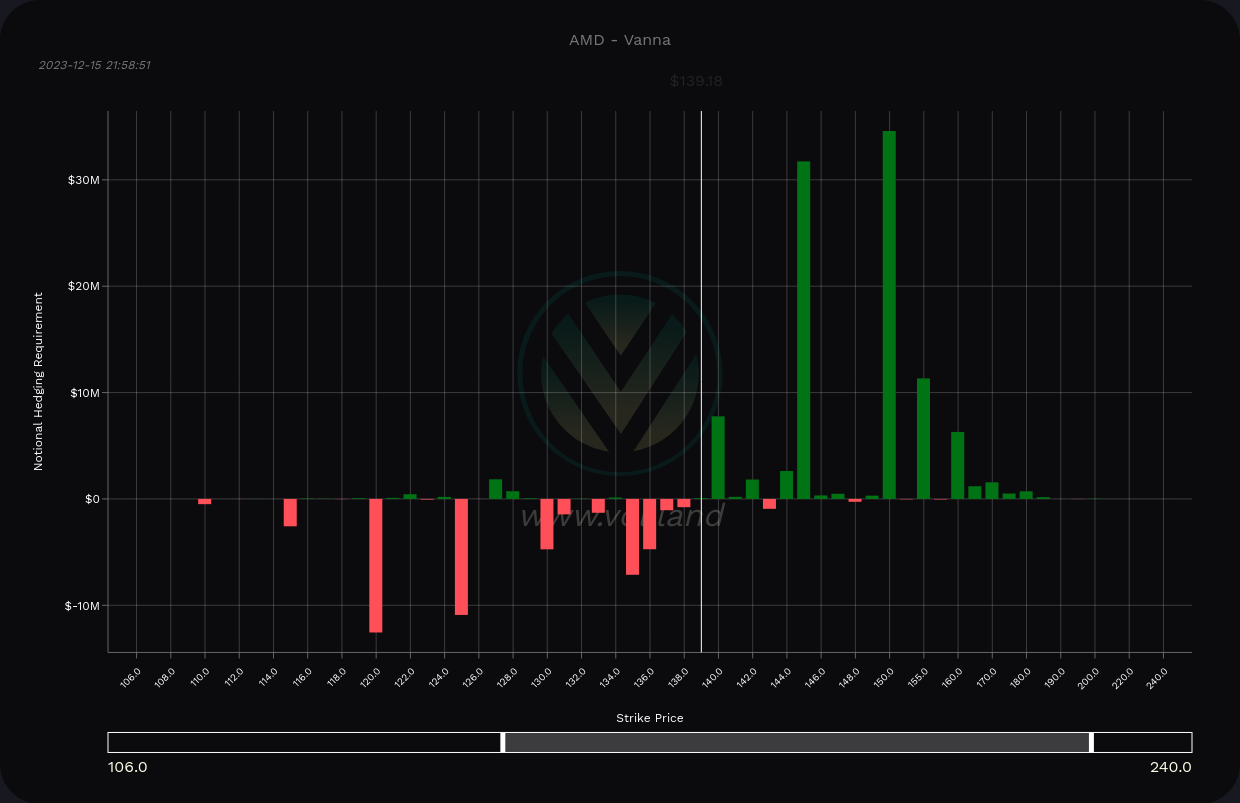
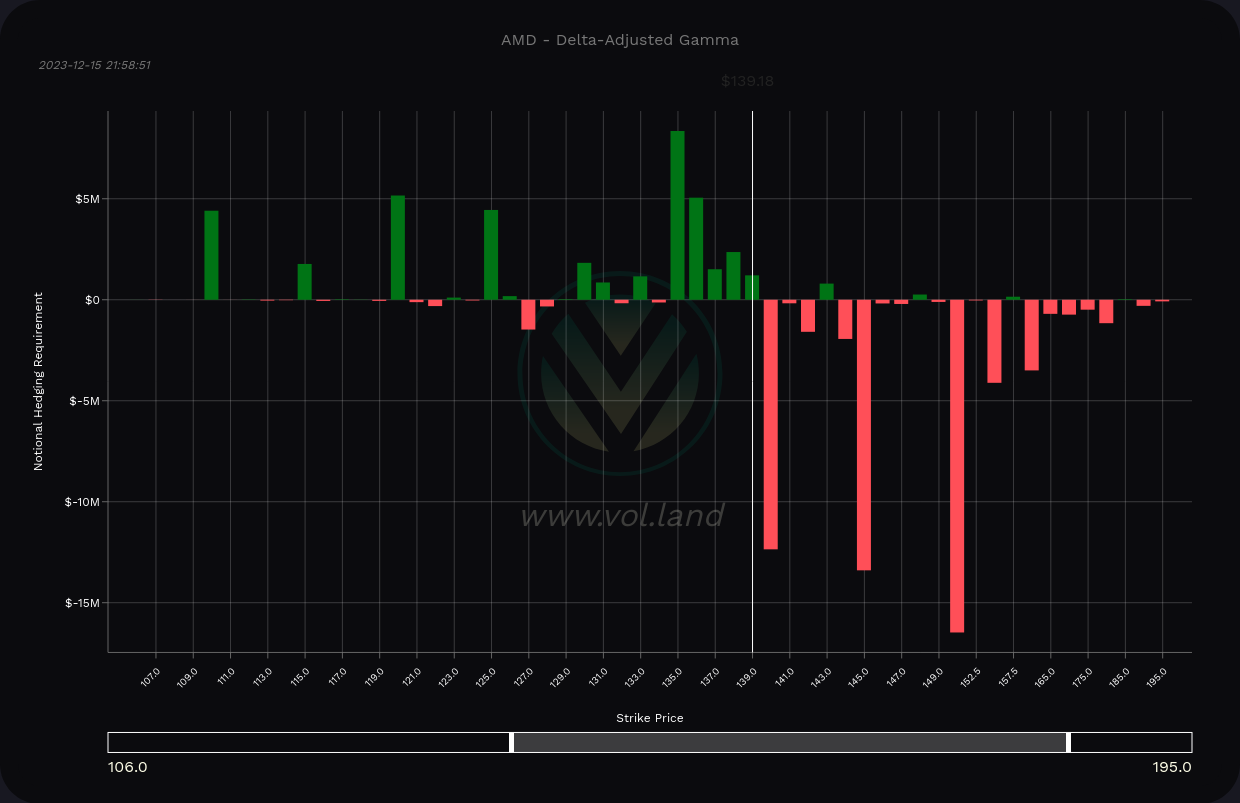
Gamma
Volland's delta-adjusted gamma (DAG) charts suggest that selling pressure increases at the $140, $145, and $150 levels. I'd much rather see selling pressure be strong on the lowest level and then soften as price heads higher, but this is what we have.
Bear in mind that gamma effects are highly localized whereas vanna requires some room to operate. That means that vanna might pull us up towards the levels and then we might stall out without additional volume. The two weeks around Christmas and New Years are notoriously light on volume.
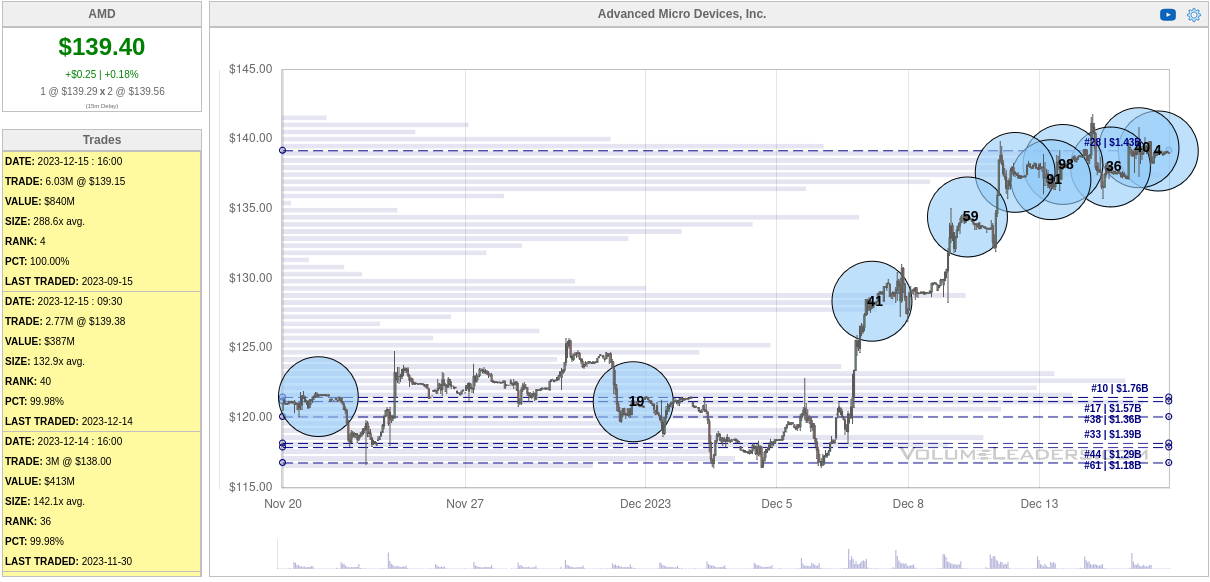
Institutional trades
This is where things get really interesting. Institutional traders peppered the AMD chart recently with some big trades, especially the #4 biggest trade at the close on Friday. That was an $840M trade. 👀
I keep seeing this pattern with institutions where they nibble on a stock with trades that are relatively small for institutions but large enough to show up on the chart. Eventually they like what they see and they make a massive (usually top 10 biggest) trade to go for it.
So we know that institutions are expecting some kind of a move here, but it's difficult to tell the direction. Could it be profit taking before a drop? Could it be a bet on a move higher, possibly to all time highs?
Vanna suggests we could go higher, but gamma suggests we're going to hit some big speed bumps on the way, the first of which is at $140 (where AMD's price sits this morning). Maybe the charts can give us some more ideas.
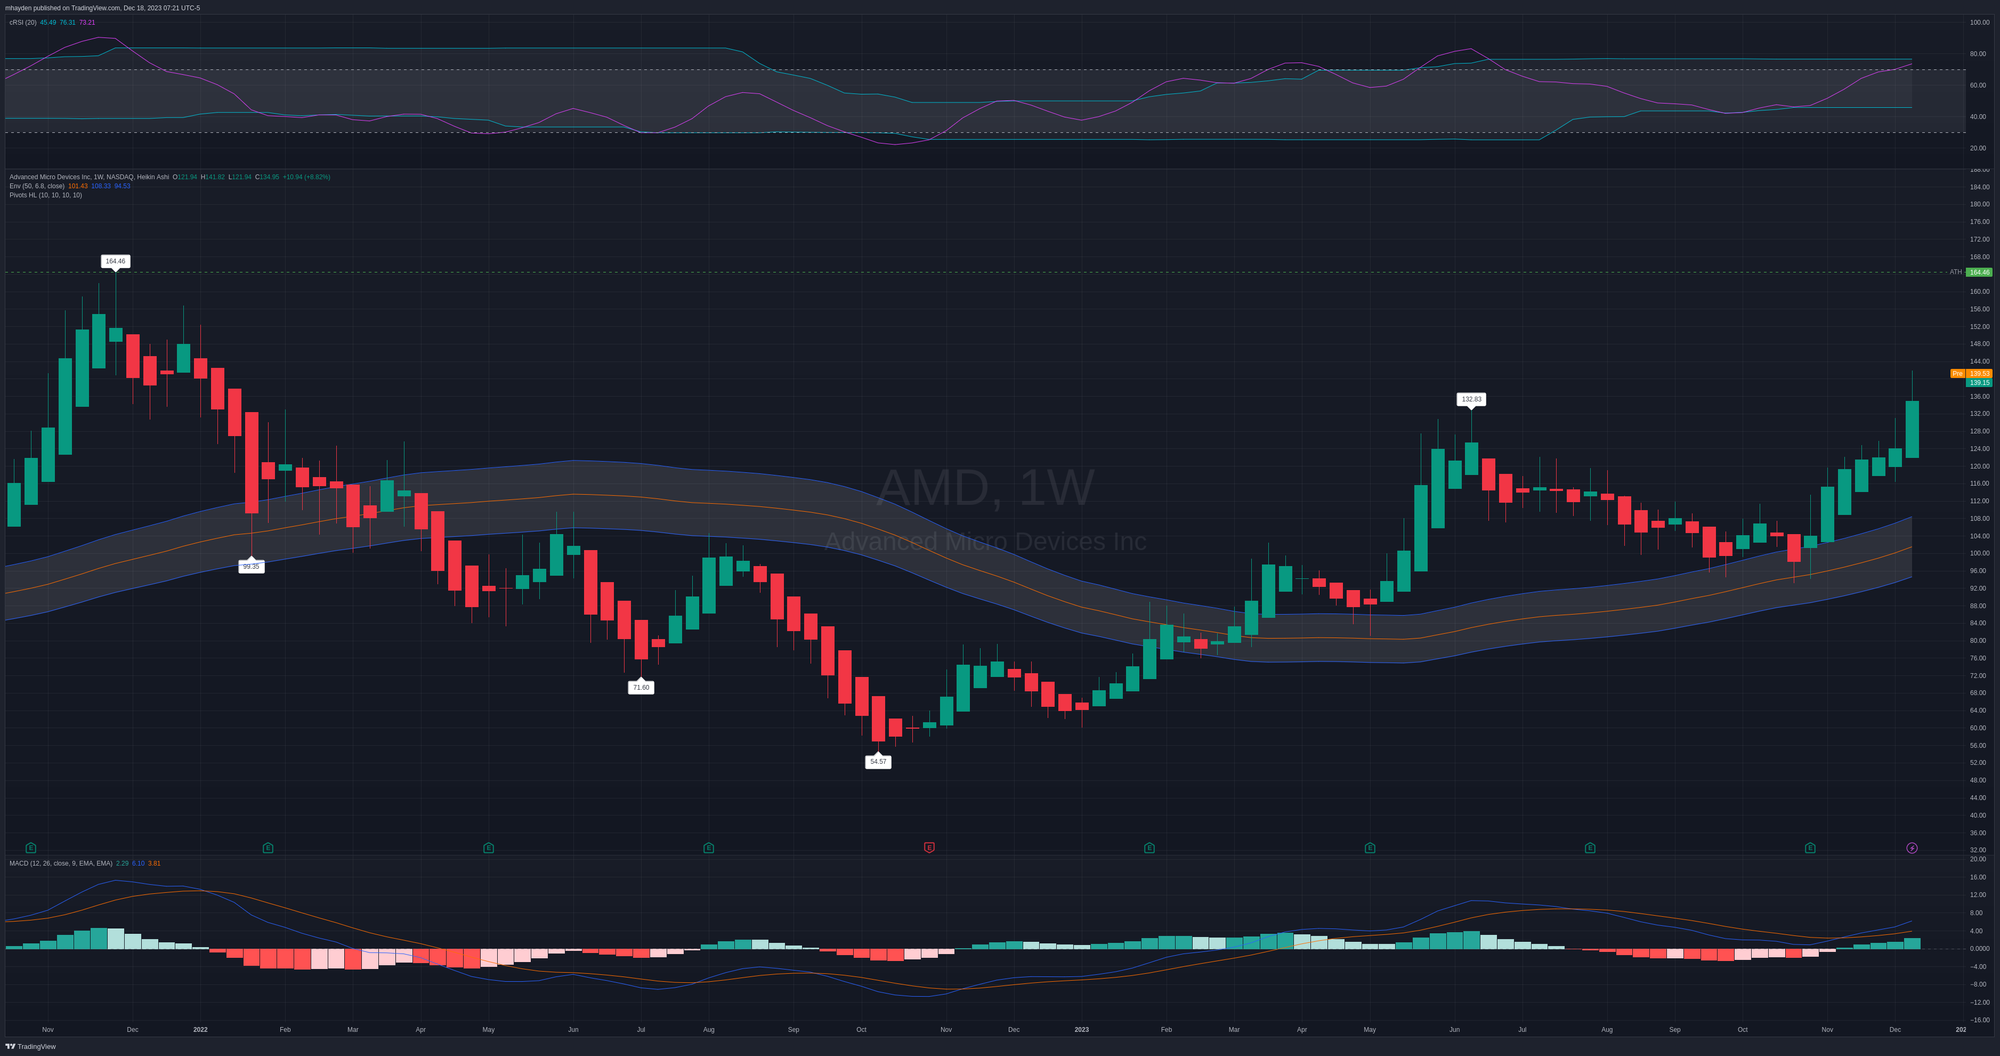
Charts
AMD's all time high sits at $164.46 and that was back at the end of 2021 before a long slog down to $54.57 in the fall of 2022. Weekly RSI is approaching the top of the channel, but AMD has broken through this channel before multiple times. The MACD made a bullish cross on November 13 and never looked back. The histogram is growing and this indicates bullish strength.
What I really like here is that AMD ran down to an increasing 50-week moving average and bounced quickly from that level.
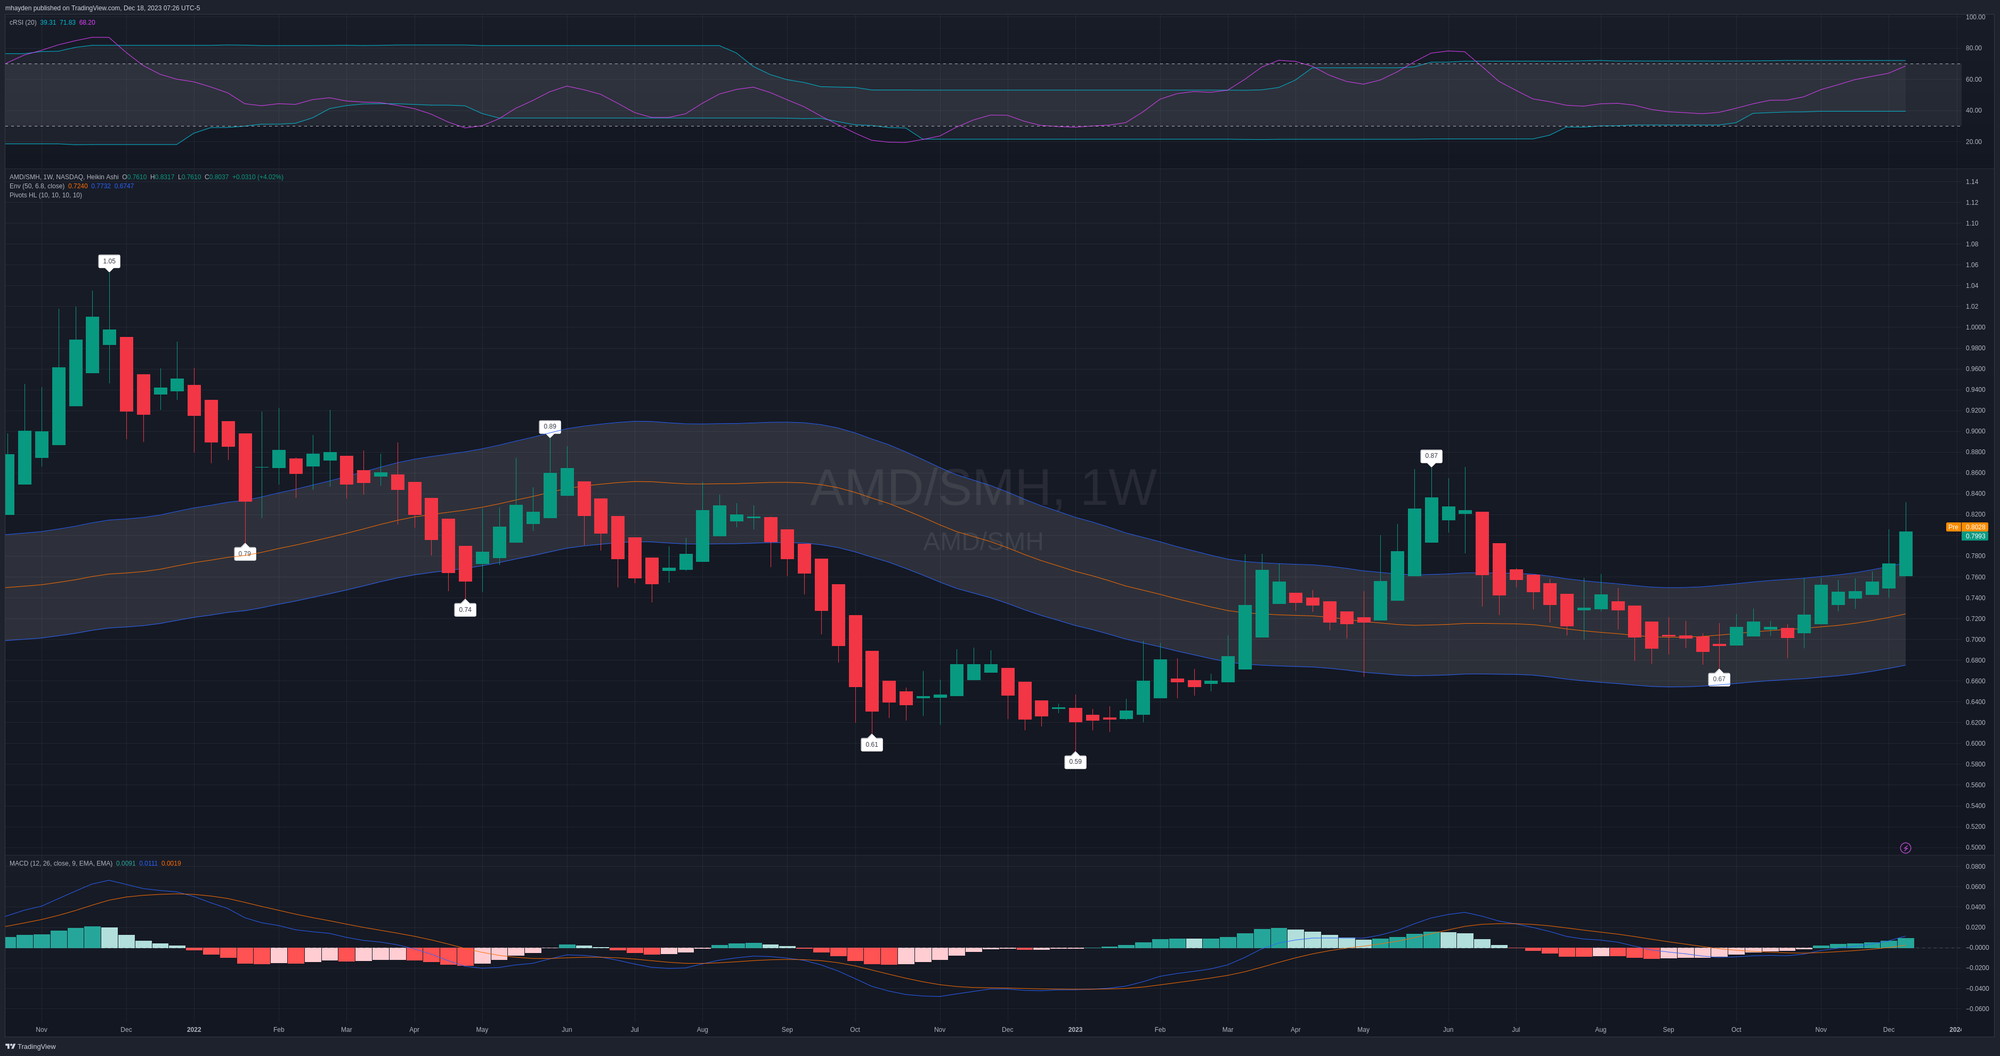
So how else can we compare AMD to its peers? Here's a weekly chart of AMD versus SMH, the semiconductors ETF. AMD looks strong relative to the constituents in SMH and this ratio is lifting off its 50-week moving average as well.
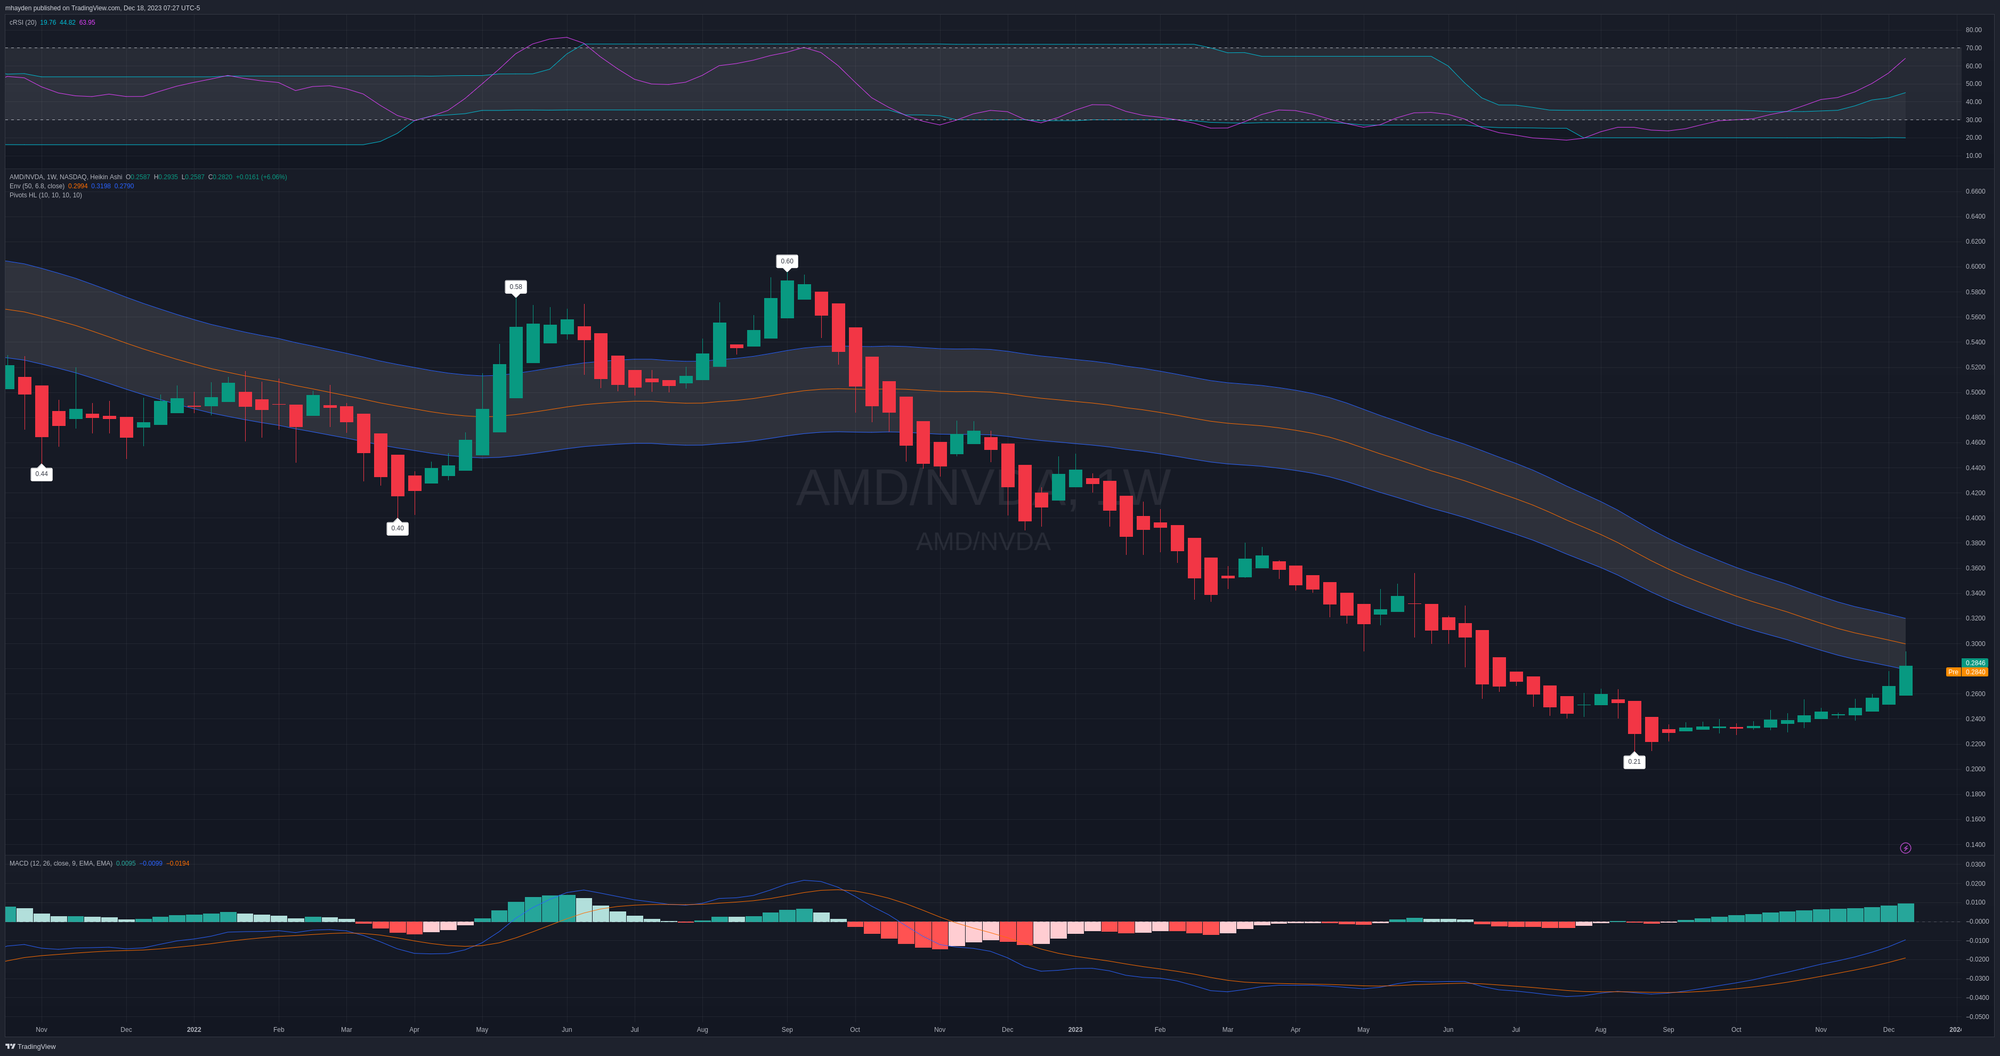
So we know that AMD is pretty hot within the artificial intelligence (AI) space, so let's compare it to NVDA. Wow. The RSI is skyrocketing and the MACD looks incredibly strong. The MACD remains above zero, but its current slope suggests it won't be there for long.
This may be a good chart to watch in the near term since it looks like this relationship could break out above the 50-week moving average soon. 👀
Thesis
Although I've been pretty good at picking AMD's bottoms, I've been notoriously bad at picking tops. I was assigned on plenty of covered calls last week at a good profit, but I left plenty of money on the table.
Just to recap, here's what we have:
- Vanna suggests $150 as the most likely target with $160 growing (requires calm or decreasing IV to work)
- Gamma suggest we will see stronger selling pressure from dealers on the $5 increments at $140 and above
- Institutions have been trading this rally all the way up and made a massive 6M share trade on Friday at the close
- AMD is gaining strength against its peers in SMH as well as NVDA in a head-to-head comparison
- AMD's weekly RSI looks pretty overbought, but it has blasted through these levels in the past
- MACD looks good on all time frames
Even after this amazing rally, I still think AMD has some more room to climb. However, this climb might be a little bumpier than the previous ones.
I've sold AMD puts on dips recently and I have several on the board:
- 2x 1/19 $130p
- 2x 1/26 $125p
- 2x 1/26 $128p
These price levels feel high to me, but then again, AMD hasn't shown this much strength in a while. I keep seeing so many bearish macro posts everywhere and I'm keeping those in mind, but for the time being, I'll go with the flow.
I do feel that something is going to increase volatility at some point soon, but I don't know when. Cem Karsan thinks it will be around January's VIX expiration on 1/17. In the meantime, I'll trade the charts in front of me.
Good luck to all of you today! 🍀
Discussion