CRWD analysis for April 19

The information security sector always seems to have high demand, but how does CRWD compare to its peers? Let's dig into the data and plot a course. 🗺️

Happy Friday! It's been a wild week in the market and I just realized it's been two months since I last looked at Crowdstrike's charts in detail on the blog. Information security has been a hot topic lately, especially with the xz incident.
All investments come with significant risks, including the loss of all capital. Please do your own research before investing, and never risk more than you are willing to lose. I hold no certifications or registrations with any financial entity.
Let's dig into some technical and fundamental data.
Charts
CRWD had an excellent second half of 2023 and early 2024 has been quite good, too. However, it seems to be rolling over at a pace slightly faster than the rest of the market (see the purple area at the top below where CRWD strength is compared to the SPX index):
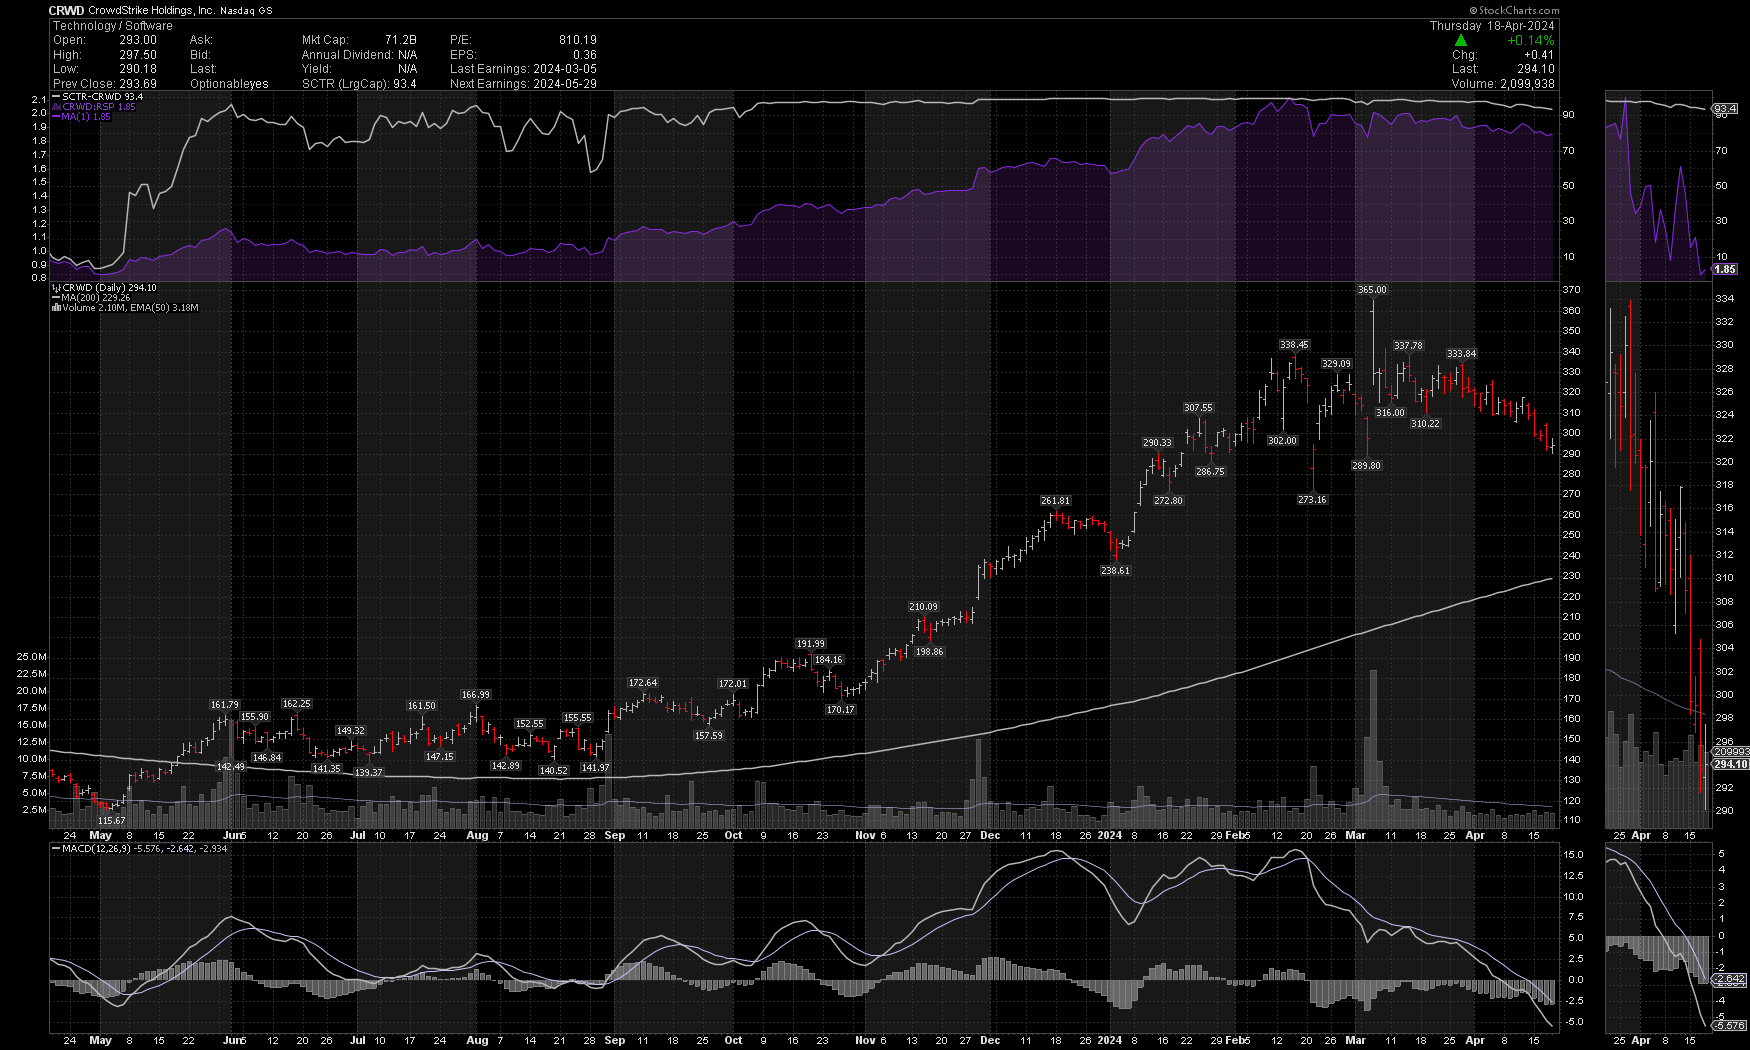
CRWD lifted off the 200 day moving average (grey line curling upwards) back in the summer of 2024 and never looked back. $365 proved to be a limit after a good earnings call as well.
The current chart looks much like most of the charts I've examined lately: lots of choppy price action followed by a rolling over look with a terrible-looking MACD below the zero line. It still has a very high SCTR rating from StockCharts at 93.4 and that includes quite a few different short, medium, and long term technical indicators.
Relative performance
CRWD is part of CIBR, the biggest cybersecurity ETF with about $5B of assets. We already saw CRWD's strength relative to SPX in the previous chart (purple area at the top), but how does CRWD fare against the CIBR ETF?
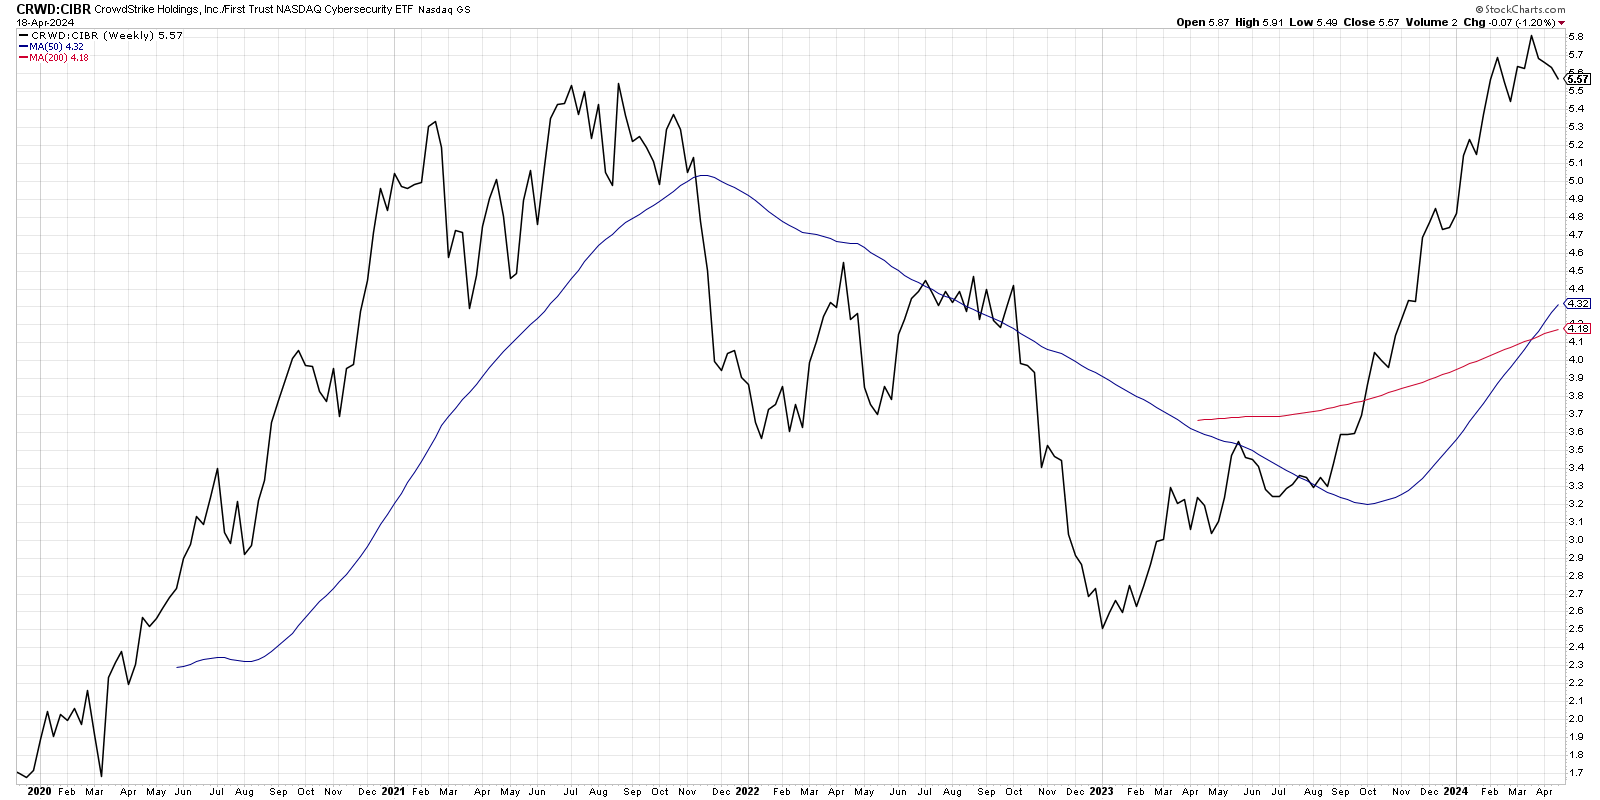
CRWD showed incredible strength against its peers until the interest rate fears hit around 2022. There are much larger and well-established companies inside CIBR, including AVGO (Broadcom), CSCO (Cisco), and Infosys (INFY). It's likely that rising interest rates posed a larger threat to CRWD than some of its larger competitors.
However, it found its strength early in 2023 and ran higher against the ETF up until March 2024. As interest rate worries return, it's making a small turn to the downside once more. However, both moving averages show an upward trend overall.
Institutions
Volume Leaders offers charts showing where institutions and traders with deep pockets are making moves in a particular stock. Although it doesn't show directionality of the trades, it gives us a better idea of the price levels where these investors are really interested.
Let's start with a 90 day look with closing trades (market on close orders usually made by large funds) included:
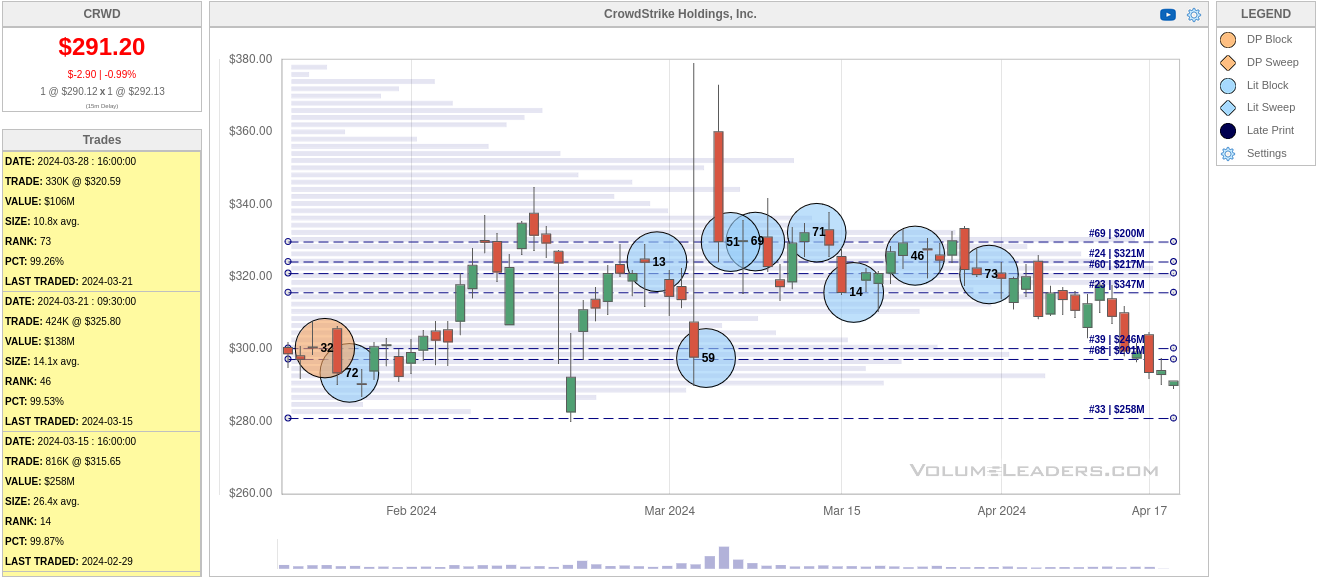
The level from $317-$330 has tons of activity here. Below there, there's more interest around $300. However, we have dipped just below these big institutional levels recently. There's definitely a chance that many of the trades near the top included traders taking profits on CRWD after the amazing run, or they might be going short.
Closing trades sometimes mask other interesting trades with their huge size, so let's take another 90 day look with closing trades removed:
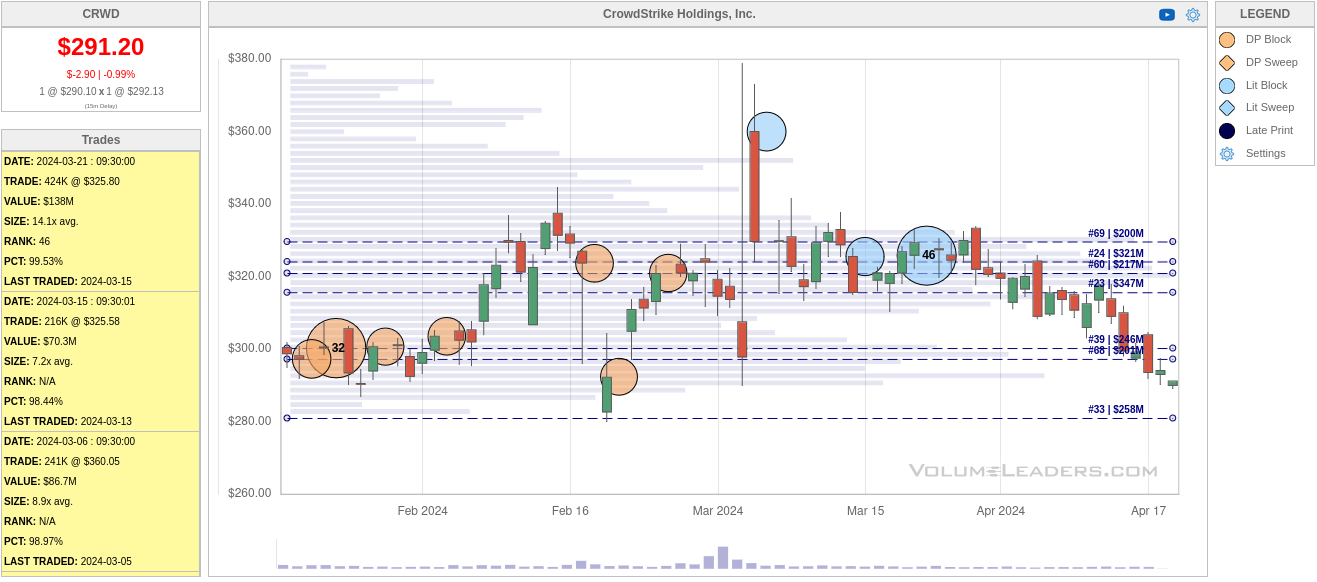
Much of the dark pool activity is around the $300 level and it appeared prior to the peak around $365 back in March. There was a huge trade in the second half of March around $330 that was the 46th biggest of all time. That might have been a clue that the stock was about to make a turn.
Fundamentals
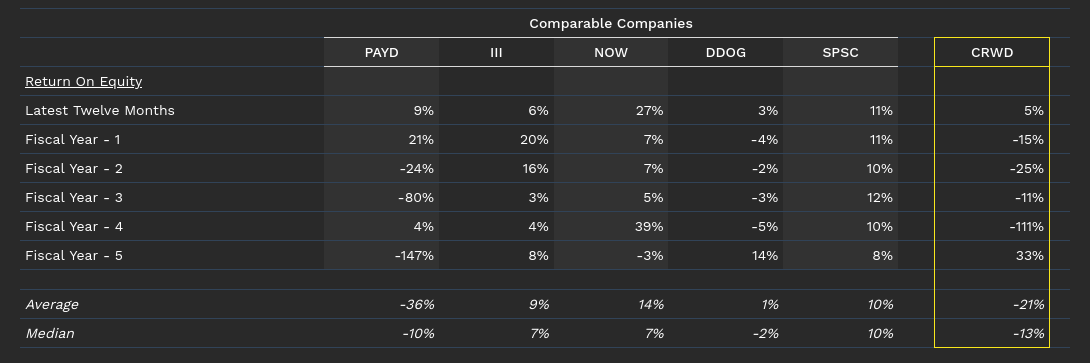
I'm much more of a technical trader than a fundamental one, but it's good to examine CRWD's fundamentals relative to its competitors to get the full picture. CRWD's return on equity finally turned positive over the last 12 months after being in the red for four years:
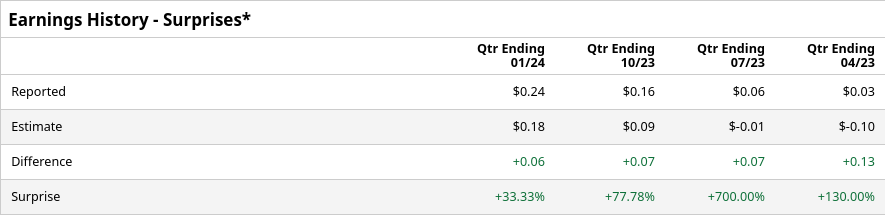
The P/E ratio for CRWD is 599 for the last 12 months and that's certainly quite high. Their earnings have surprised to the upside four times in a row:
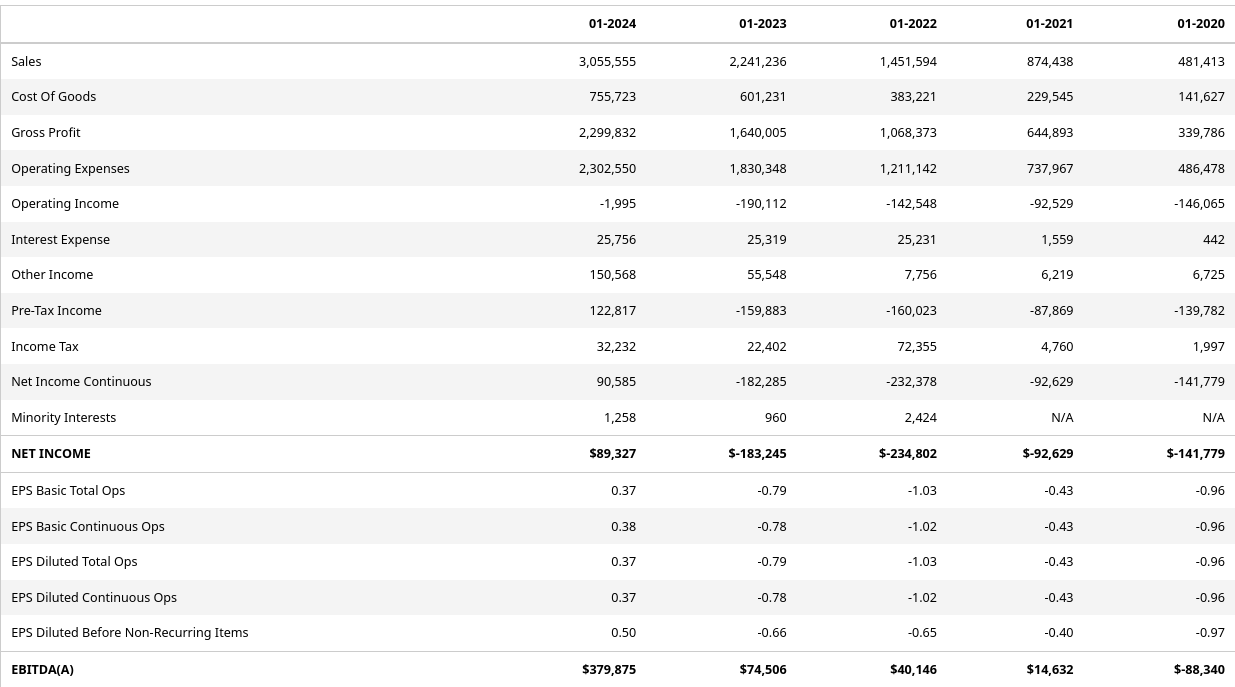
Gross profits have increased over time, but operating expenses have as well. Expense from interest has gone up dramatically.
Thesis
CRWD seems to be rolling over now much like the rest of the market. It might be headed down slightly faster than the overall market, but the balance sheet shows some promise. It also rallied hard out of the gate in early 2023 and that's always something I like to see.
The current P/E ratio is quite high, but CRWD is in a sector where demand is likely to increase as attacks become more sophisticated in general and we might see more AI-assisted attacks.
I had some positions recently in CRWD, but I don't have any on right now. I do have some trades on its competitors, including a short put on FTNT and a short strangle on PANW. If those end up getting closed, I'll consider a trade in CRWD.
Good luck to everyone out there today! 🍀
Discussion