NVDA analysis for April 17

NVDA's chart screams "air pocket" at first glance, but I dug a little deeper to see if there's possibly more to the story. 🔎

Happy Wednesday! It's been a while since I examined NVDA's price action and it seemed like a good time to revisit it. Earnings are still a ways away on May 22 but the semiconductor sector is certainly keeping things interesting.
All investments come with significant risks, including the loss of all capital. Please do your own research before investing, and never risk more than you are willing to lose. I hold no certifications or registrations with any financial entity.
Let's get into the data!
Charts
I'm typically a heavy TradingView user, but I've been giving StockCharts a try lately to reduce the input my brain is dealing with from the market. It's so easy to load up TradingView charts with so many indicators and lines that you get overwhelmed and miss out on the patterns. StockCharts forces you to think a bit more minimally without lots of things moving around all the time. We will see how it goes. 😉
Let's start with a yearly chart of NVDA with my current setup:
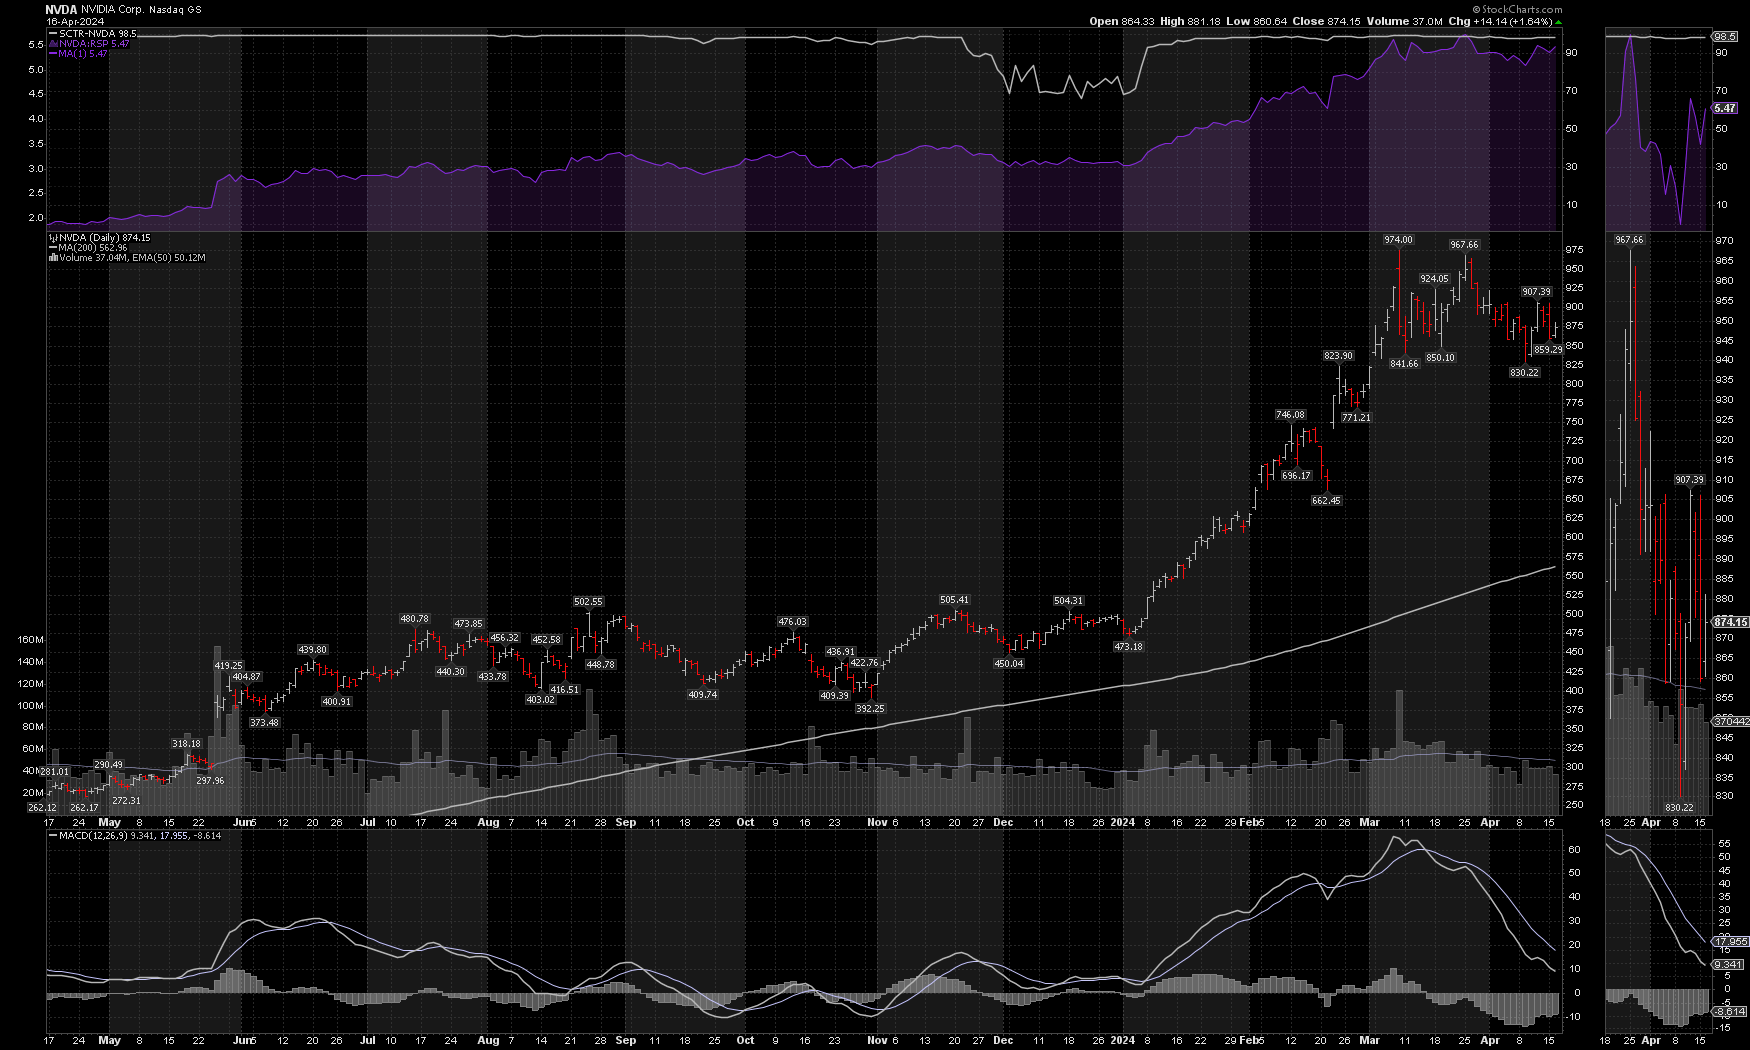
Starting from the top, here's what is on the chart:
- White line is the SCTR from StockCharts and it's based on several short, medium, and long term indicators weighted together. NVDA has a very high rating here at 98.5.
- Purple area just below it is NVDA's relative strength to RSP, the equal weighted S&P 500 index. When this goes up, NVDA is gaining strength among S&P 500 stocks. A drop in the purple area means NVDA is losing relative strength. NVDA has gained strength on the index all year long.
- On the price chart, the white line headed up is the 200 day moving average and it shows that NVDA is climbing.
- Below that is the volume with a 50 day EMA applied. Volume has drifted lower lately and that gives me some hints that we may be consolidating.
- Finally, there's a traditional MACD at the bottom of the chart. The downward slope looked horrible at first glance, but this is expected if a stock rallies with strength and then suddenly slows down. It doesn't mean that NVDA is headed down, but it does show that it's currently in a very different pattern from the rally.
The daily chart leads me to think we're in a consolidation period for the moment as the market digests lots of geopolitical and macroeconomic changes. Also, the semiconductor sector has been on an incredible run that likely needs a breather.
Let's switch to the weekly view and examine NVDA since COVID:
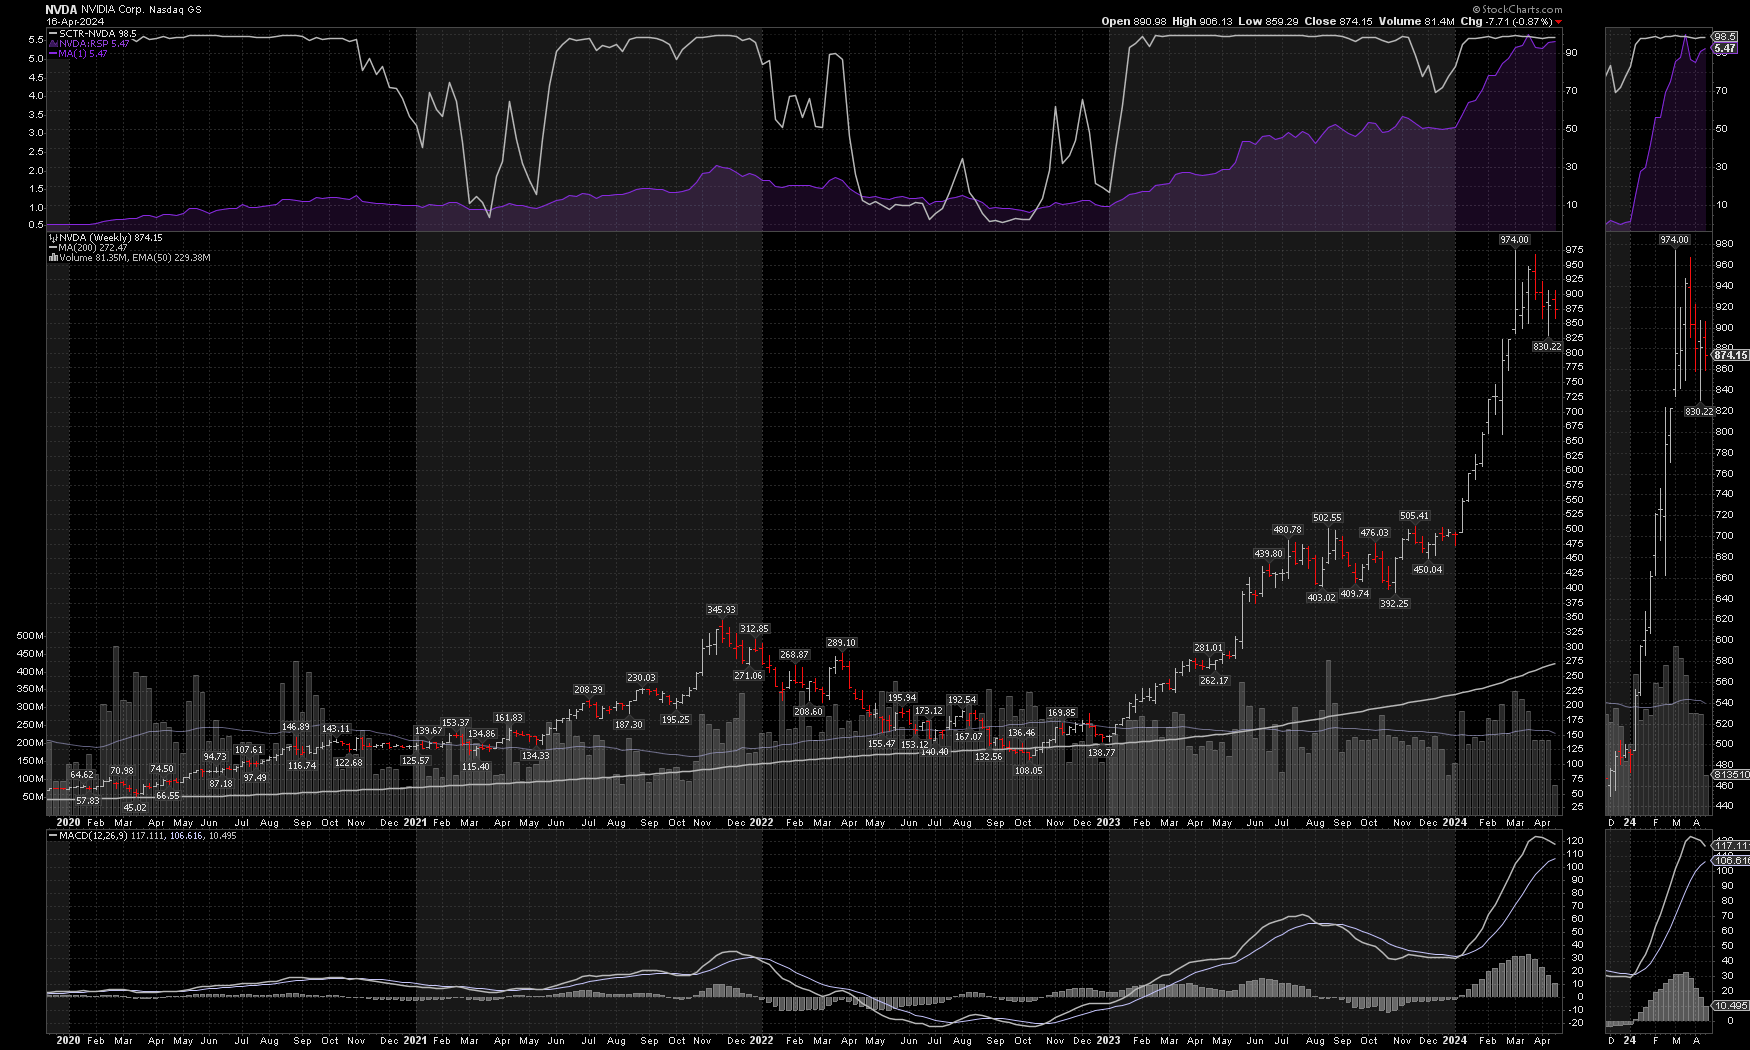
Everything turned in NVDA's favor earlier in 2023 and it never looked back. We had a good consolidation period in the $400-$500 range last summer before it took off to the $800s in early 2024. These consolidation periods look eerily similar. A smart trader told me: "the market doesn't repeat itself, but it often rhymes." This may be one of those situations.
The weekly MACD still looks quite strong and is setting up for a similar pattern as the summer of 2023 where the fast line crossed the slow one and then rocketed upwards once more.
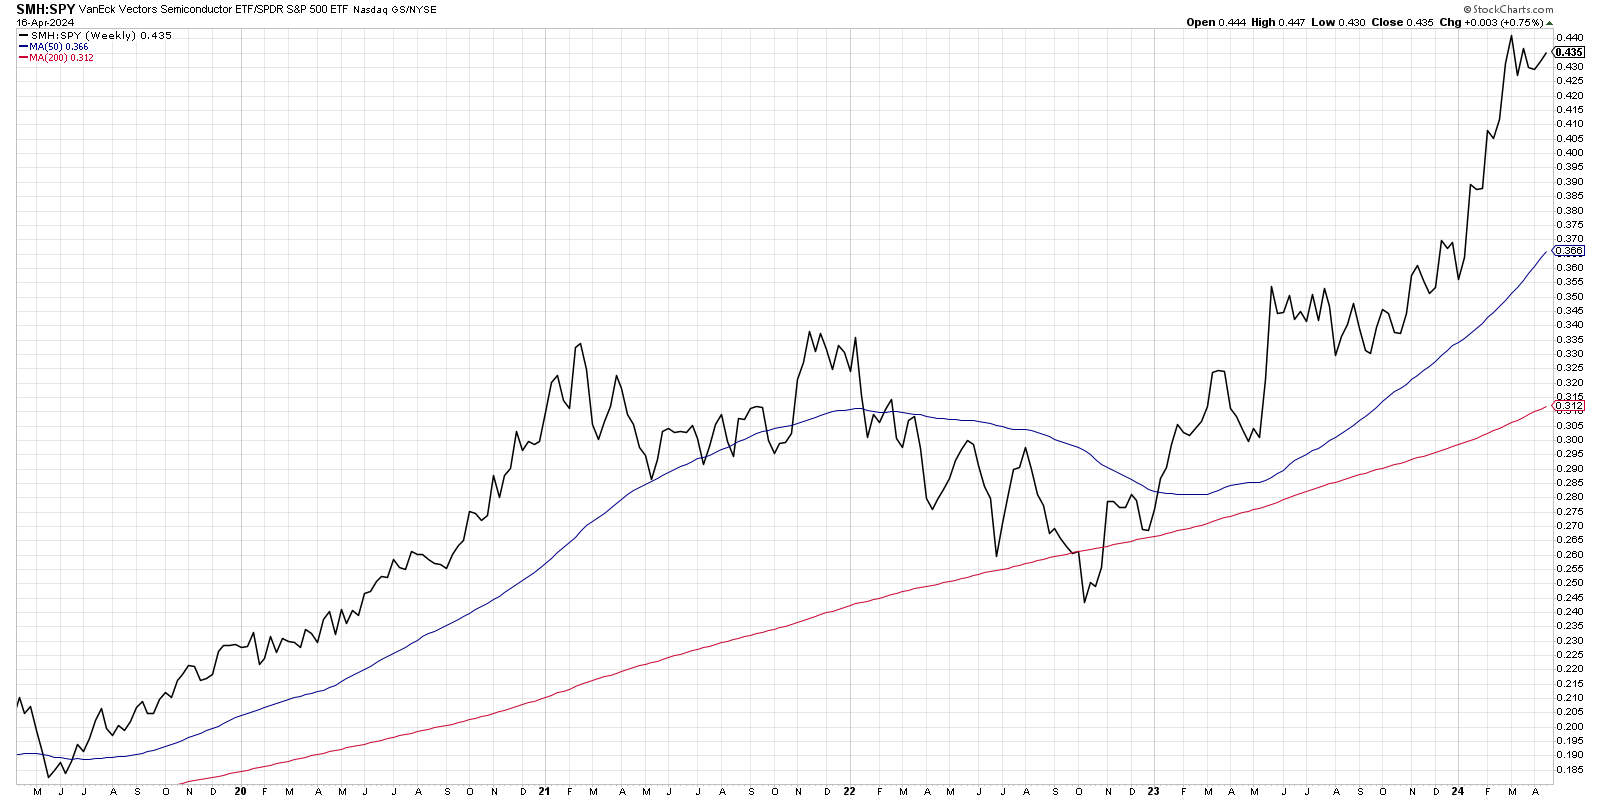
A quick look at semiconductor strength versus the overall S&P 500 shows that semiconductors have plenty of strength for now:
Institutions
One of my favorite patterns is when institutions trade lots of shares in a consolidation zone and this is showing up in NVDA lately:
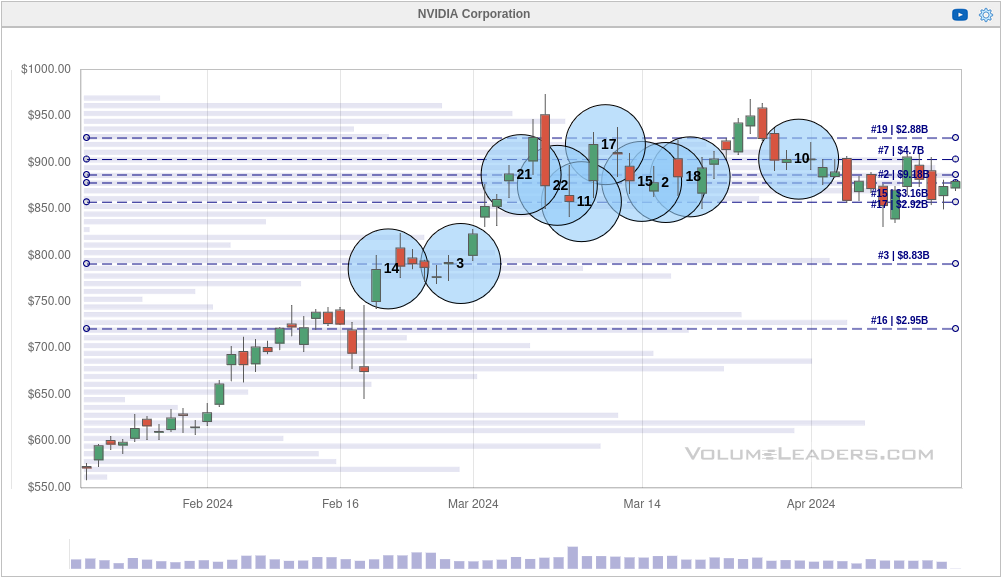
There's an incredible amount of trading happening between $850 and $925 in this chart. With that said, we don't know if these are new buys, new sales, new shorts, or shares going back and forth. However, it does show that institutional investors are very interested in this range for some reason.
There's a secondary level just below $800 that saw the #3 biggest trade ever made on NVDA. That could be a level of support if NVDA dips out of the consolidation zone soon.
Institutions have taken a break lately, though. This could be related to some of the market choppiness we've seen or they have their positions in place already. We may just we waiting on a catalyst to send NVDA in one direction or the other.
If we know what our current consolidation looks like, let's compare it to the similar time period in the summer of 2023:
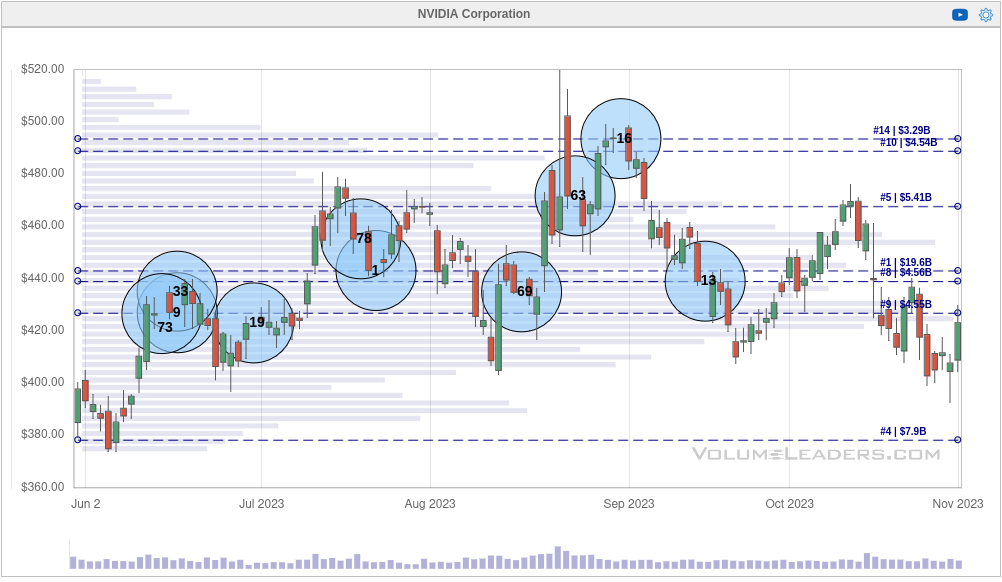
A similar pattern! There was plenty of interest from about $420 to $500 before NVDA blasted off in the fall. It would certainly be interesting to see where NVDA goes this time around.
Thesis
At first glance, NVDA's chart suggests that price is sitting in an air pocket and could fall off at any time. NVDA has overcome these situations multiple times before. My main takeaways are these:
- The odds are good that we're consolidating now for a move in one direction or the other, much like the pattern from the summer of 2023.
- Institutions are extremely interested in price action around $850-$925. It's difficult to tell what bets they're making, but it seems very similar to the moves in the summer of 2023.
- Semiconductors in general are still very strong.
- NVDA is very strong relative to the semiconductor index and the S&P 500.
I did have a short strangle on for NVDA recently, but I pulled it off with a small profit because it ended up using a little bit more buying power in my account than I was comfortable with at the time.
After looking at the chart today and digging up the institutional data, I'm feeling a bit more confident about putting on a short volatility trade of some sort on NVDA. It might be a short strangle or a short put – I haven't decided yet. However, selling calls on NVDA seems like a dangerous proposition if you examine the historical charts. 👀
Good luck to everyone today! 🍀
Discussion