April 25th Chart-O-Rama 🎉

Let's dig into some of the strongest tech names in the market with a quick look at several charts. You might find some new trade ideas! 📈

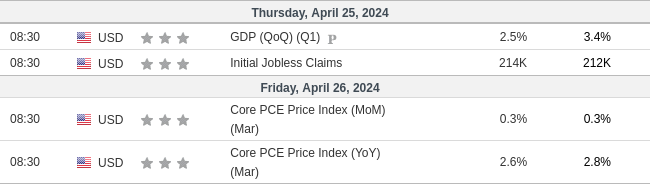
Happy Wednesday! We have some important GDP and employment numbers on deck today with Core PCE data tomorrow:
But today, we're going to do something different. I'm going to roll through a list of charts to pick out some that might get a trade from me today. I call this a chart-o-rama and it should be pretty fun.
All investments come with significant risks, including the loss of all capital. Please do your own research before investing, and never risk more than you are willing to lose. I hold no certifications or registrations with any financial entity.
Let's get to the charts!
Overall market
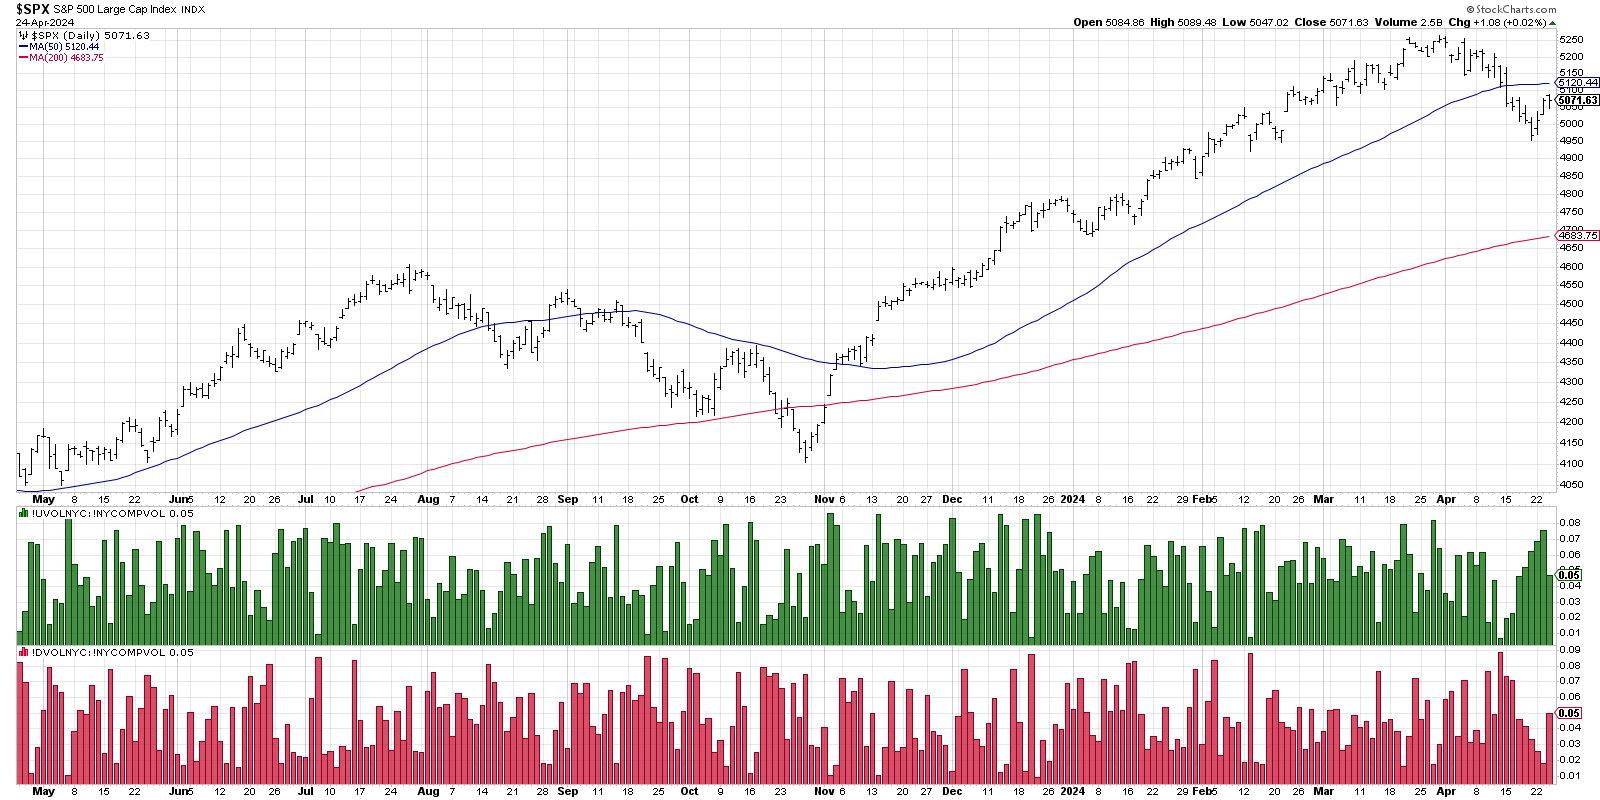
After five days of sinking bearish volume and increasing bullish volume, everything evened out yesterday on the NYSE:
The other thing I noticed is that the McClellan Oscillator has been making lower highs and lower lows since we got the first push in last November's rally:
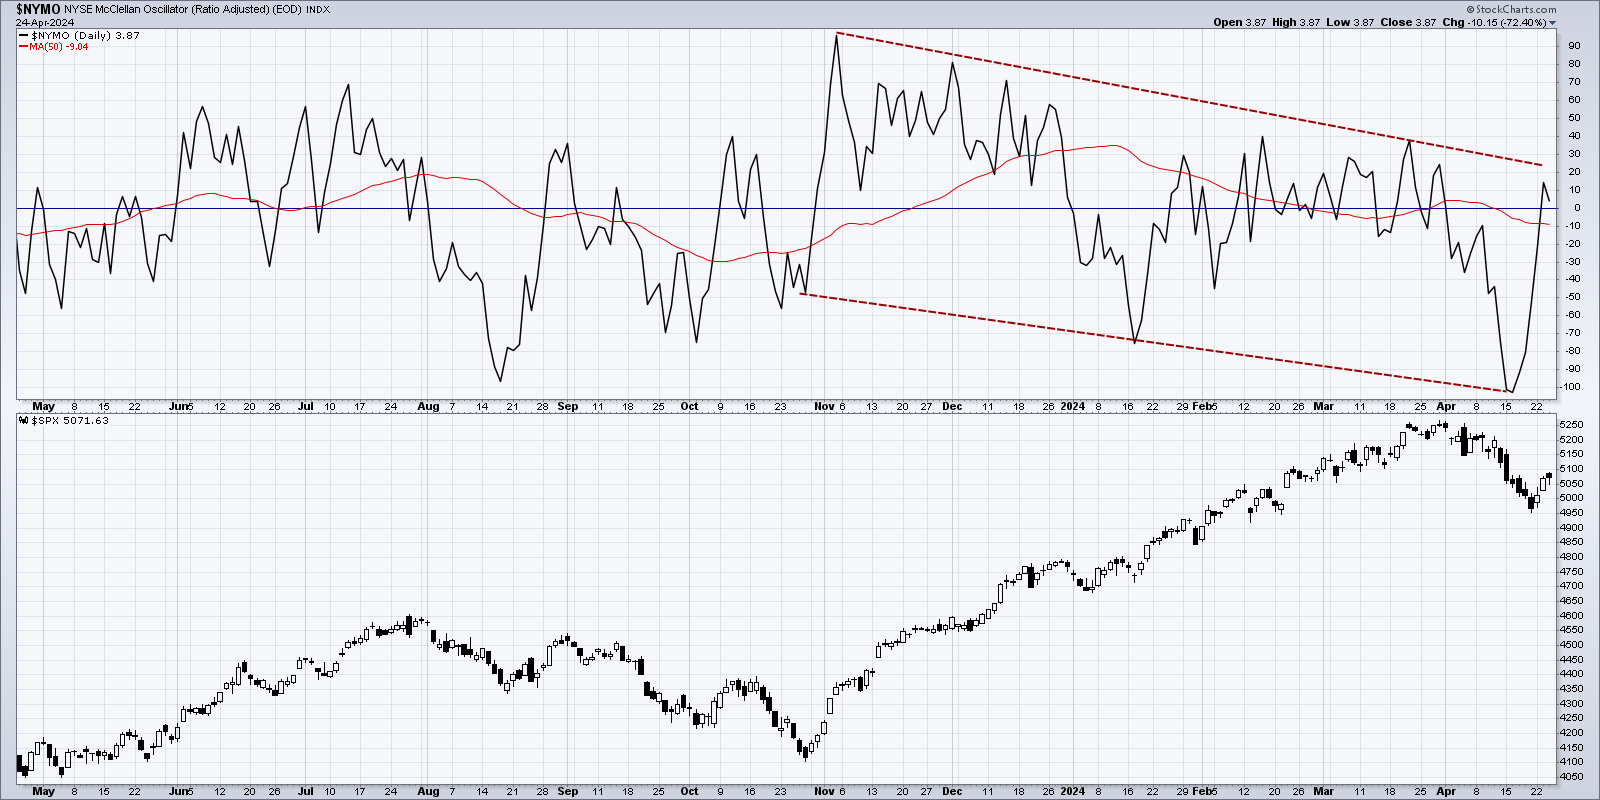
This implies that the general trend is more bearish volume taking over since the late February to early March time frame, but we will have to see how that plays out.
Scanning for charts
I've been trying out StockCharts as a way to reduce the amount of data I'm processing per day (TradingView overloads my brain) and they have an indicator called StockCharts Technical Rank, or SCTR. It's a ranking system based on multiple indicators on multiple time frames.
They offer some predefined scans to get you started and there's one from David Keller that examines tech stocks with a high SCTR rating. Here's today's list ordered alphabetically:
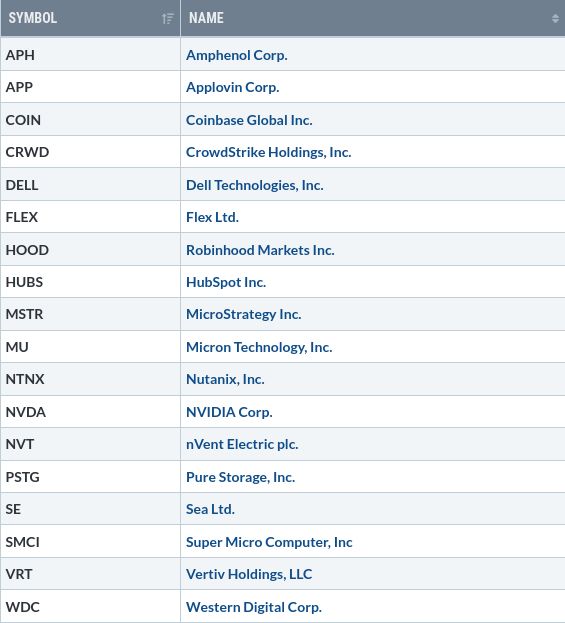
You'll recognize several names here but some might be new to you. Let's roll through several of these to pick out some patterns.
COIN
Coinbase has plenty of items on the chart that tick bullish boxes, including bouncing out of the 20 day price channel, a middling RSI that recently calmed from a strong rally, and good strength against the market as a whole. COIN often moves in tandem with cryptocurrency prices, so that's something to consider if you trade this one.
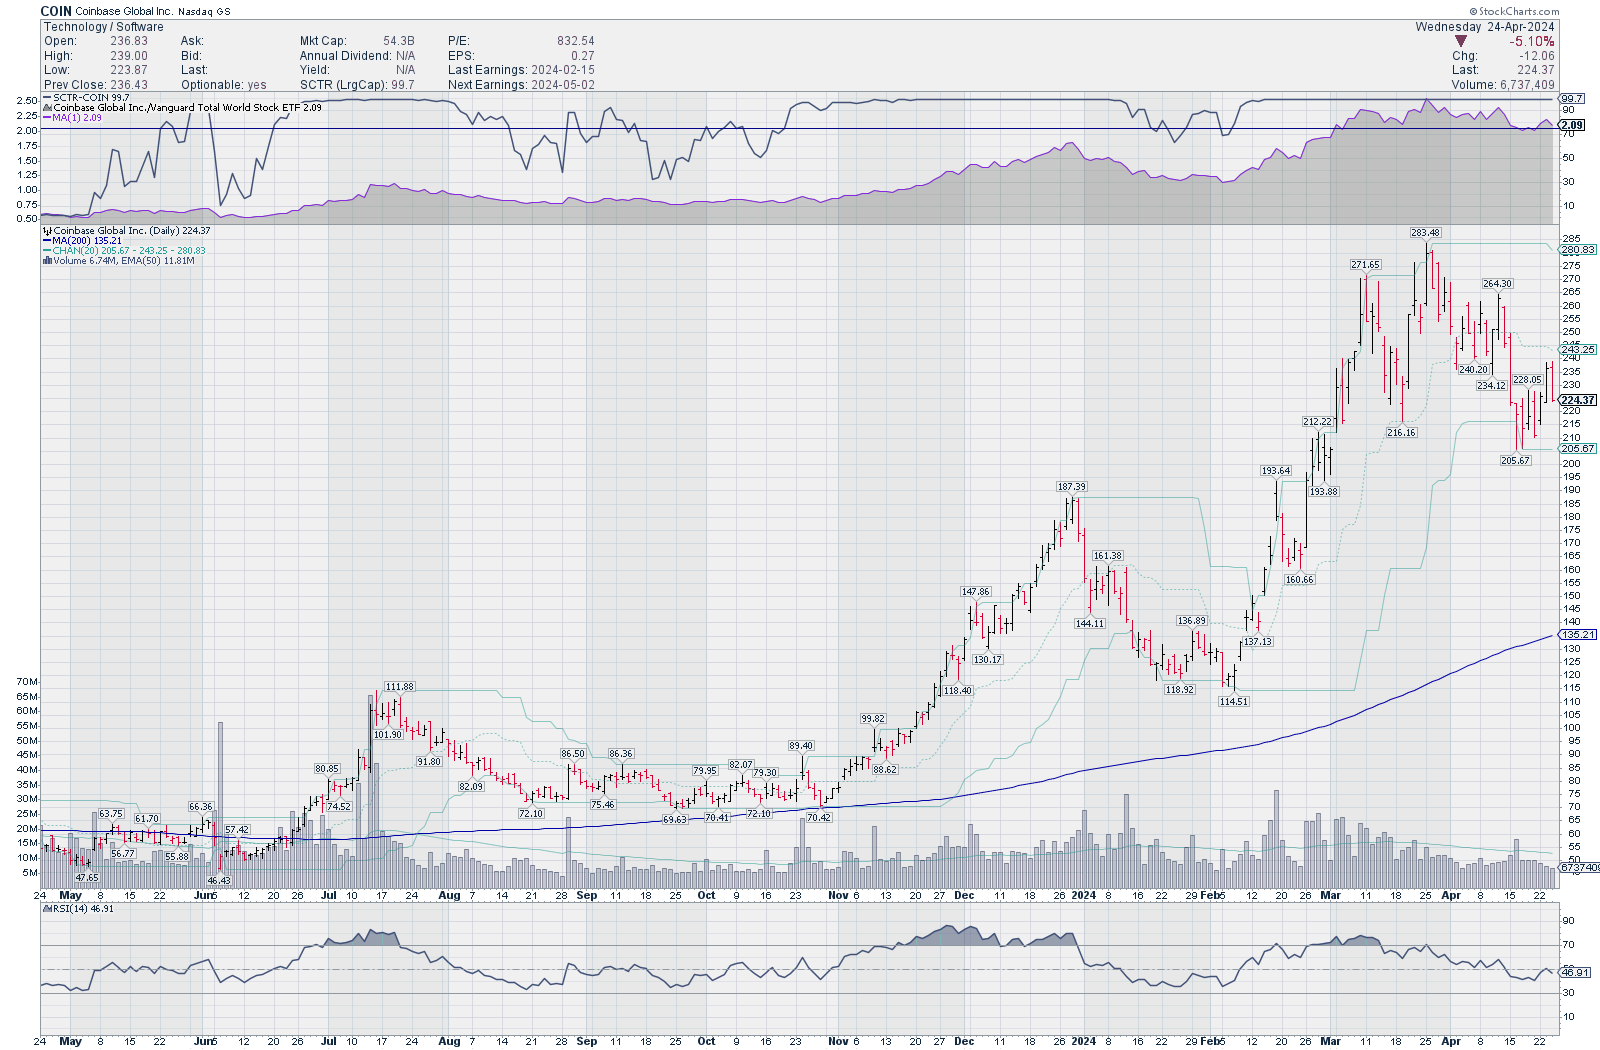
The IV rank for COIN is relatively high (58.3% this morning) and I'd be looking to short puts around $190-$195 since there's a support/resistance level in that area recently. You could go more aggressive and sell puts at $205, the bottom of the price channel, but I'd like to see COIN get over the middle of the price channel at $243 before I'd consider going that bullish.
DELL
I'll admit that I've been watching this chart for a while waiting on a good opportunity to get in. While I've been watching it, it ran from $71 up to $135. Perhaps I should have put on a trade? 🤦♂️
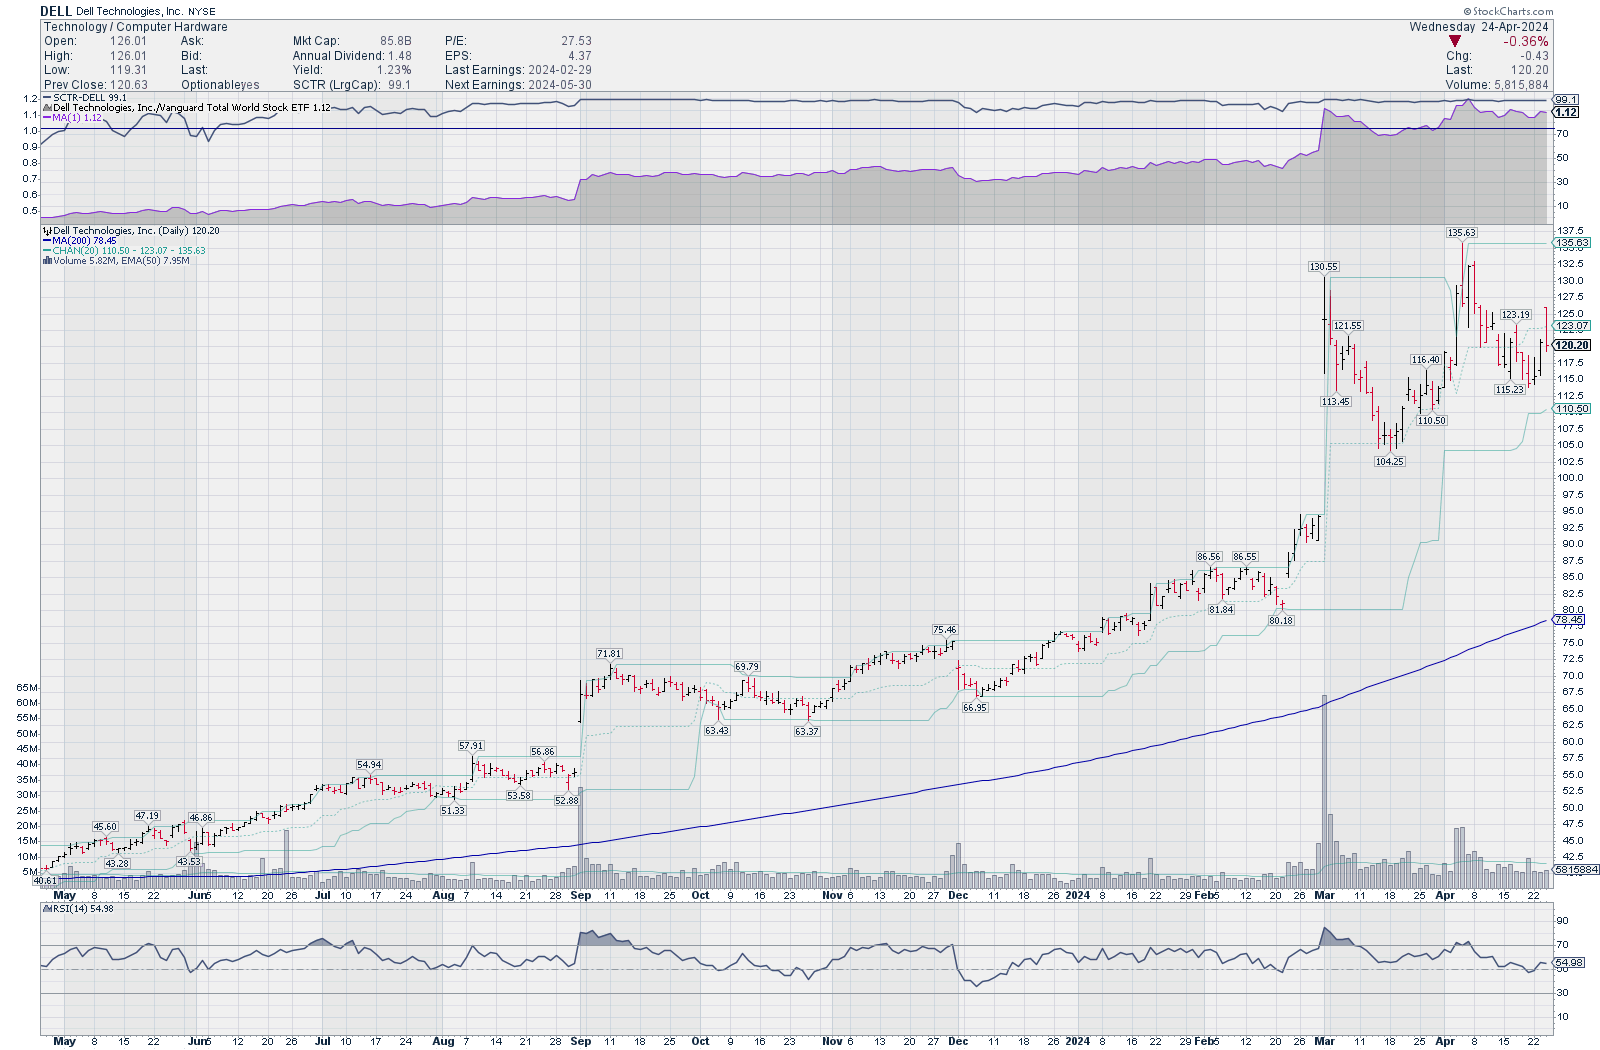
Islands make me a bit nervous (gap ups where a stock holds in that area), but I sold a June $105 put yesterday to get in on DELL. It came down to test that level after the gap up and then made a new high around $115.
DELL is showing excellent strength against the market as a whole and the RSI had time to cool off after the big gap up and subsequent rally to $135. It broke below the middle of the price channel yesterday even though it started the day above that line.
HOOD
Robinhood has made some big waves lately with massive platform changes and an upcoming credit card with some decent benefits. They also offering some of the best account transfer bonuses for IRAs (if you keep your account with them for years).
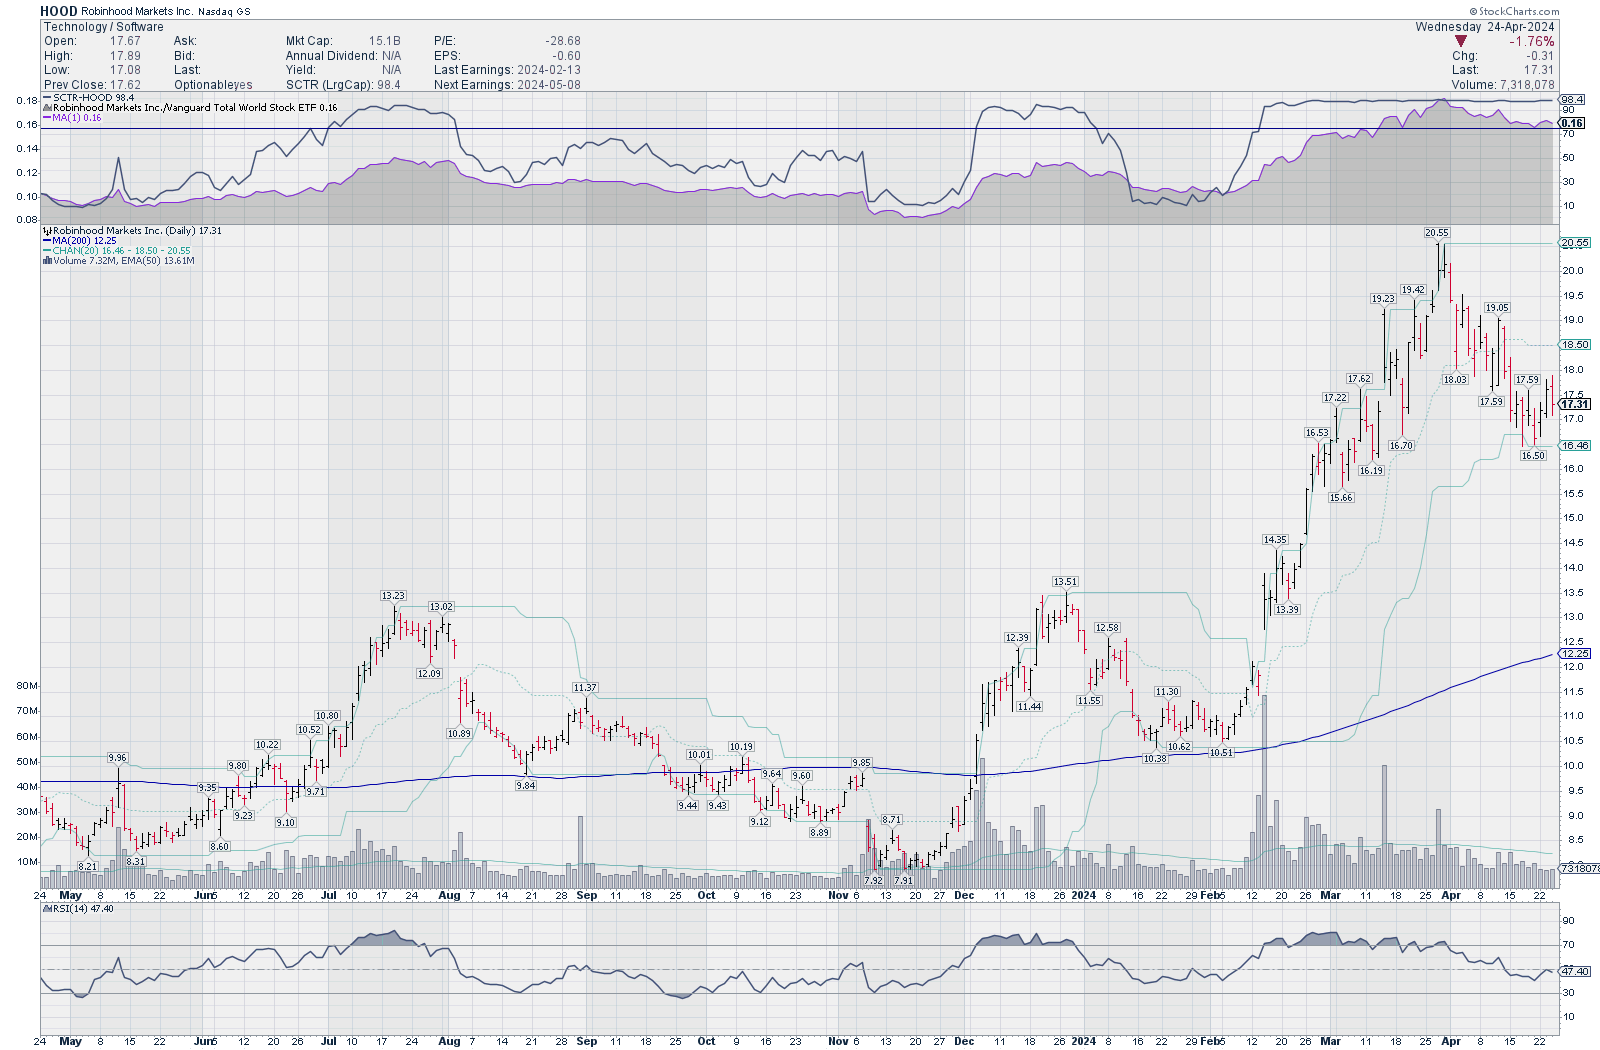
HOOD likes to plow into the top end of the RSI bands and hold there for extended periods. I like the last move down to retest the $15.50-$16.50 range as it allowed the RSI to cool off. Volume pulled back a bit and that suggests the market is digesting the last move and we might see some consolidation.
I don't have any trades here yet, but I'll be watching this one!
NTNX
Nutanix has an interesting product line-up that competes on some level with the public cloud vendors as well as VMware. With AVGO's recent changes to VMware's pricing and licensing, some customers may consider an offering from NTNX.
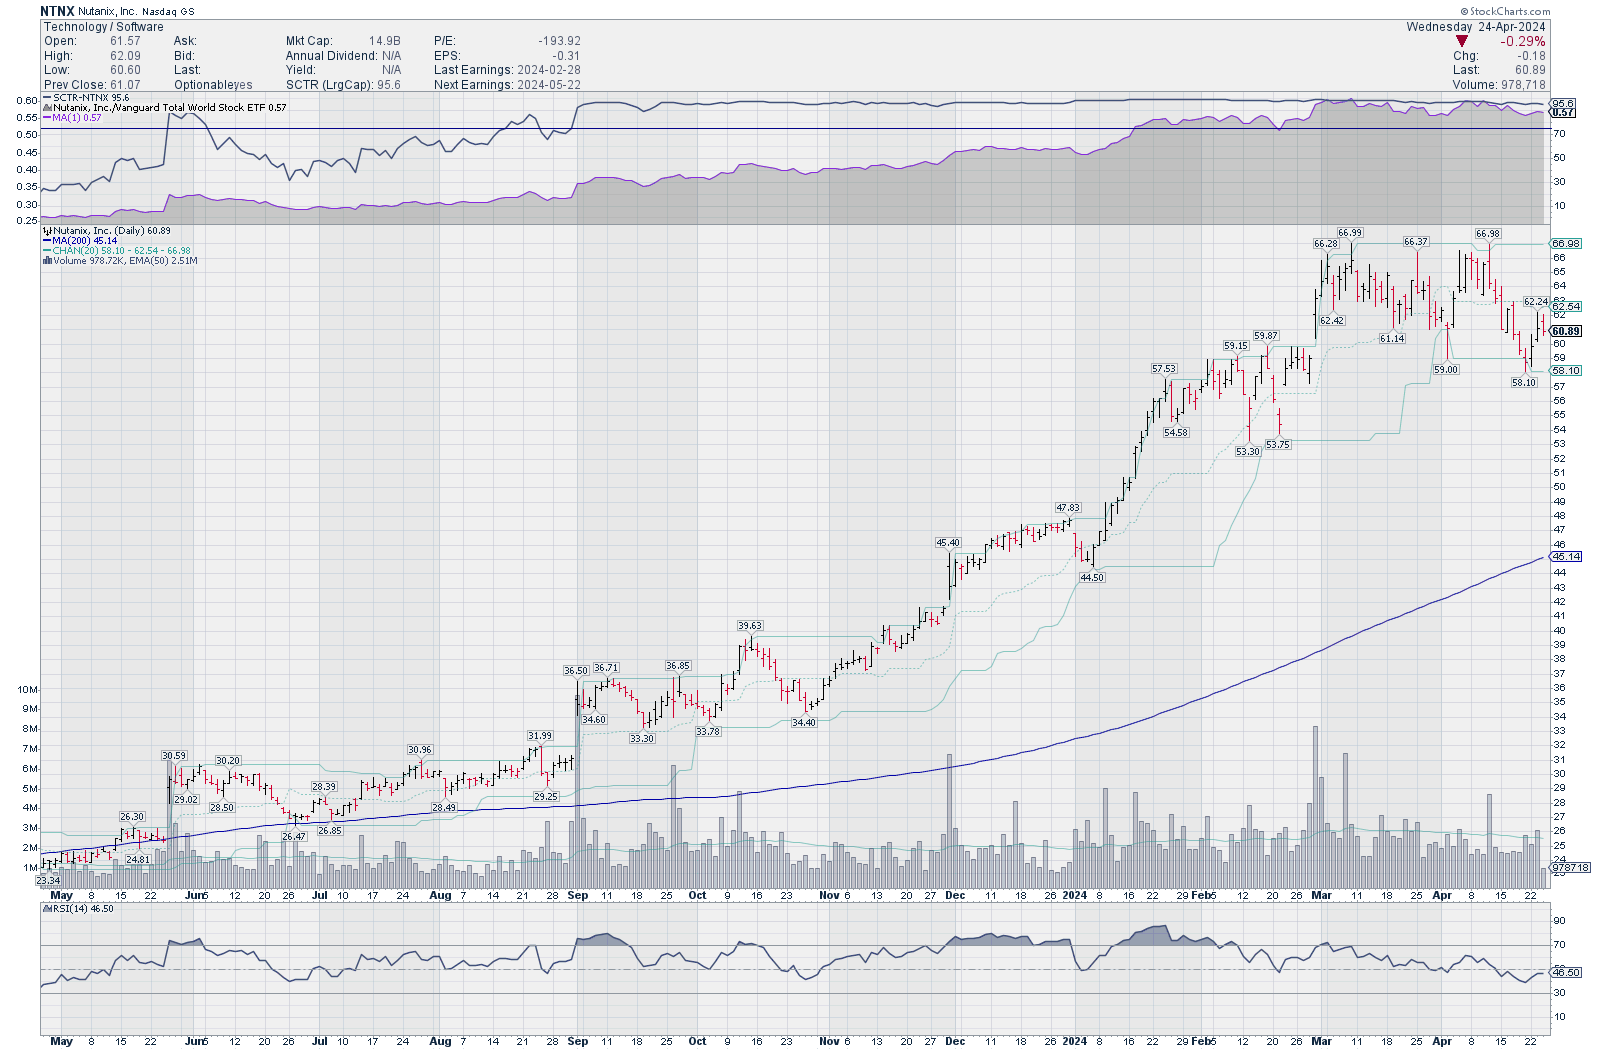
NTNX had one of those slow-and-steady runs starting last year that ran from the low $20s up to nearly $70. It's pulled into a consolidation phase now as the RSI cools and volume retreats. Earnings aren't until May 22.
I like the $50-$55 range for selling puts here since that level was retested aggressively back in February. The 200MA has an incredibly bullish slope and really made the turn last October.
PSTG
Pure Storage is one of those companies that is AI-adjacent. They offer several different storage technologies for various use cases. No matter your deployment footprint, they seem to offer a storage platform to go along with it.
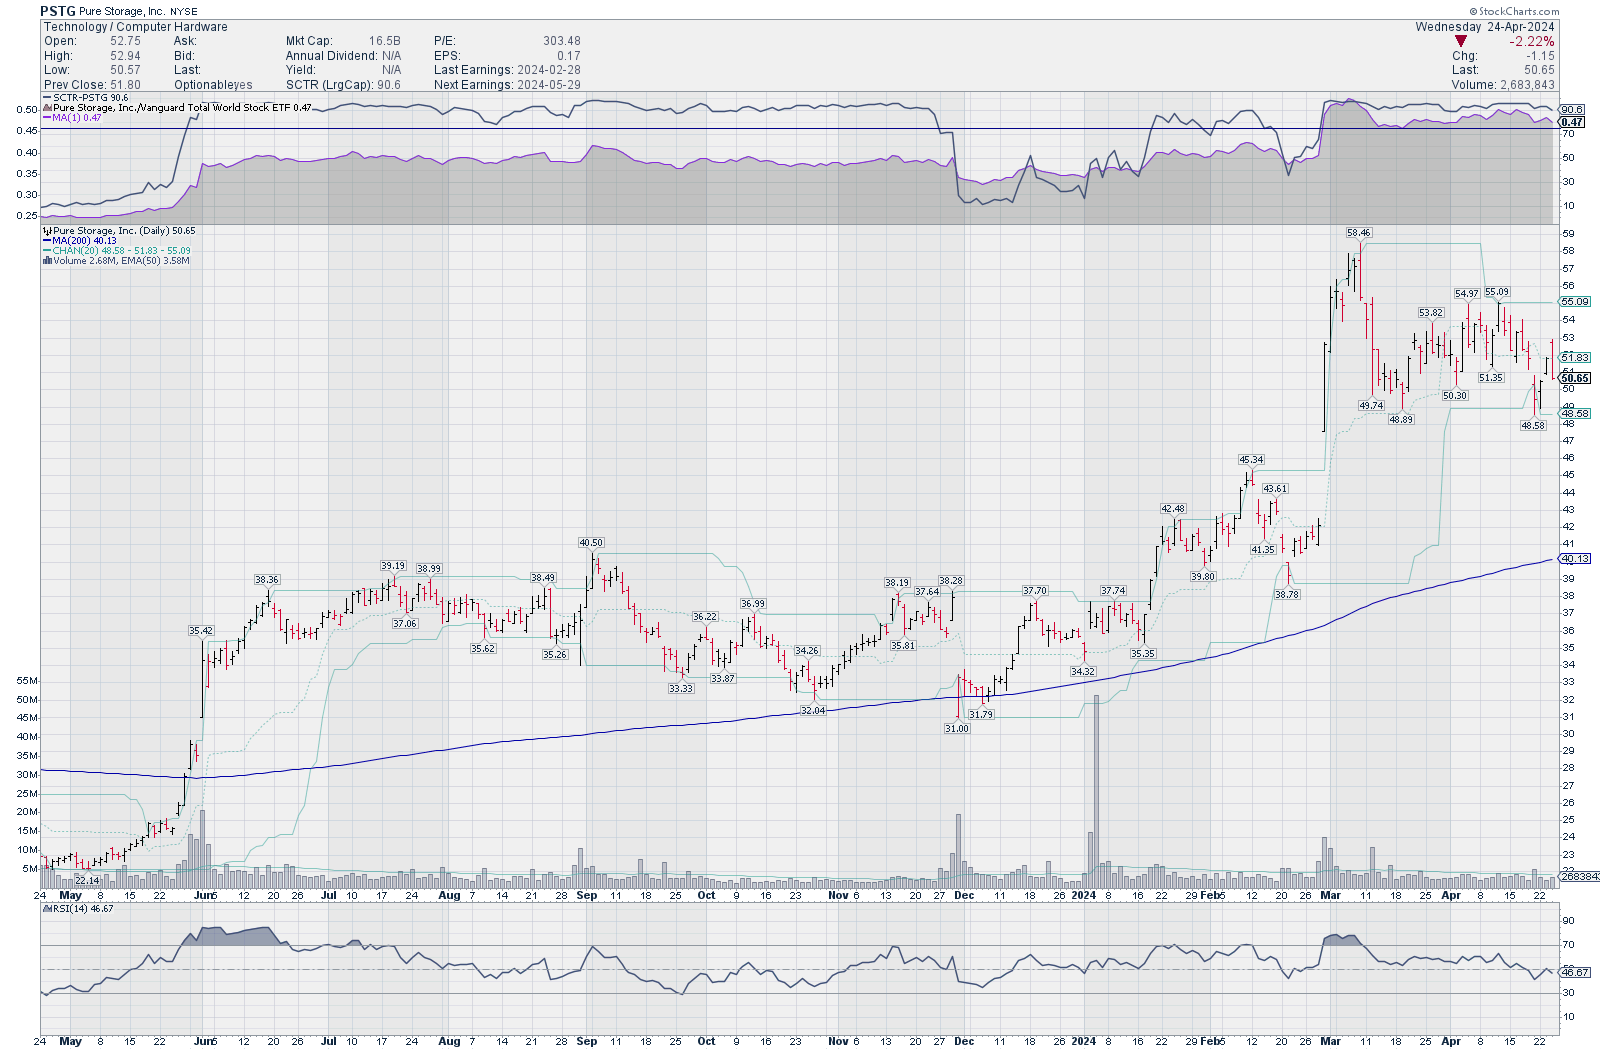
Many of the same patterns from the previous charts are here, too. We can see good strength against the market, a cooling RSI, and a retest of the $48 level. The one big difference is that the 200MA is a lot closer to the price than the other charts we've seen so far. PSTG only climbed over the 200MA in May 2023.
This could be a sign of an earlier stage rally here than some of the other stocks. I have no positions on right now, but I'd like to see how PSTG moves relative to the gap from $45-$48 that formed last February.
VRT
Vertiv is another AI-adjacent company that isn't well know. It's a holding company that picked up a few big brands over the year, including Liebert. If you've worked in industrial or datacenter environments before, you've seen Liebert equipment frequently. Somebody's gotta keep the GPUs cool that are doing the AI workloads! 🧊
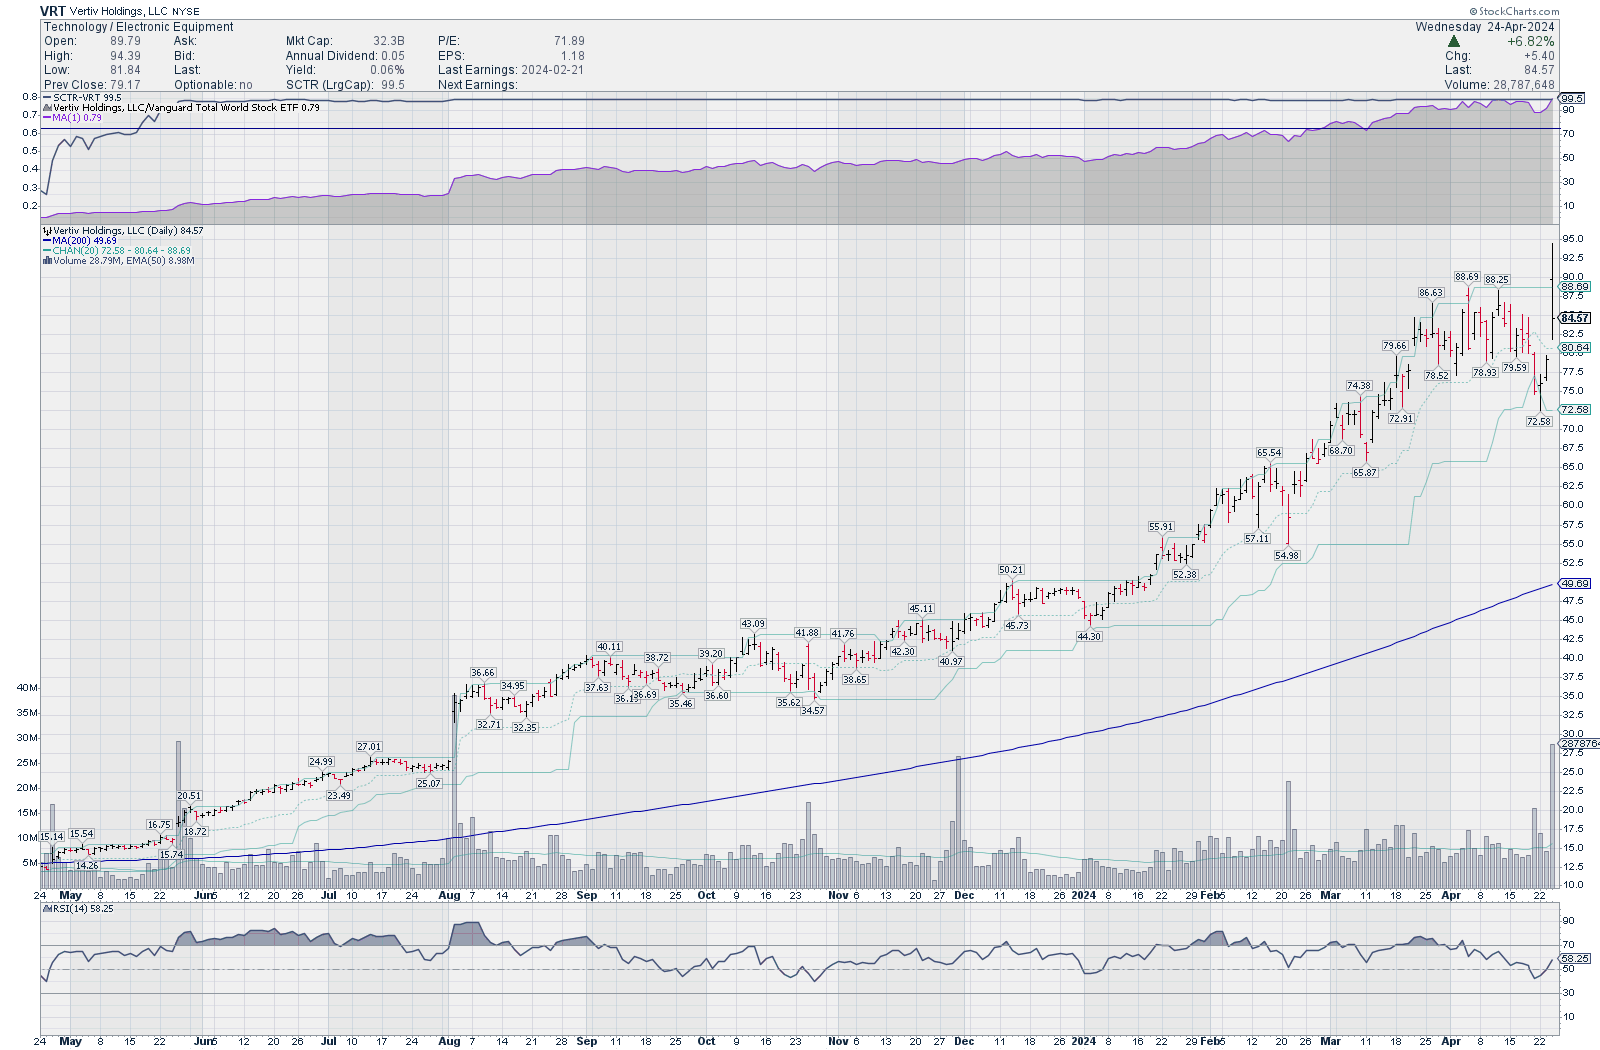
VRT reminds me of NTNX with the slow and steady climb that picked up speed in 2024. It ran from $15 last April to just under $100 this week. Their P/E ratio is very close to NVDA and SMCI, so there is a lot of betting on future earnings here.
RSI on VRT recently crossed the middle line after a good earnings call yesterday and the 200MA has an increasingly bullish slope. Strength against the overall market is pegged near the top. This one has had a great run, but there aren't any signs I can see that suggest we have a trend change underway.
I had two short puts on VRT yesterday that I bought back for 80% gains after the earnings call. I'm looking for the next trade to make today.
Thesis
While the big names like NVDA, META, and GOOG soak up most of the market attention lately, there are some technology names that are rising with great strength. Some of these could benefit from partnerships with massive names or they might be potential takeover targets if interest rates start coming down. Predicting the future makes me exhausted and I'm terrible at it, so I'll just trade the charts in front of me for now.
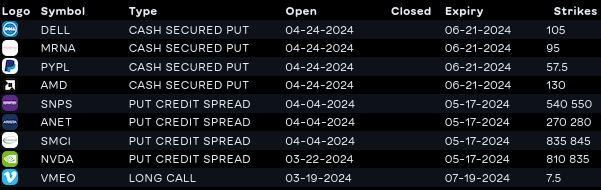
I've reduced my trades quite a bit this week as I found some flaws in my system of selling short strangles (more on that in a later post). This means a return to more short puts and running the wheel once more:
Good luck to everyone today! 🍀
Discussion