MSFT analysis for April 22

MSFT is huge and earnings are coming. What does the data tell us about the odds of a rally or correction? 🤔

Happy Monday! The market took us on a ride down last week to some heavily oversold levels. How is MSFT doing among all of these changes? Let's take another look!
All investments come with significant risks, including the loss of all capital. Please do your own research before investing, and never risk more than you are willing to lose. I hold no certifications or registrations with any financial entity.
Off to the data we go!
Broad market view
Chris Ciovacco's market video is required watching for me every week and it helps keep me grounded during the onslaught of bad data and hot takes. This past week's video was no exception:


We may be seeing a rotation from tech into other sectors as the technology sector has been on a great rally for months. Chris doesn't see much to hint at a new bear market, but we could be looking at a correction similar to the one in 2023.
MSFT at a high level
As a reminder, Microsoft is huge. For every $100 you put into SPY, about $7 is invested in MSFT. In the NASDAQ, it's almost $9 of every $100. That makes sense when you see that MSFT has a market cap just under $3T. 👀
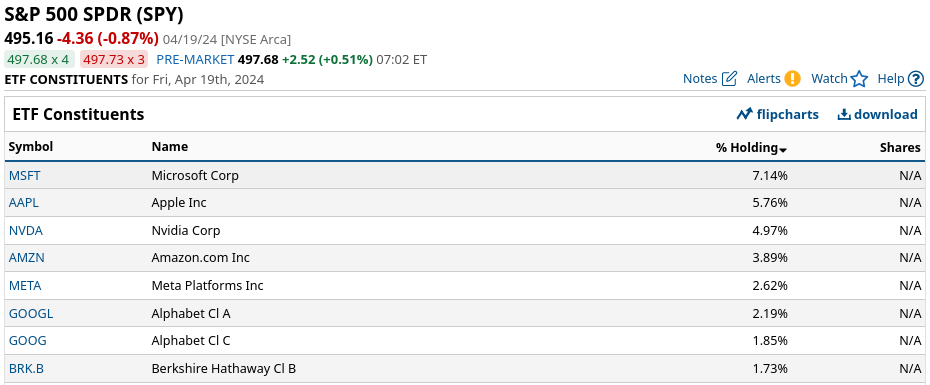
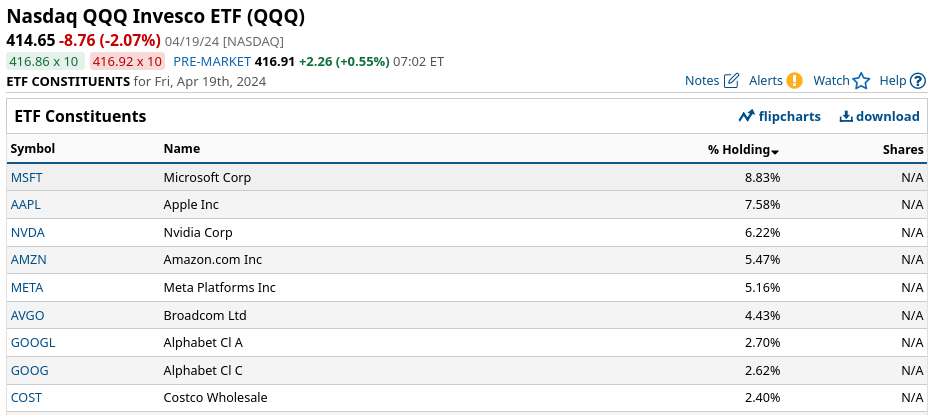
SPY/QQQ constituents from Barchart
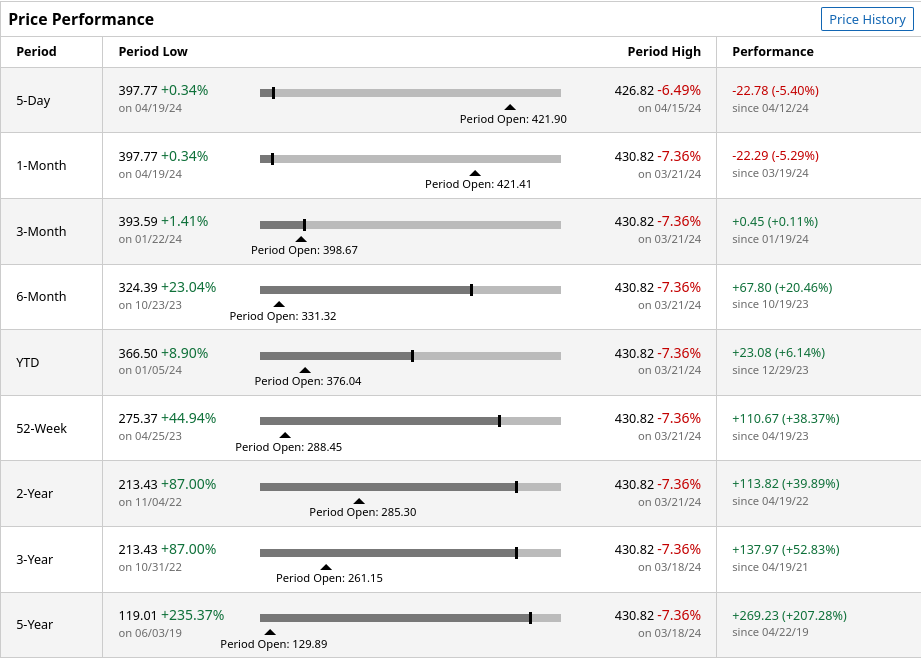
Earnings are coming up this week on April 25th after the market closes. Anyone holding Microsoft shares in the long term should be fairly happy with its performance, although it has slowed a bit in the last few months:
Charts
Let's start with a look at the daily MSFT chart. There's a 20 day price channel (Donchian channel) applied and it looks like the price is pushing the bottom side of that channel down fairly quickly. MSFT dipped under $400 on Friday but it's still hanging out well above the 200MA at $366.
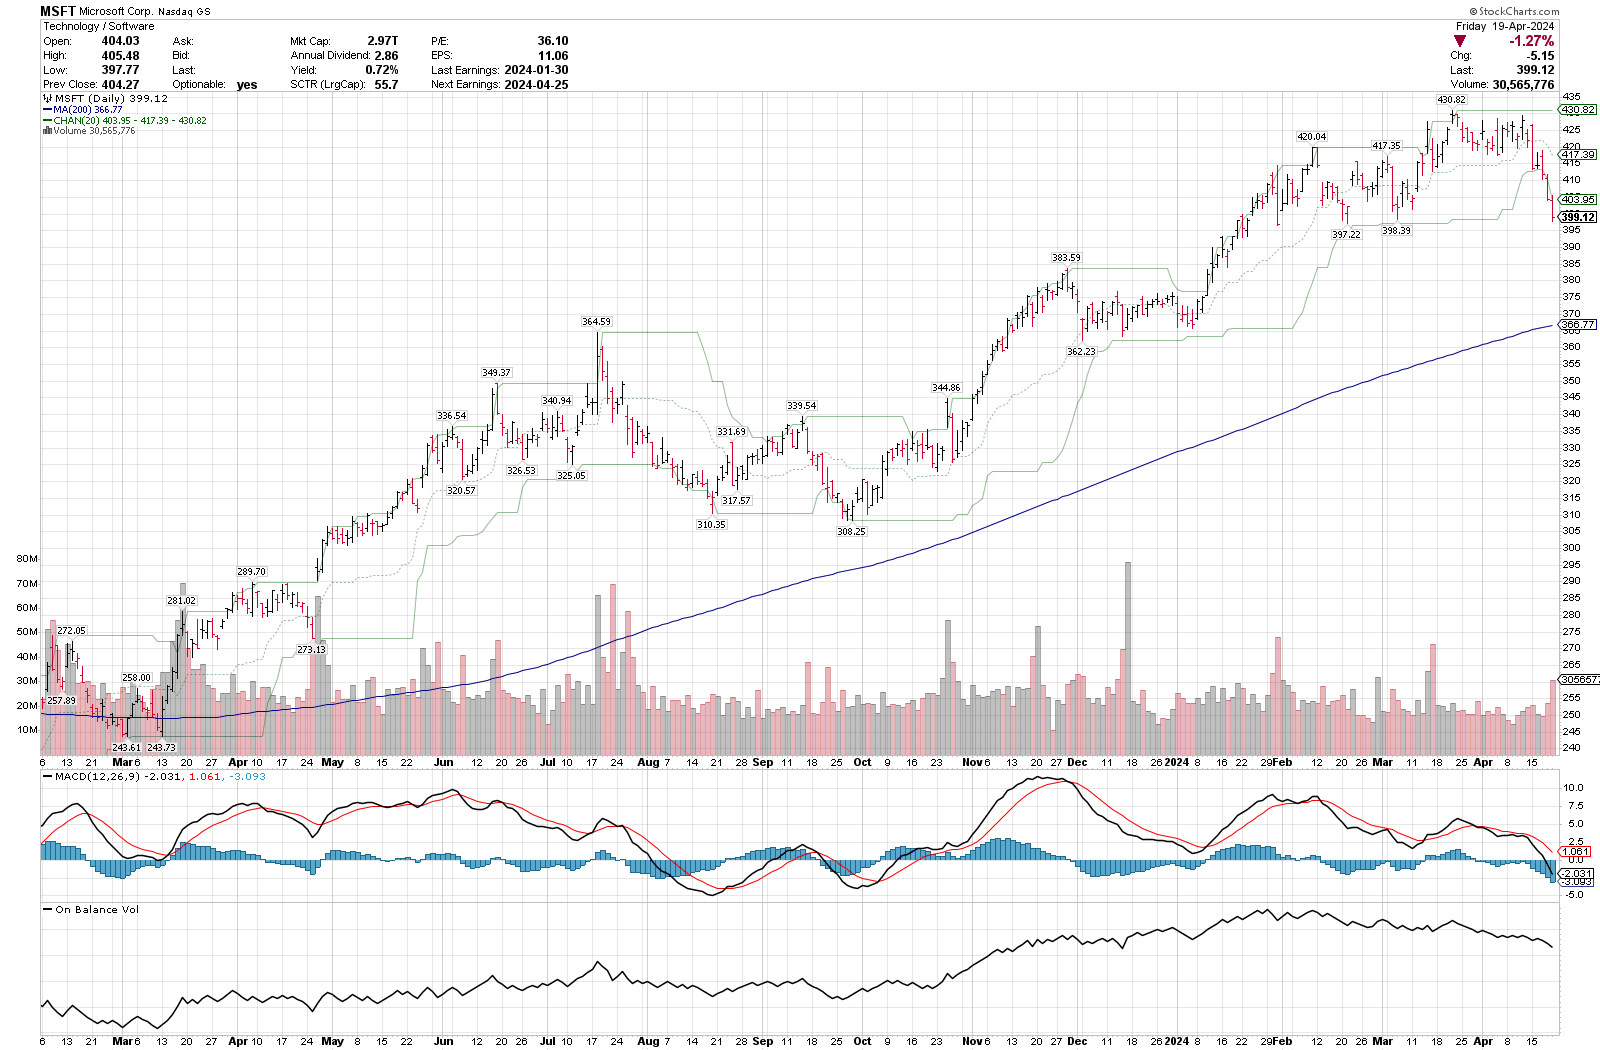
On the bottom half of the chart, we can see that the recent chart highs have not made new highs on the MACD. That gives me a hint that we're losing a bit of strength on the push upwards. In addition, the OBV peaked at the end of January as MSFT tried to make higher highs.
MSFT has made corrective moves like this several times in the past, especially in 2023. It's sitting about 7.5% down from the highs this morning.
What about MSFT's strength against SPY?
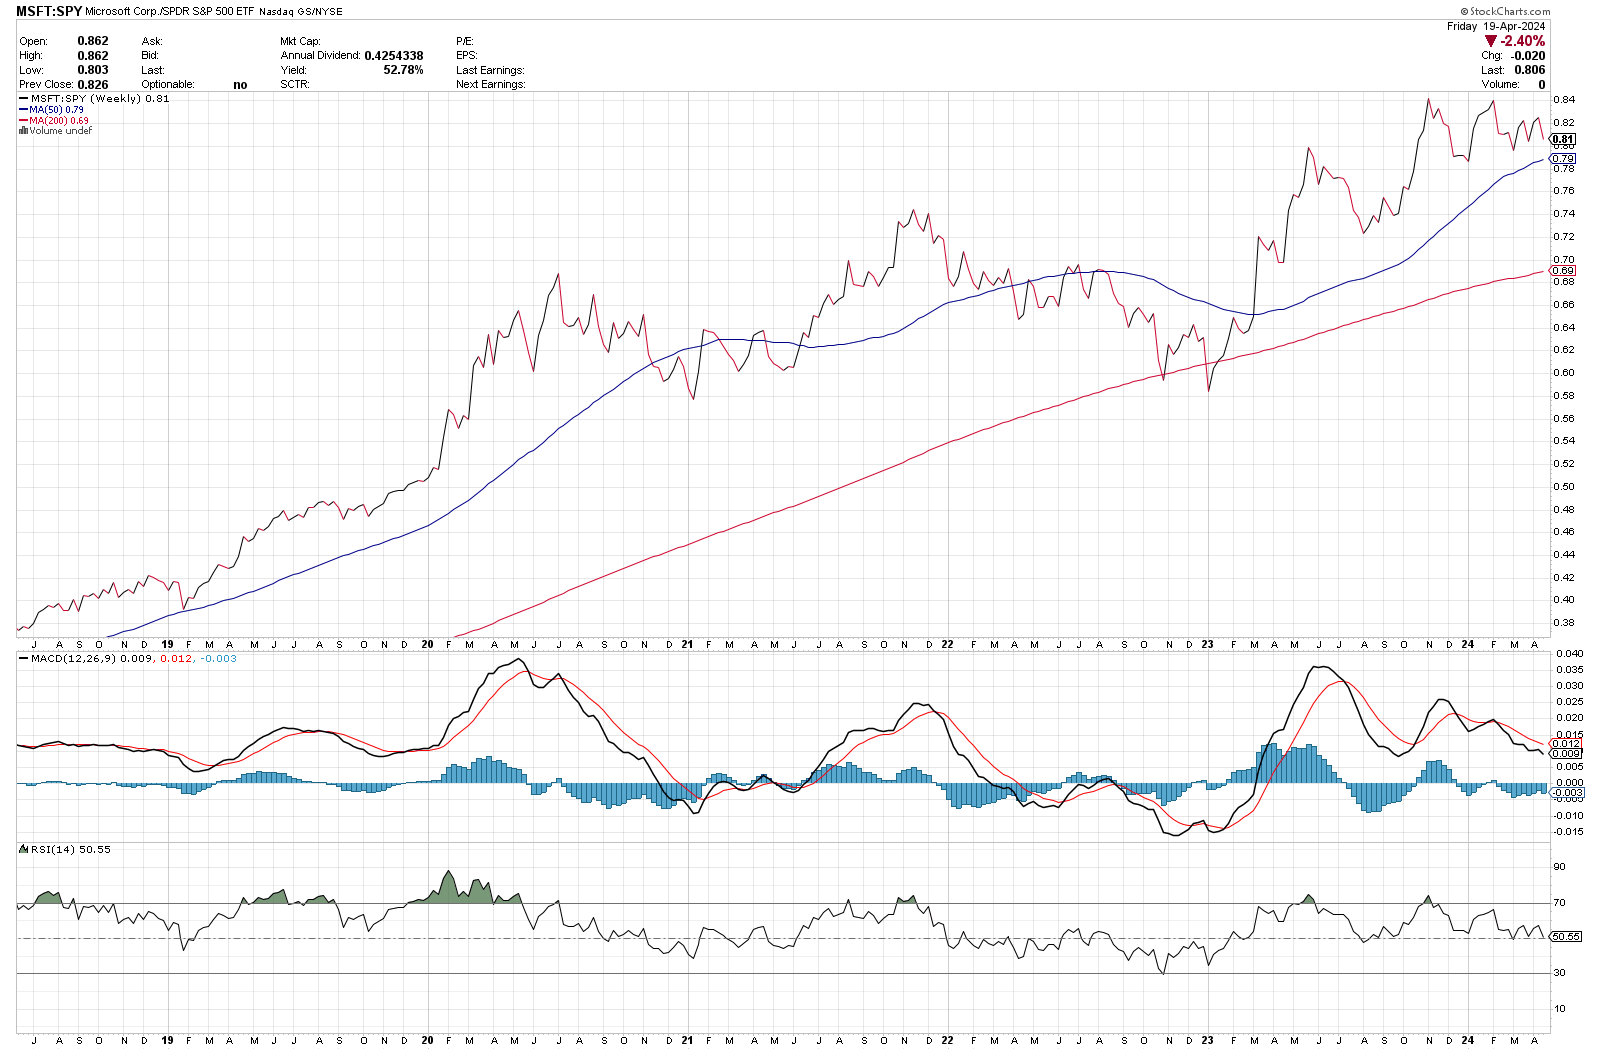
MSFT is still showing great relative strength against the SPY ETF and it remains above two upward sloping moving averages.
How about MSFT versus the technology sector in general?
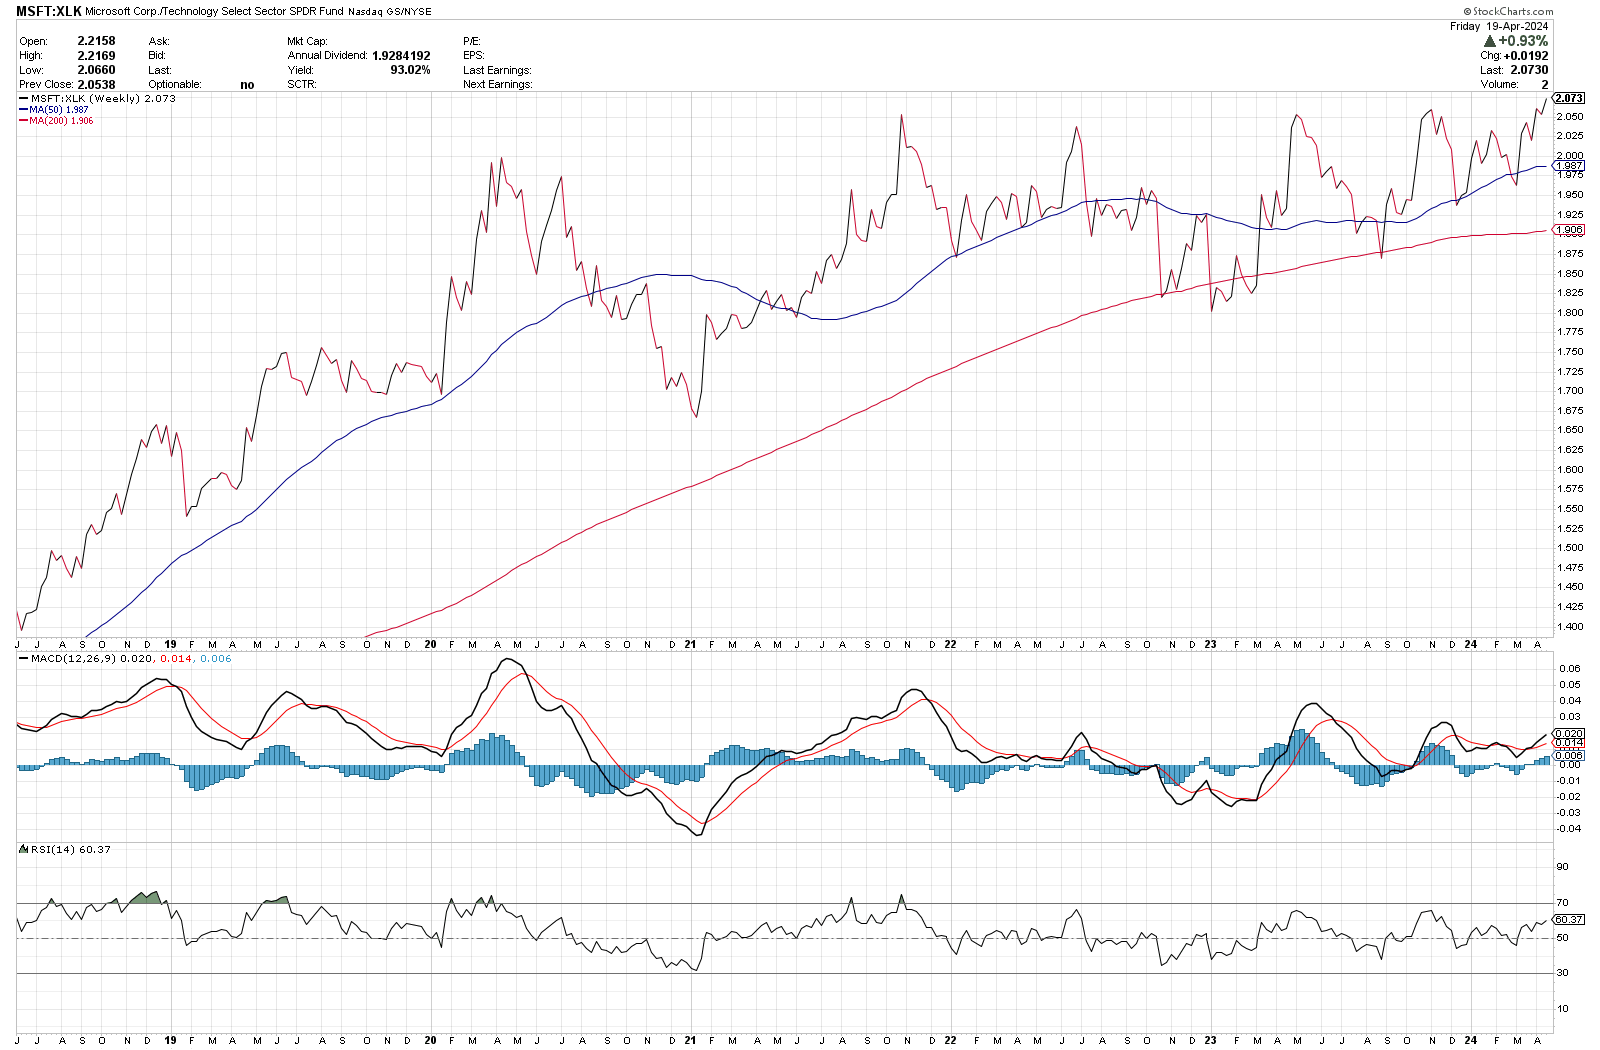
This is an interesting chart. As the relative price action becomes more compressed, it looks like MSFT actually broke out above a level that was tested several times since 2021 (about 2.05x). The MACD has not fallen below the zero line since mid-2023 on this chart either.
My takeaway: MSFT might be showing some weakness on its chart in isolation, but it looks like it's holding together well as the technology sector sags.
Institutions
Volume Leaders charts note the price, time, and size of trades made by investors with deep pockets. A 30 day chart including market-on-close trades shows lots of trading before the slide down and trading during the slide as well:
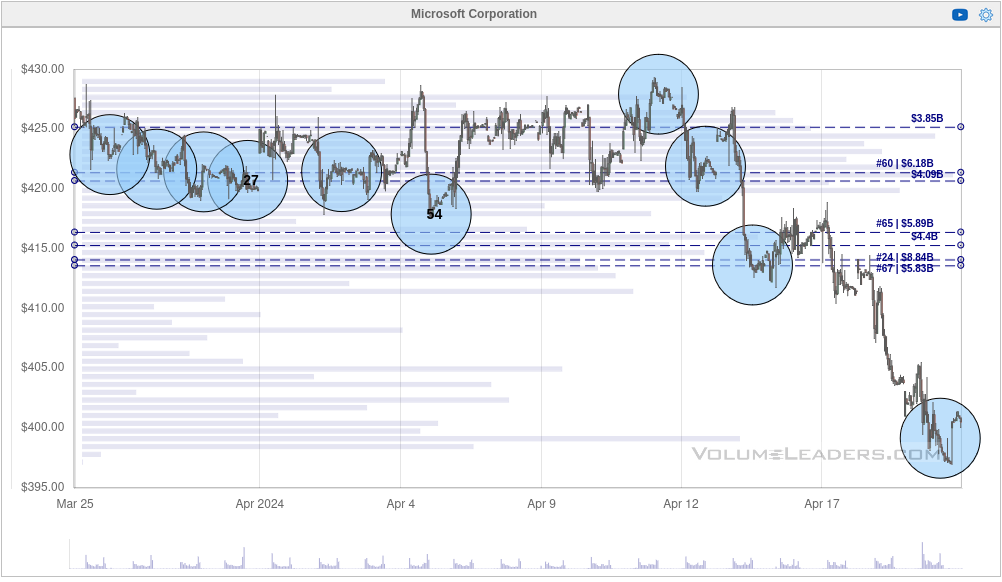
The little Friday bump upwards happened around the same time as 3.7M shares were traded near $399.12. Remember that this could be a buy, a sell, or a short. $400 is a big psychological level for bulls and bears. 🤔
What happens if we take out the closing trades?
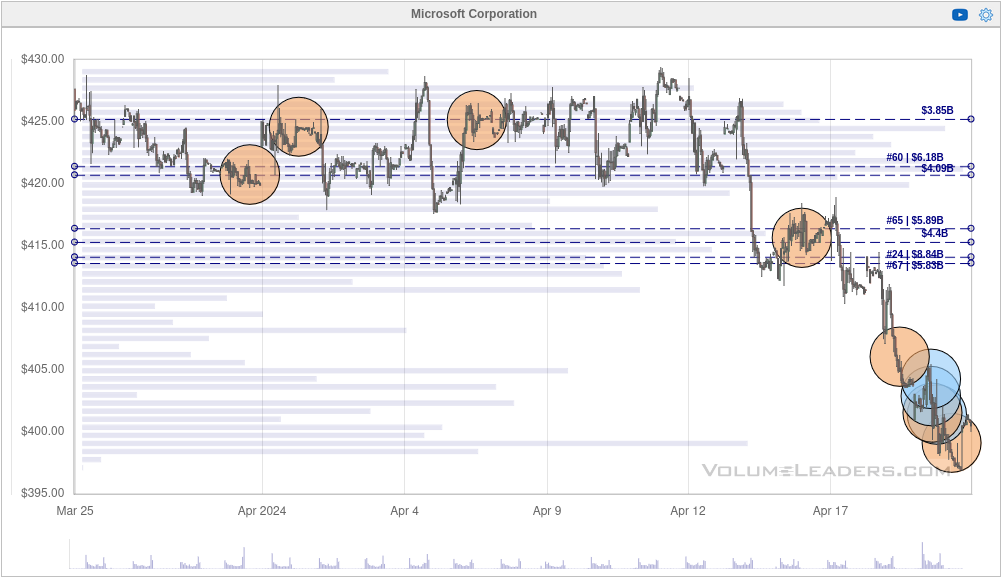
Wow. Orange circles are dark pool trades and blue ones are regular trades made on the open exchanges. Look at the series of trades made as MSFT lost the $405 support level! There are multiple millions of shares traded there. Many of them are in even numbers of shares as well, and that seems to be tied more to buying than selling in my previous experience.
That's not a guarantee that we're seeing buying here. What we can say definitively is that institutions became very interested in MSFT as it passed through that $405 level.
Thesis
Earnings are always surprising and so is the market's reaction to them. These are dangerous binary events for traders because nobody knows what's in the earnings report and we have no idea what all the other traders are thinking once they see the numbers.
In isolation, Microsoft looks to be losing a little strength at the highs. When compared to the remainder of the market and the technology sector, MSFT looks well positioned. The loss of the $405 support level got my attention immediately. A strong earnings report could get MSFT back to new highs or we might revisit levels from $350-$400.
I've had a difficult time picking a direction for MSFT lately, so I've decided to go short volatility and do a short strangle on MSFT:
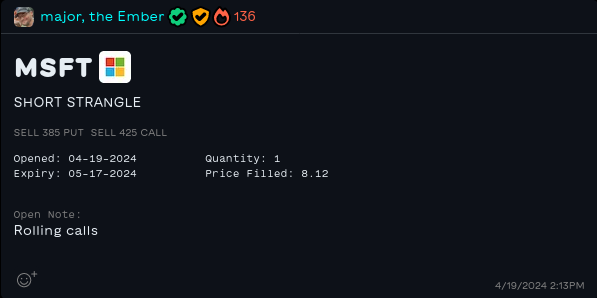
As a reminder, this trade is most profitable when MSFT stays between the two levels ($385 to $425 in my case) and volatility drops. We should get that volatility drop after earnings, but the price action could get interesting. My goal here is to get a 50% profit or manage the trade at 21 DTE. I'll roll calls and puts to remain close to delta neutral.
Good luck to everyone out there today! 🍀
Discussion