CAT Analysis for April 23

It's my first deep dive into CAT! There are some trends here that surprised me and the chart has subtle differences that are worth noticing. 🐱

Happy Tuesday morning! I'm taking my first look at Caterpillar Inc (CAT) today. I've been trading them off and on for a while but it's been a little while since I've taken a deep dive. 🐱
All investments come with significant risks, including the loss of all capital. Please do your own research before investing, and never risk more than you are willing to lose. I hold no certifications or registrations with any financial entity.
Let's get into the data.
At a high level
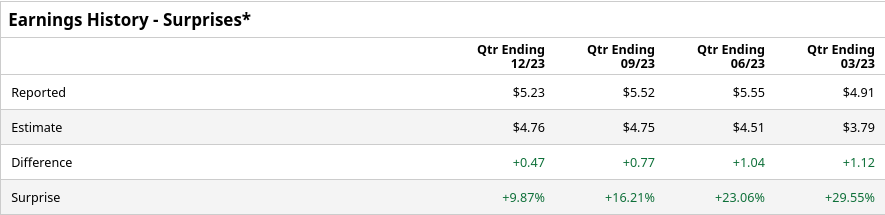
CAT has earnings coming on April 25th (this Thursday!) before the market opens. CAT has surprised on earnings to the upside lately, but the amounts of the surprises are shrinking:
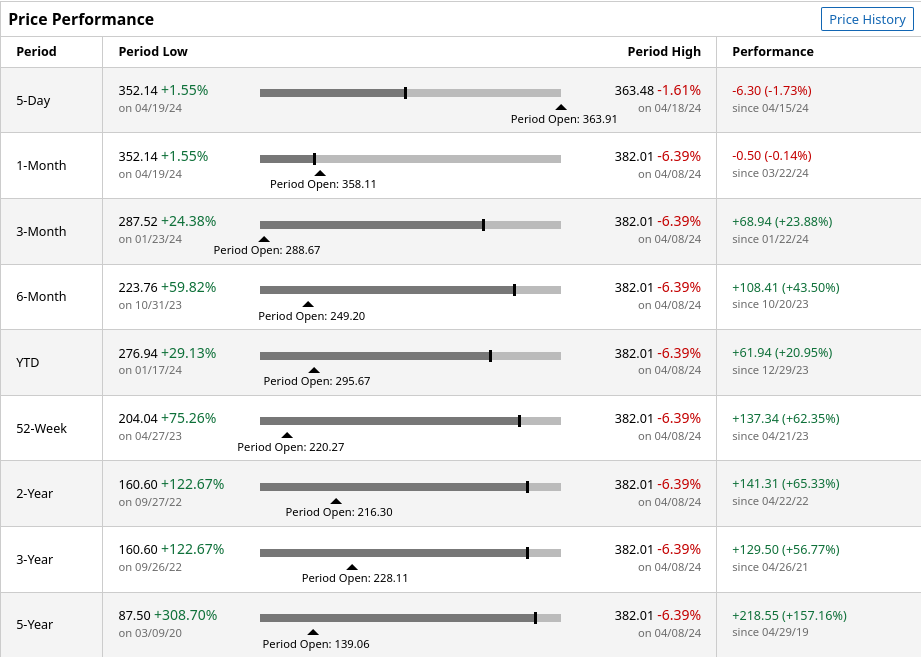
Investors in CAT over the past five years would be pretty happy with their returns even though the recent market slide ate into their profits slightly:
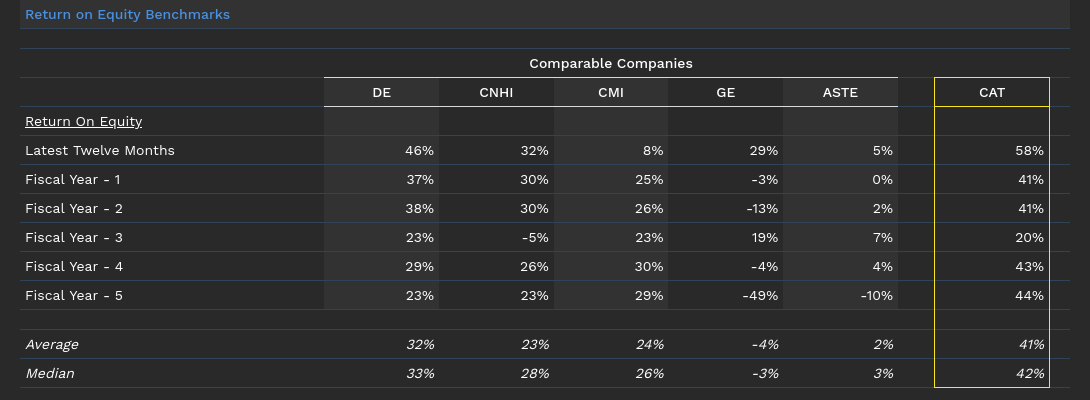
Finbox's return on equity tables show that CAT is doing really well against its peers:
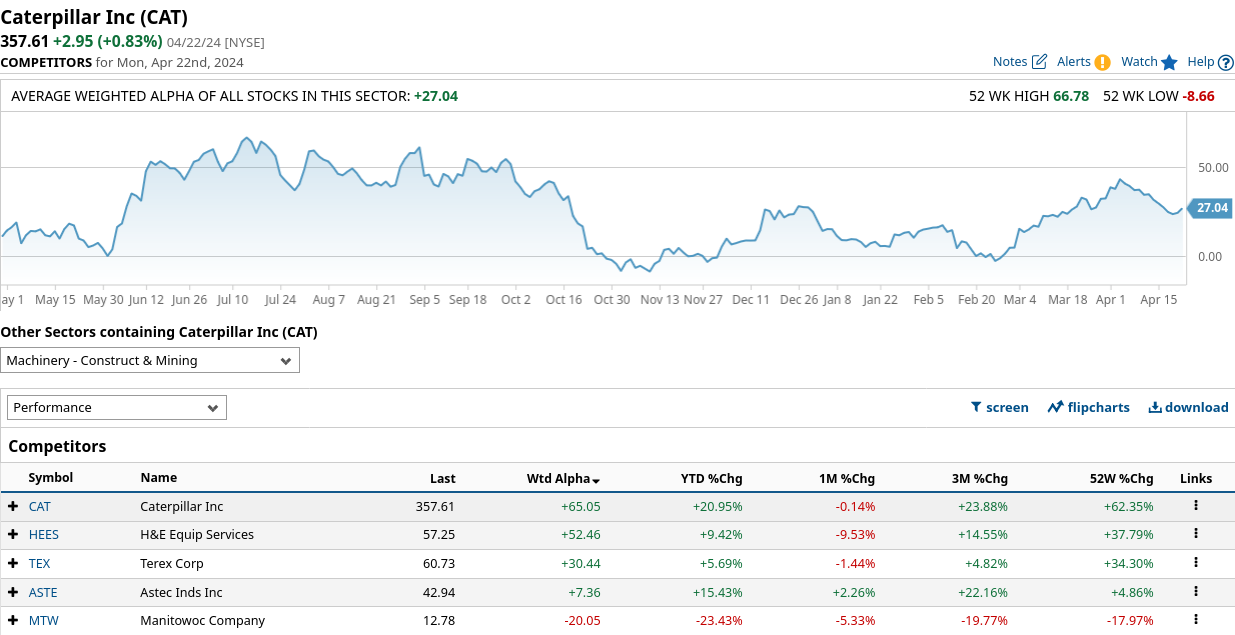
CAT is also leading its peers on the charts:
Charts
Let's start with a daily chart. CAT recently hit a high of $380.62 and slid back down to the bottom of the 20 day price channel. As a reminder, the entire market had a slide this week and we will look at CAT's relative performance during the slide in just a moment.
There's an upward sloping 200 day moving average that really started changing as we bounced out of the November 2003 low:
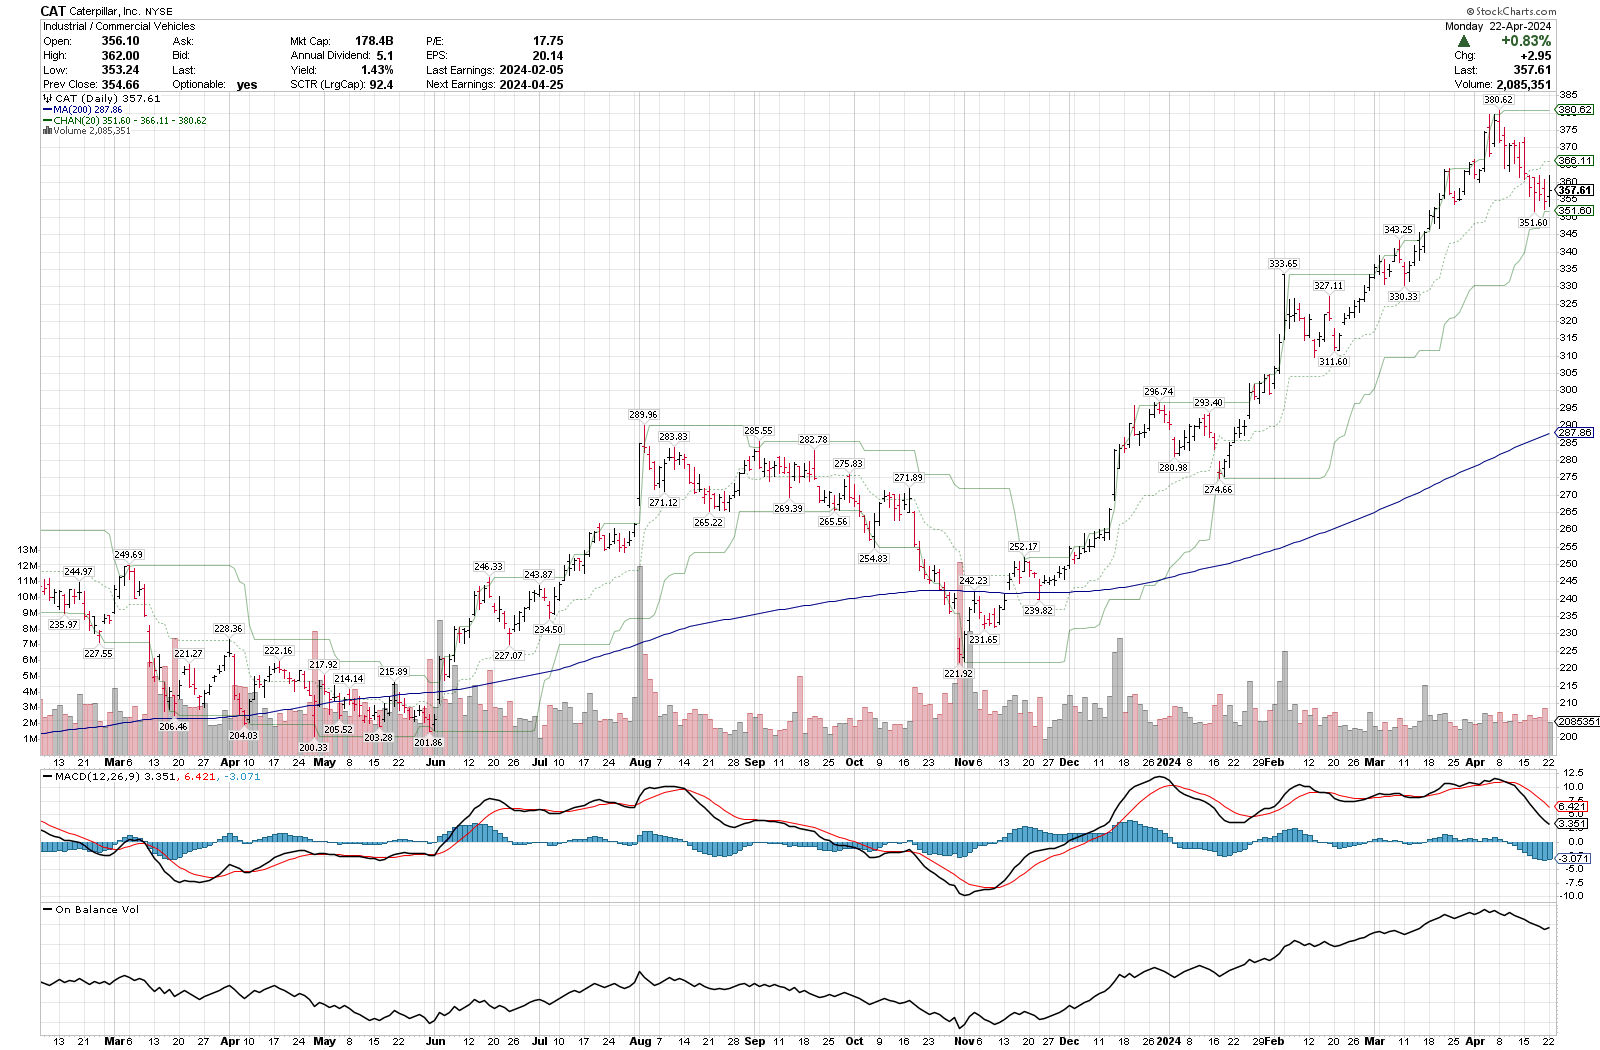
MACD remains above the zero line as it has since December 2023. The run to $380 seems slightly stronger than the run to $333 in February since the MACD made a higher high in April. However, the higher high is barely higher, so let's try not to read too much into that.
On Balance Volume measures the balance of bullish and bearish volume to plot a line. I like to see this line move with the stock price as a confirmation of where we are going. OBV increased out of the November 2023 low and kept increasing through April.
This OBV pattern differs from most of the charts I've seen lately. Most charts have the OBV failing to make a higher high recently as prices topped out in April. CAT is bucking the trend a bit here and this could make earnings a bit more interesting.
Let's switch to a weekly chart to compare patterns here:
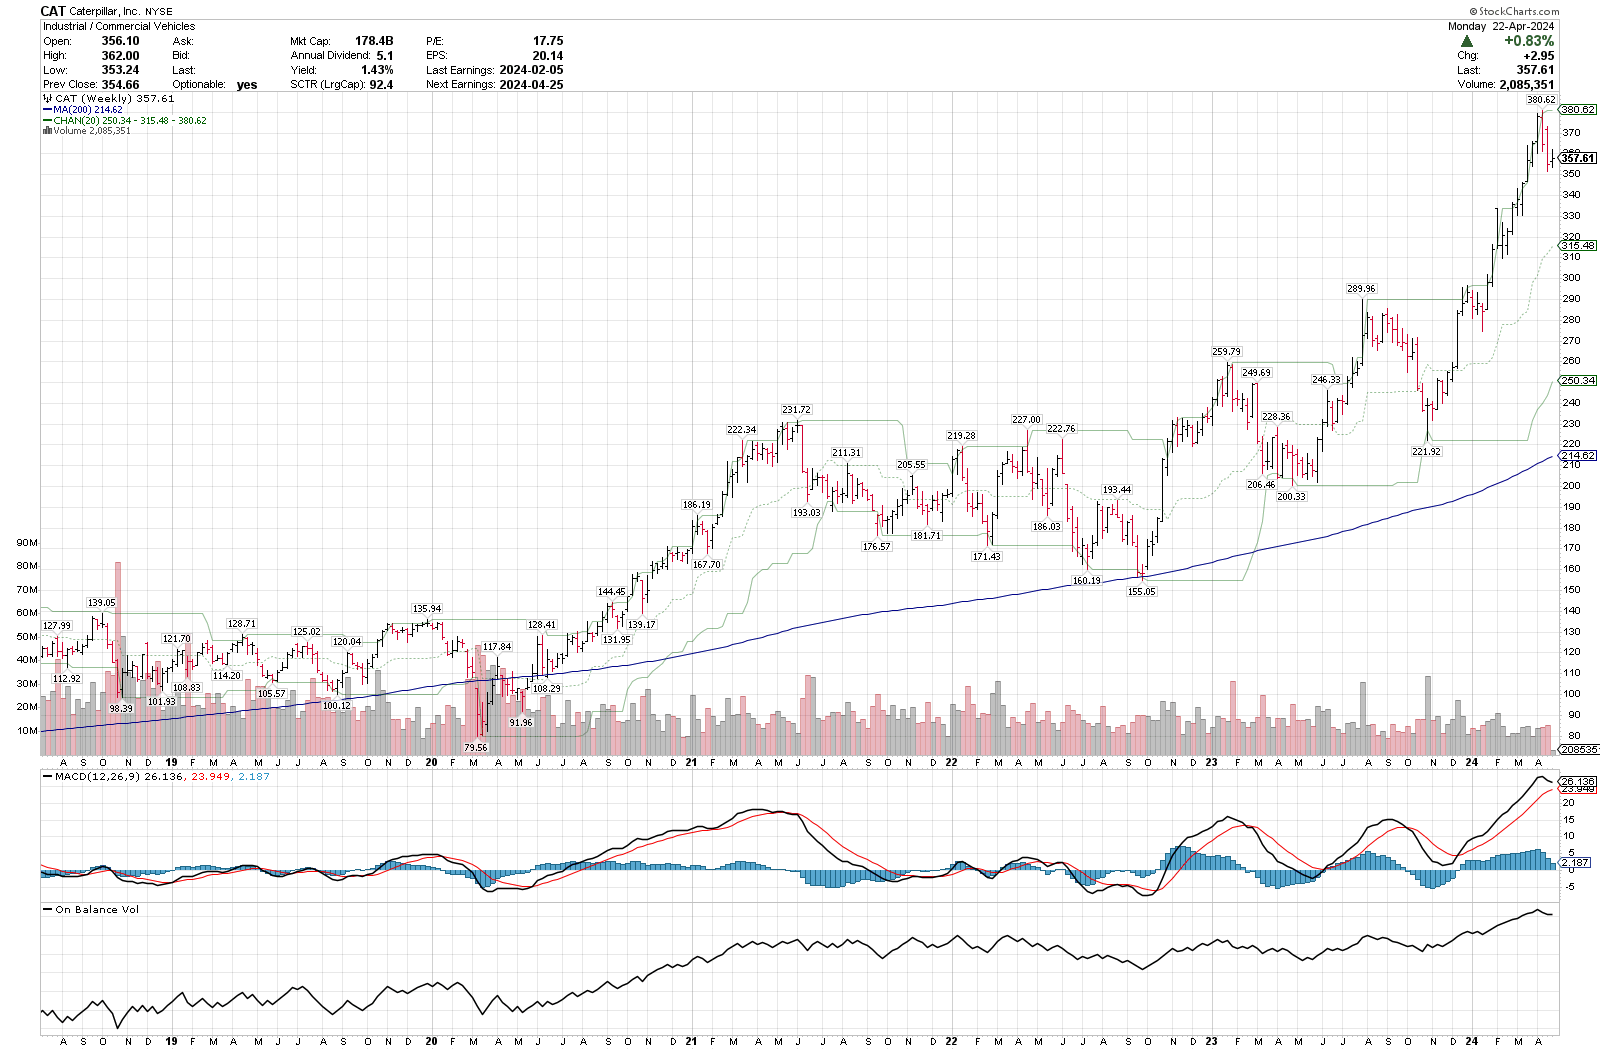
There are three big things I notice here:
- Price has been slammed against the top of the 20-week channel since December.
- MACD is very positive and the recent slide hasn't caused a bearish cross (yet).
- OBV has been in an uptrend along with price since October 2022. 👀
How is CAT performing against the S&P 500 index?
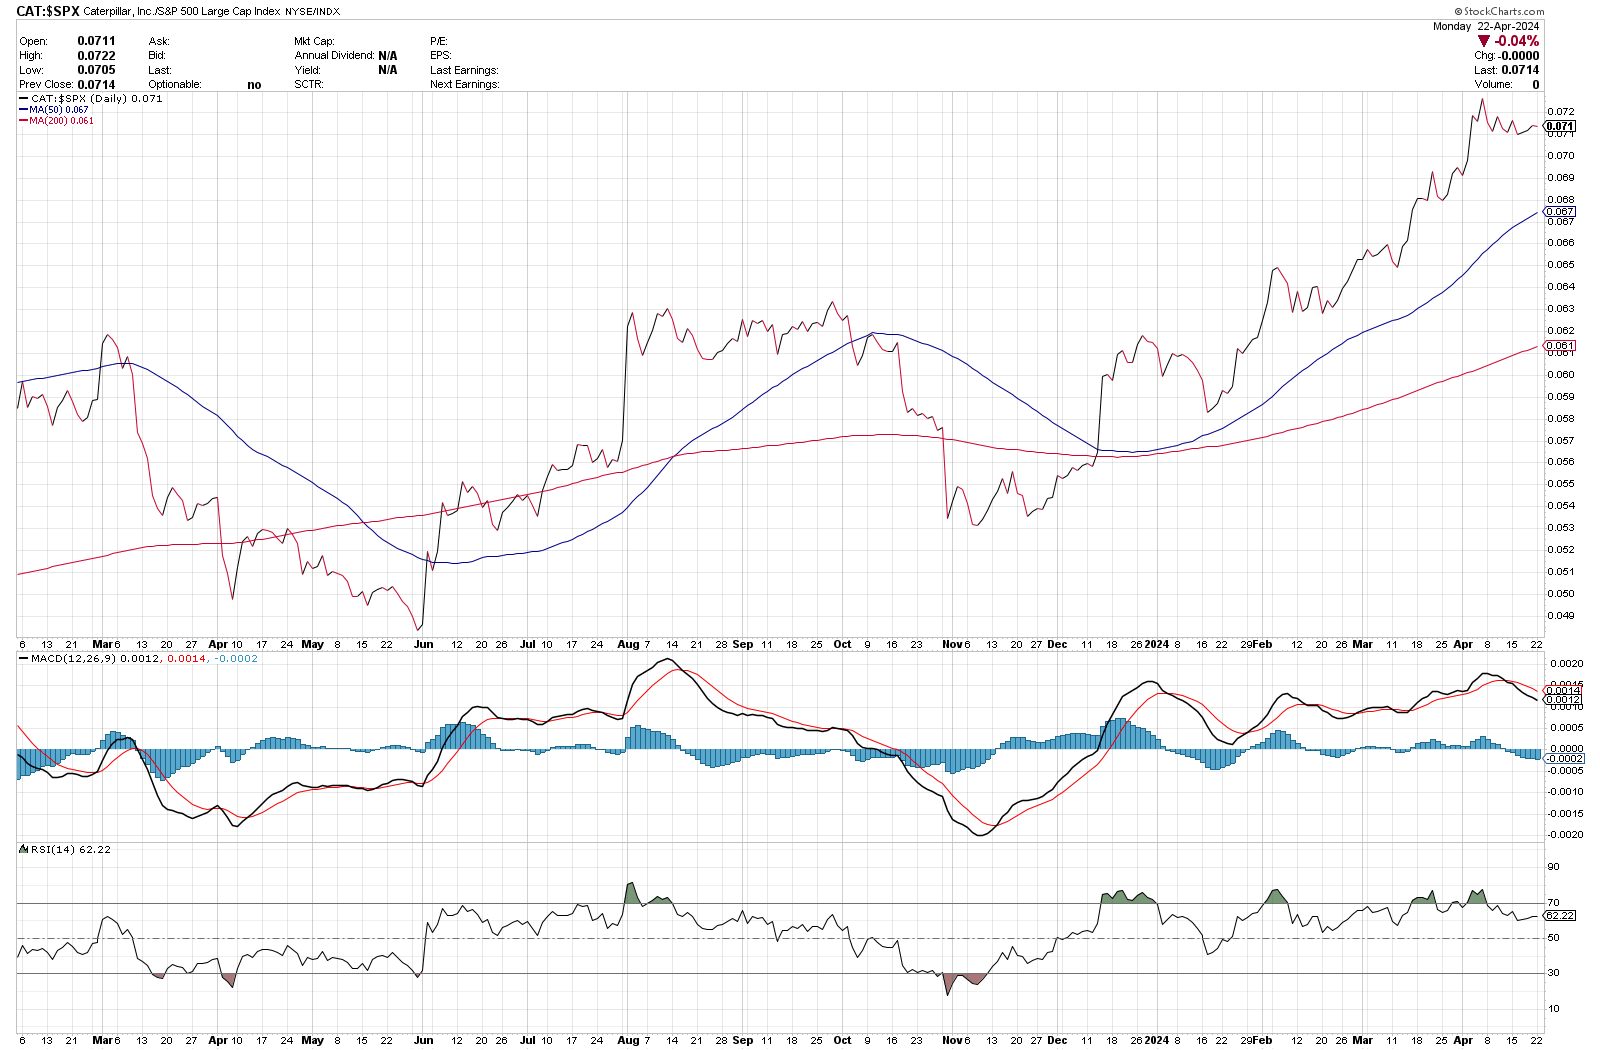
Again, CAT looks quite strong here and has been gaining strength on the index since the end of 2023.
Institutions
Volume Leaders can tell us when large trades were made, how large the trade was, and the price at which it was traded. Let's start with a look at the last 30 days with market-on-close trades included:
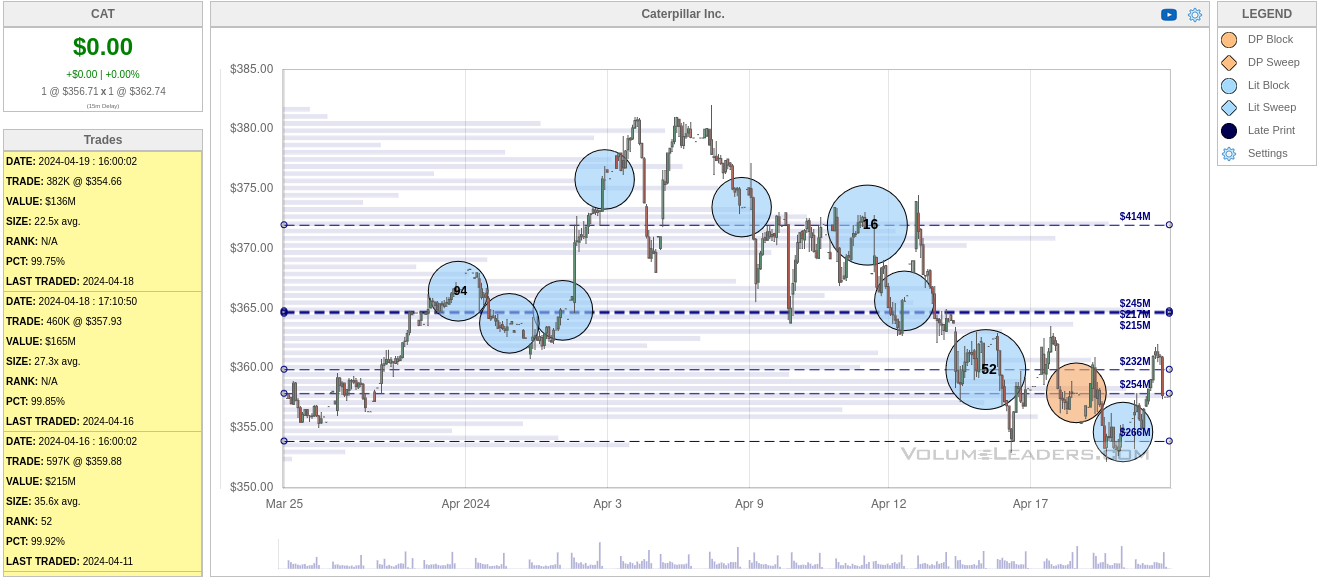
The brakes definitely came on at the highs above $370 with a #16 trade before April 12. That was just shy of 1M shares. As we approach the bottom of the 20 day channel (scroll back to the daily chart), trades are picking up again, including a dark pool trade (orange circle).
Removing closing trades didn't change the chart much, so let's try a 90 day chart:
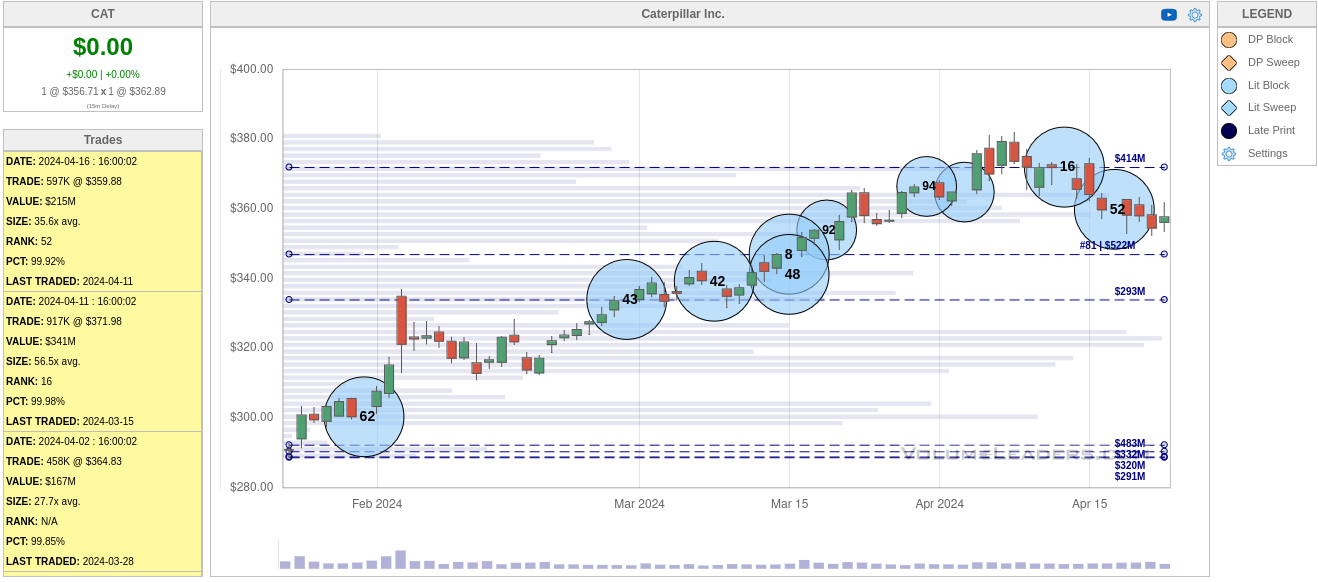
CAT has lots of interest from institutions from about $335-$350 recently, including the 8th biggest trade in CAT's history. That one was 1.3M shares just under $347. This will be a key level to remember since the 20 day channel bottoms around right around this level, too.
Thesis
CAT might be slightly overvalued according to some, but its chart shows strength both in isolation and relative to its peers. $340-$350 looks to be a big level to watch through earnings as institutions were very involved at those levels.
If CAT were to drop to those levels, we should be prepared for a potential bounce. If CAT loses those levels, the slide could be extended down to $300.
I currently have a short $340/$380 strangle on CAT for May 17 and both sides were losing ground yesterday as IV increased a bit going into earnings. However, I'm up about $350 on the strangle so far after rolling the call side down twice:

My plan here is to get a 50% profit or manage the trade at 21 DTE. Going inside 21 DTE opens me up to a lot of gamma risk and I'd like to avoid that.
Good luck to everyone out there today! 🍀
Discussion