AAPL Analysis for April 10th

AAPL's chart is starting to look a little more interesting this week. Let's dig into the data.

Welcome back! There is plenty of news for the market this week, especially today's CPI release. However, there's not much there that is actionable for the average retail trader, so we will need to make plans on how we will react when the market reacts. 😉
It's been a while since I looked at AAPL so let's take a trip back to the charts and see what trends we can find.
All investments come with significant risks, including the loss of all capital. Please do your own research before investing, and never risk more than you are willing to lose. I hold no certifications or registrations with any financial entity.
Let's go! 🚀
About systems
So I might have gone on a mini rant about trading systems on Twitter yesterday:
Sheesh, if there's one thing I've learned the hard way, it's that you need to have a system.
— Major, the Theta Nerd (@thetanerdy) April 9, 2024
Build your own.
Build on someone else's.
Buy one (if you must).
Then commit to following it whether your account is green or red. Consistency is key.
Feel free to read the brief thread, but my overall point is that you need a system for trading that works for you and that you can follow no matter what the market is giving you. Lots of traders attach themselves to a system that is too complex or they abandon it at the first sign of a losing trade.
Countless books mention that every trader will have winning and losing trades, but the key is to ensure the winners are bigger than the losers. You can lose 80% of your trades as long as your losers are small and your winners are much larger.
I've always tried to maximize my win percentage because I think it's some kind of a badge of honor, but I've come to realize I'm running towards the wrong goal. I'd gladly take a smaller winning percentage with larger winners than losers.
TL;DR: Pick a system and stick with it through good and bad. Pick your exits before entering a trade. Make sure the system works for you. If you buy a system, ask yourself why they're selling it instead of trading with it themselves.
Back to AAPL
It's clear that AAPL has made the double hump camel formation since the last earnings call. 🤭 (Just kidding, but I wanted to see if you were paying attention.)
AAPL had a nice bump after earnings on decent volume, but the highest high was made on weak volume if you look at the On Balance Volume (OBV) oscillator at the very bottom. I like to see a new high on the chart paired up with a new high in the OBV below. That tells me that there's more volume, and more traders, behind the move.
AAPL's second thrust up to about $196 failed and the OBV failed to make a new high there, either. Then the long slide began back in February. It's been hugging the trend line on the way down.
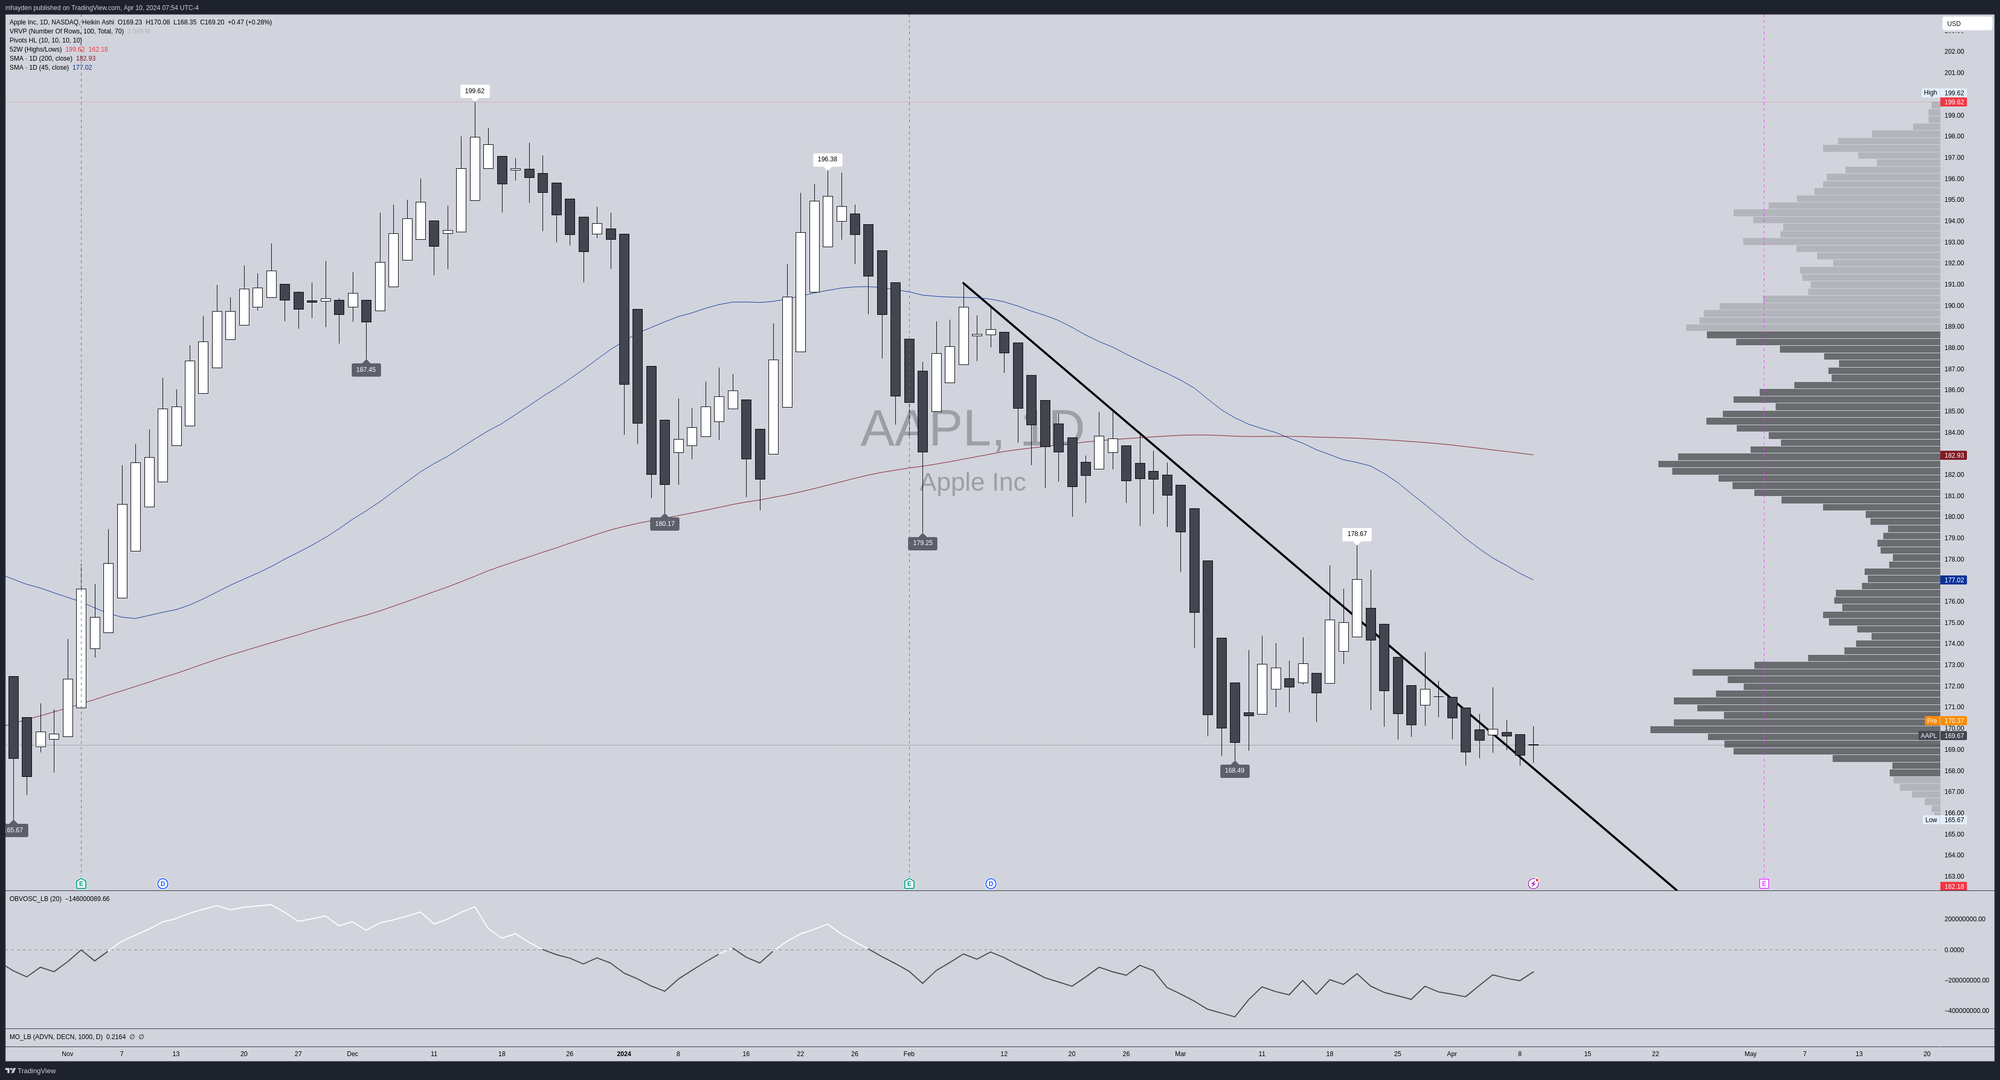
The OBV oscillator shows that bullish volume is increasing slightly in March and April. The Heikin Ashi candles have smaller bodies with longer wicks and that often indicates that some kind of change in sentiment is coming for AAPL. It's trying to break above the trend line, but it hasn't really made a substantial move yet.
As for volume, the Volume By Price (VBP) indicator on the right shows that volume is concentrated around $169-$173 and $182-$183. Price often seeks out high volume areas and when price stays in a high volume area for a while, that's a sign of consolidation before the next move. We might be looking at the early days of that pattern now.
If we zoom out a bit to the weekly, the pattern begins to look like a double top (one in July 2023, another in December 2023). Price has cut through the 45 and 200 day moving averages aggressively and volume has trailed off, especially at the second high in December.
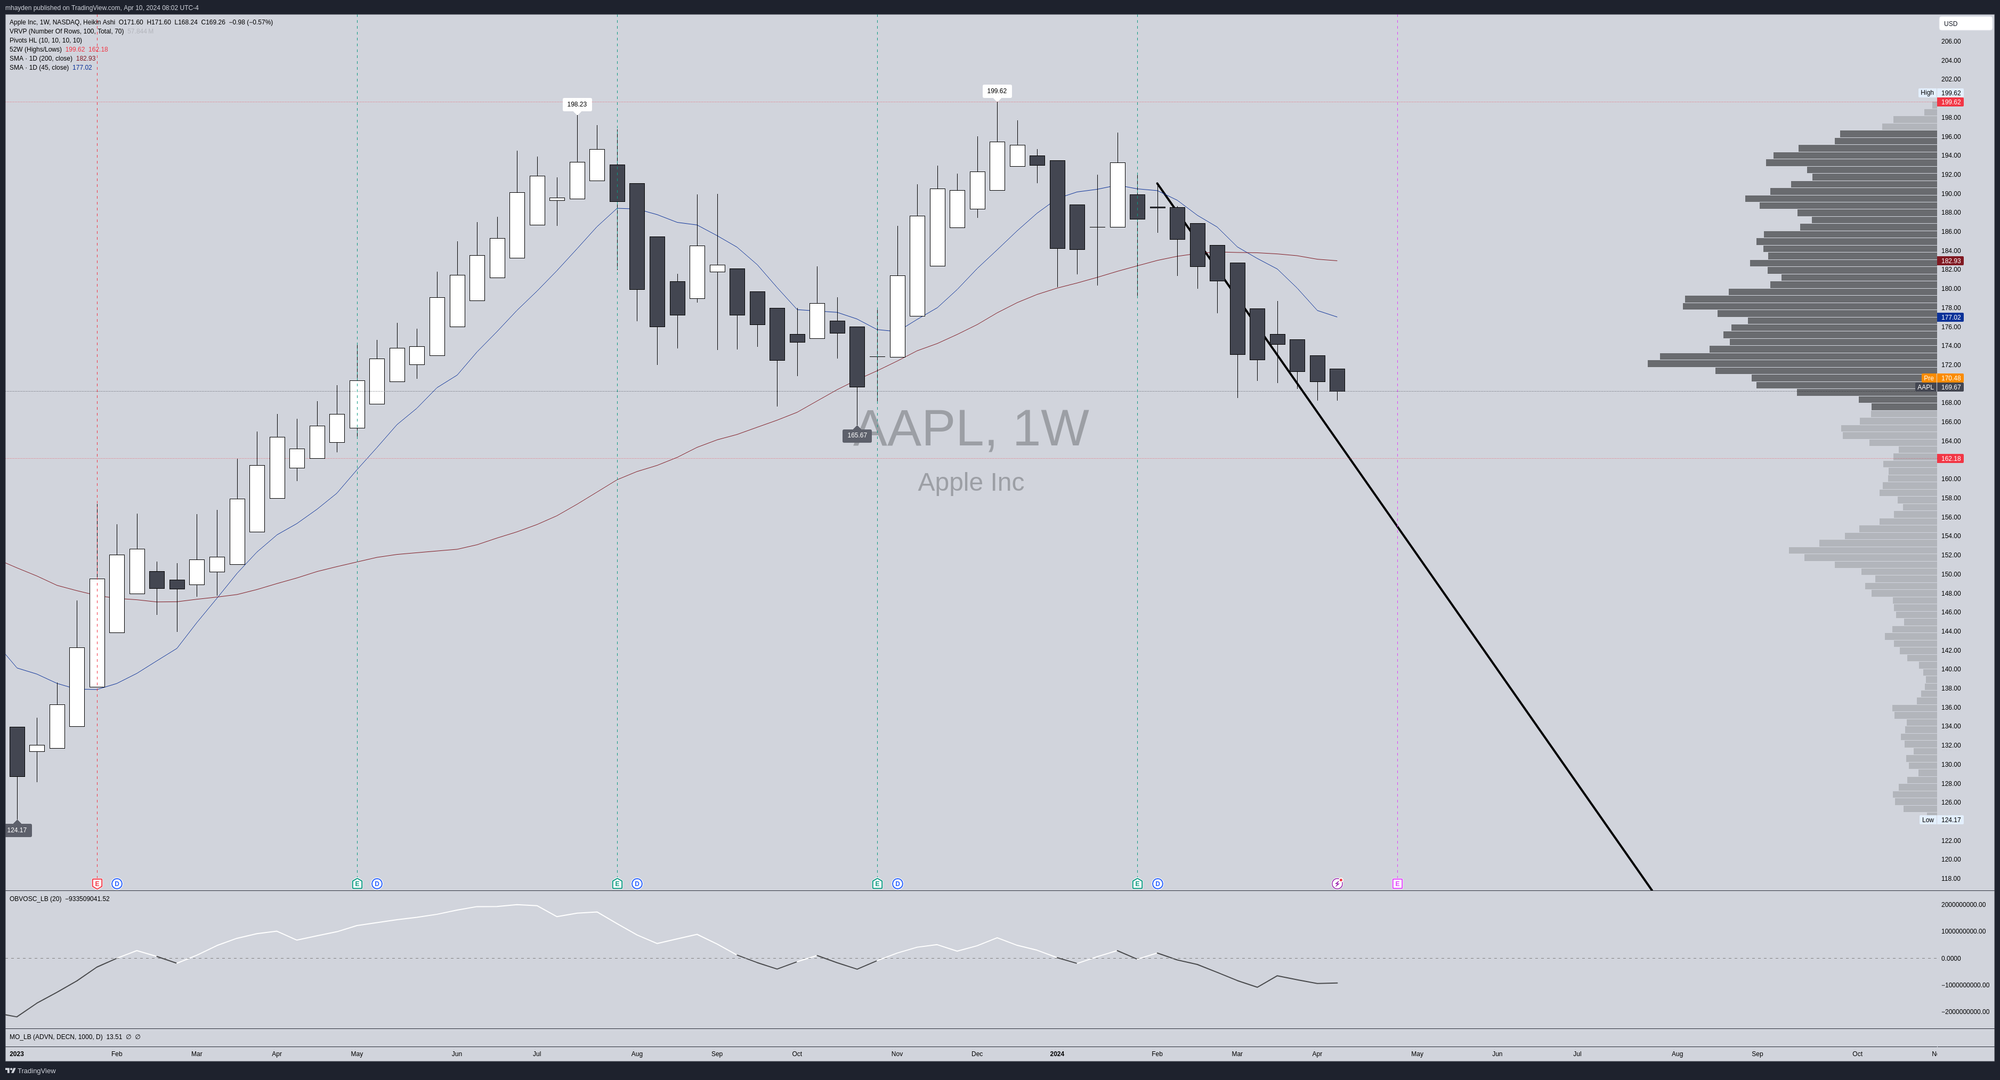
The most recent three weeks have no top wicks on the candles, which suggests a strong bearish trend. However, note that the candle bodies have been getting smaller since late February. We're seeing a sign of a trend change on the weekly chart, too.
Institutions
Volume Leaders provides another good way to look at where volume sits on the charts as it tracks large trades made on exchanges and via dark pools. Although it doesn't tell us the direction of the trades, it does give us an idea of where institutions are interested.
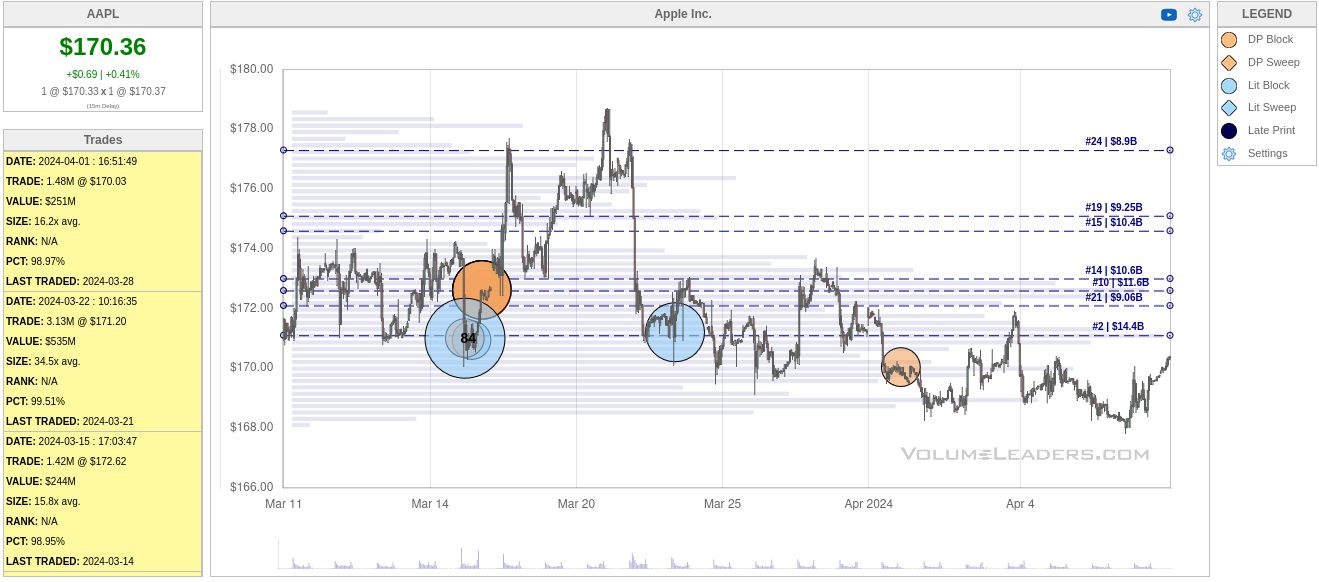
Over the past 30 days, there's a ton of activity around $171 with about 13 million shares traded back around March 15th and another three million or so on March 22nd. There are a few scenarios that could be in play here:
- Institutions are opening long positions
- Institutions are adding to their long positions
- Institutions are opening short positions
- Institutions are adding to their short positions
Let's zoom out a bit more to 90 days:
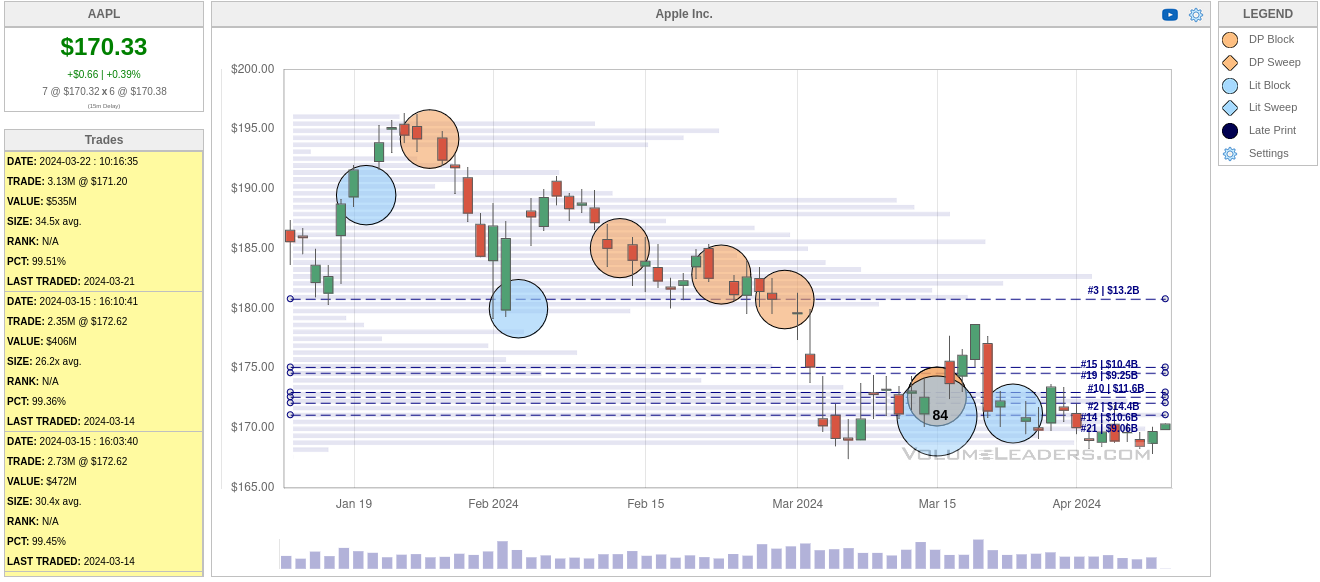
Ah, this gives a lot more context! We see plenty of trading at the highs and then AAPL moves down through more trades until it hits the high volume area in the lower $170s. This is one of my favorite patterns that I see on Volume Leaders where consolidation begins and institutions begin quietly building positions for the next move.
Thesis
Let's go back through what we've seen:
- Charts suggest we're in a downtrend, but candlesticks hint at a change
- OBV suggests a slight bullish turn in volume
- AAPL broke above the downward trend line, but it hasn't made a significant move past it (yet)
- Institutions traded AAPL on the way down, but they've been establishing large positions lately in the lower $170s (unsure if long or short)
Remember, we can't predict the markets, but we can react to them. If AAPL makes a larger move off the trend line with a rising OBV, I'd be inclined to make a bullish trade on AAPL with an exit near the trend line.
If AAPL breaks below the trend line once more, I'll likely stay on the sidelines until we get another good move.
I did have an AAPL short strangle on the board earlier this week, but I took it off for a profit because I didn't want the call side to be blown up if AAPL was about to make a bullish move. AAPL doesn't move terribly quickly, but the implied volatility is generally low in AAPL and the options premium didn't look like it was worth the risk.
Good luck to everyone this week! 🍀
Discussion