AMD stock and options analysis for October 30

AMD earnings are coming up tomorrow, but what does the chart and options data suggest will happen? Let's get a look. 🎃

Hello from Texas on a very windy, cold, and wet day. I was assigned on some puts over the weekend just as we head into AMD's earnings on 10/31. I'm hoping for treats but expecting tricks. 🎃
Go back and read yesterday's Charts & Coffee for a broad look at the overall markets. Just to recap, the latest price action hints at some market weakness and June's breakout looks like a false one. I'm expecting more moves to the downside but we have some critical levels coming up soon where the market might (or might not) make a stand.
All investments come with significant risks, including the loss of all capital. Please do your own research before investing, and never risk more than you are willing to lose. I hold no certifications or registrations with any financial entity.
Let's see what AMD has for us right now.
Vanna
We will kick off today's post with a deep dive into AMD's vanna charts.
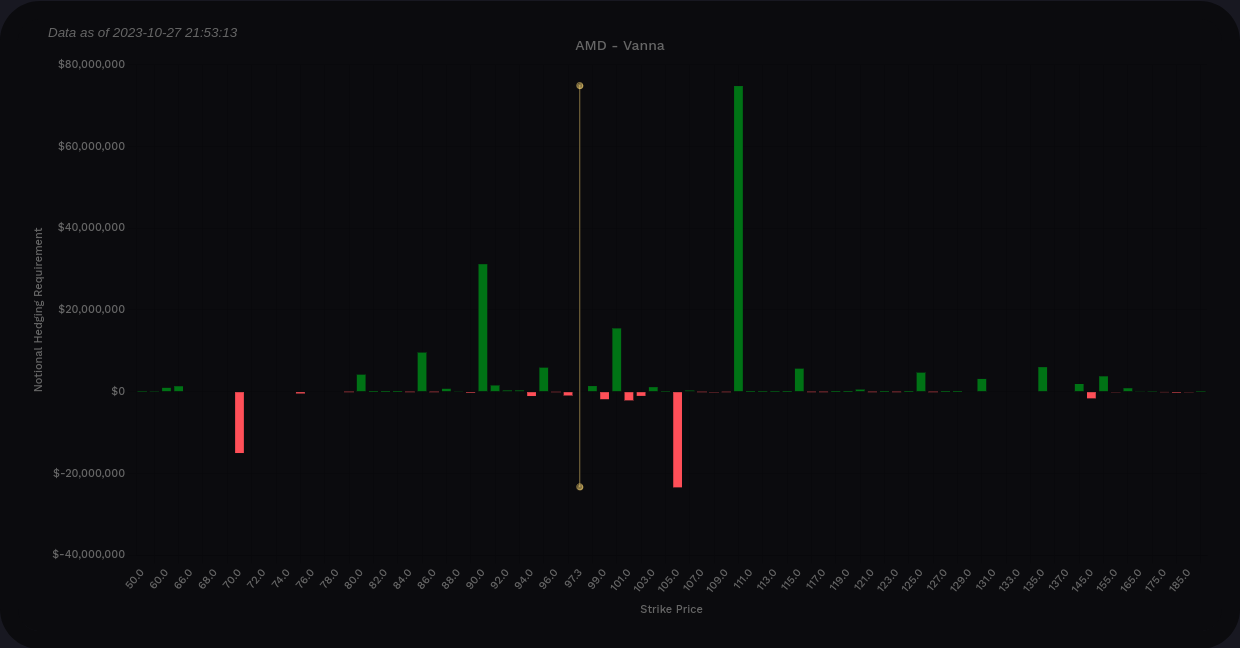
The AMD vanna curve remains positive at the extremes, which bodes well for AMD if IV contracts this week. The bar chart shows that an IV crunch would most likely send us to $110 as long as we don't get stuck on the $105 negative vanna strike.
If IV expands more, $90 looks like a spot where we catch our best support. $85 and $80 are very small. There's a negative bit down at $70 that looks like hedges to me.

AMD vanna on aggregate
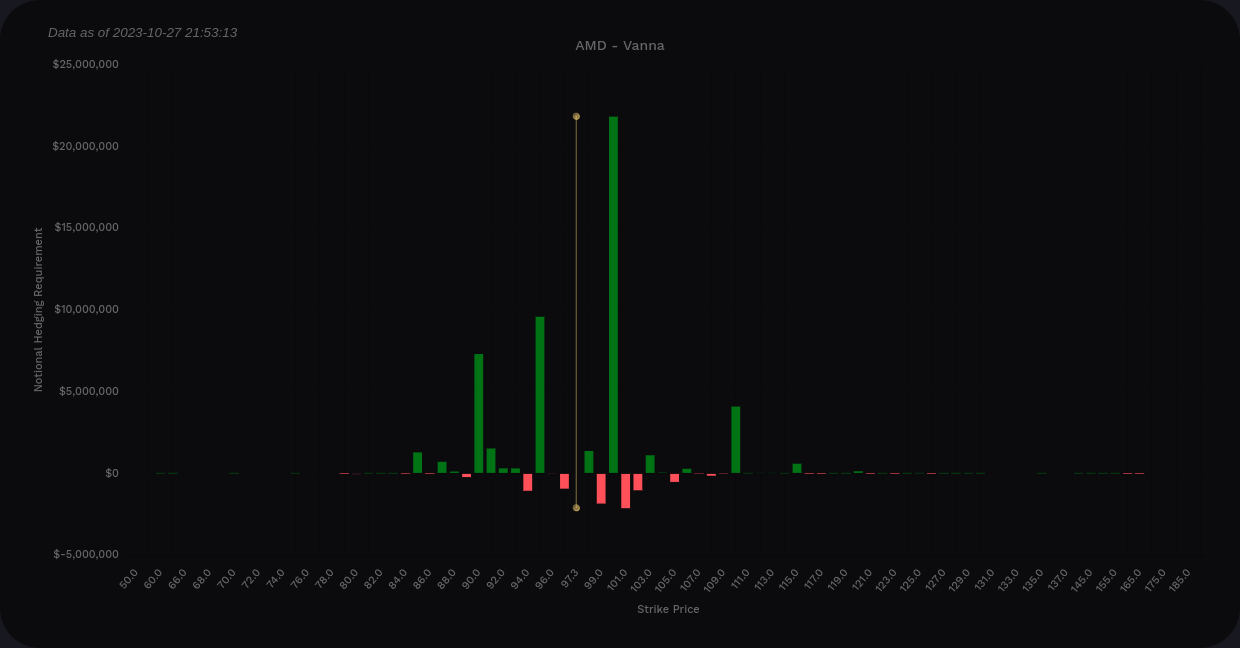
Most of my trades are focused on 12/15 right now, so let's see how AMD is doing up to December's OPEX. We're positive at the extremes again and the bar chart is much tighter.
$110 is possible, but $100 might be our upward limit for now. We have two decent bars below at $95 and $90 to provide support. I'm not a big fan of these charts because vanna seems a bit low and the bars are close together. I've seen 2-3 stocks go into earnings lately this week and have some wild swings with tight gamma charts, most notably TSLA.
AMD vanna now through 12/15
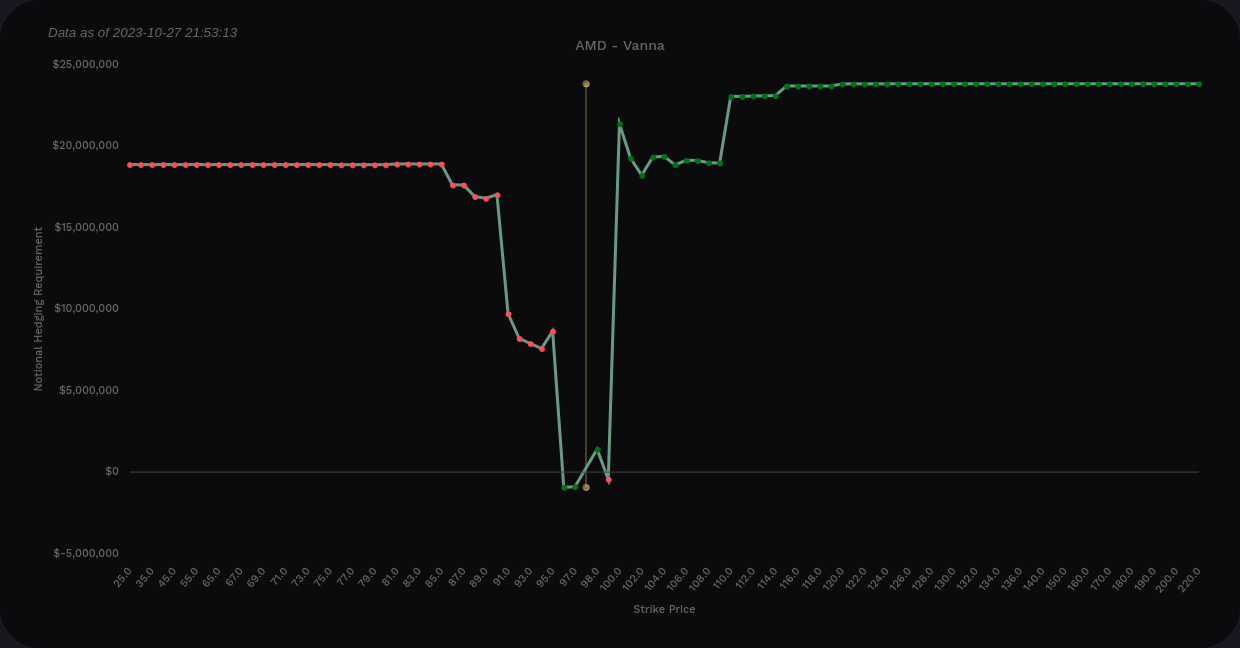
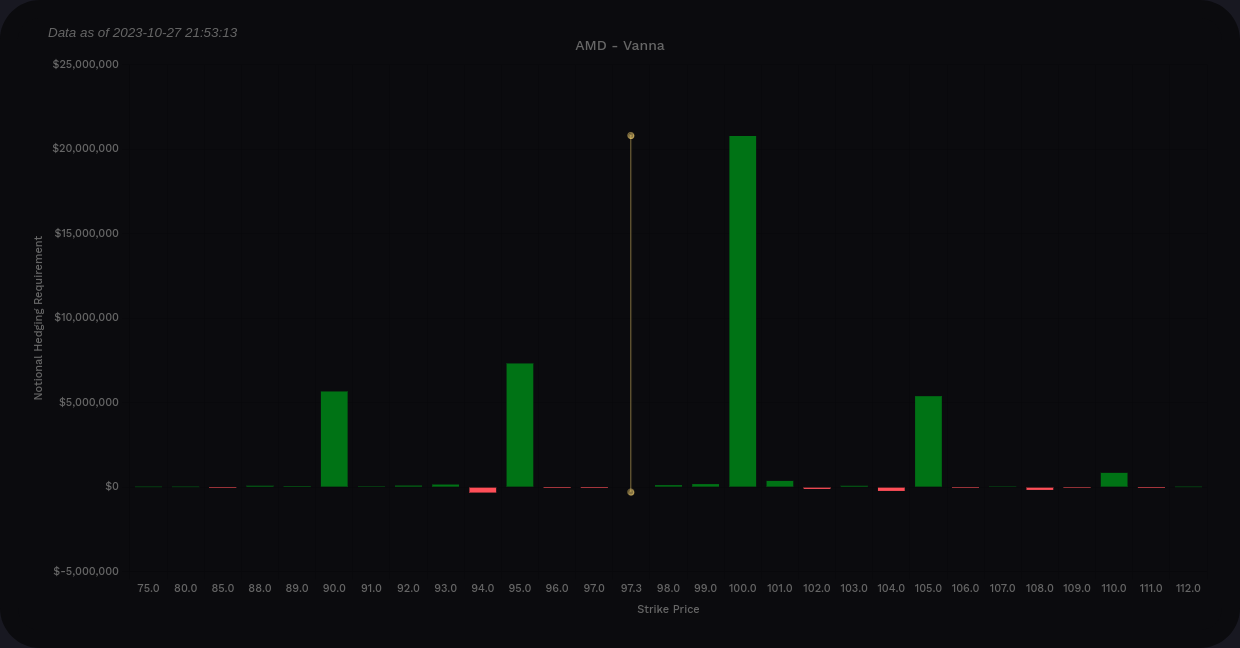
If we look at the November OPEX all by itself, it's entirely positive, but it tops out at $105.
December's OPEX by itself shows $105 as a big negative vanna level. Vanna is still positive on aggregate for 12/15, but only by a 1:2 margin.

What does this mean? AMD looks more bullish for 11/17 than 12/15 if IV drops. That typically happens after earnings unless there's a big surprise during the earnings call.
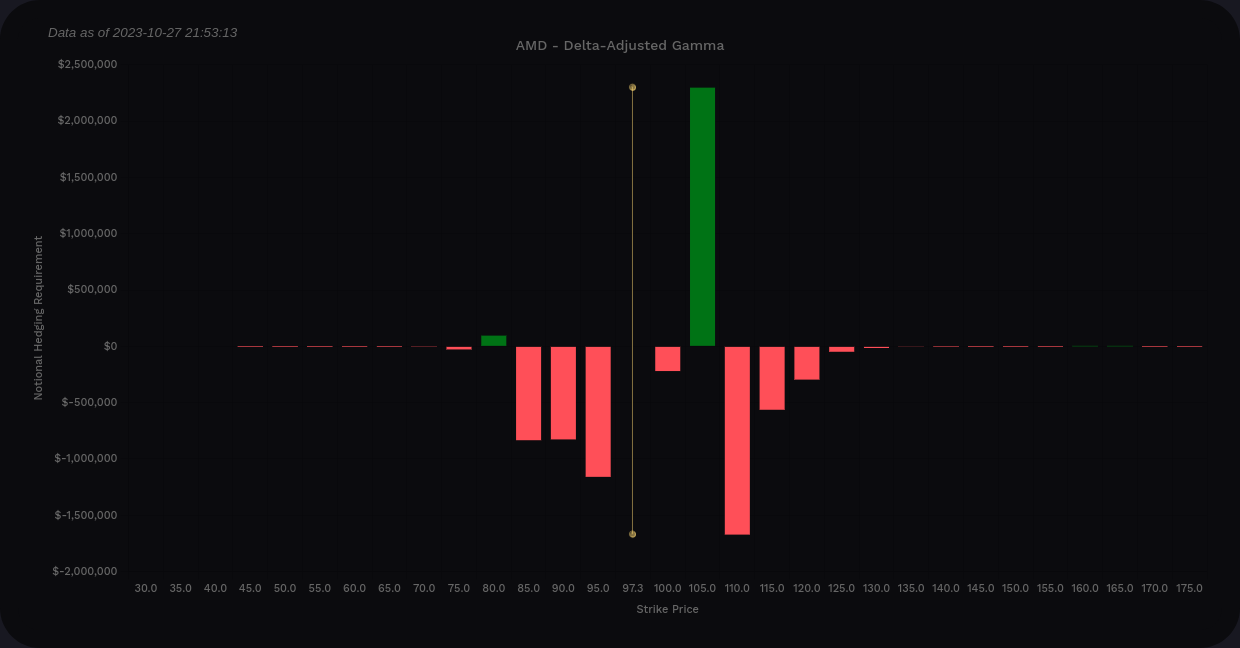
Gamma
Volland's delta-adjusted gamma flips the gamma levels above the current price to point out levels where dealers might take action. This doesn't tell us much about directionality like vanna does, but it does point out the strikes where price could be pulled or repelled.
$110 and $90 are the biggest negative strikes here with $100 and $95 having some fairly large bars. We find some potential support way down at $70 that might repel the price if we get all the way down there. Other than that, there's not much resistance from positive gamma levels in here.

11/17 is all negative here. $100 is the largest with $95 coming in second. Everything on the 5's from $95 to $110 looks like a potential magnet or price accelerator here. AMD's price should be able to move without too much slowdown coming from gamma.

Resistance returns for 12/15 at $105 with negative gamma piled around it from $85-$120. On one hand, this chart tells me that AMD's price could finally break out of a channel here. On the other hand, it suggests that $105 will require some effort to get over.
Chart
There's a lot going on in this chart, so let's break it down with the bullish and bearish items first. The order blocks shown here are pink/magenta on the daily, gold for the four hour, and white for one hour (none of those on this chart).
On the bullish side:
- We've bounced off the discount zone (an ICT concept tool)
- Money flow is still positive and we had two bullish turn indications on the hyperwave (in the oscillator at the bottom)
- We're just above the VWAP lines from the COVID high and low points from March 2020
- Our first order block to consider is up around $107.50 since AMD broke the 10/3 order block on the 4h time frame.
- We didn't make it all the way down to the order block around $85 (yet).
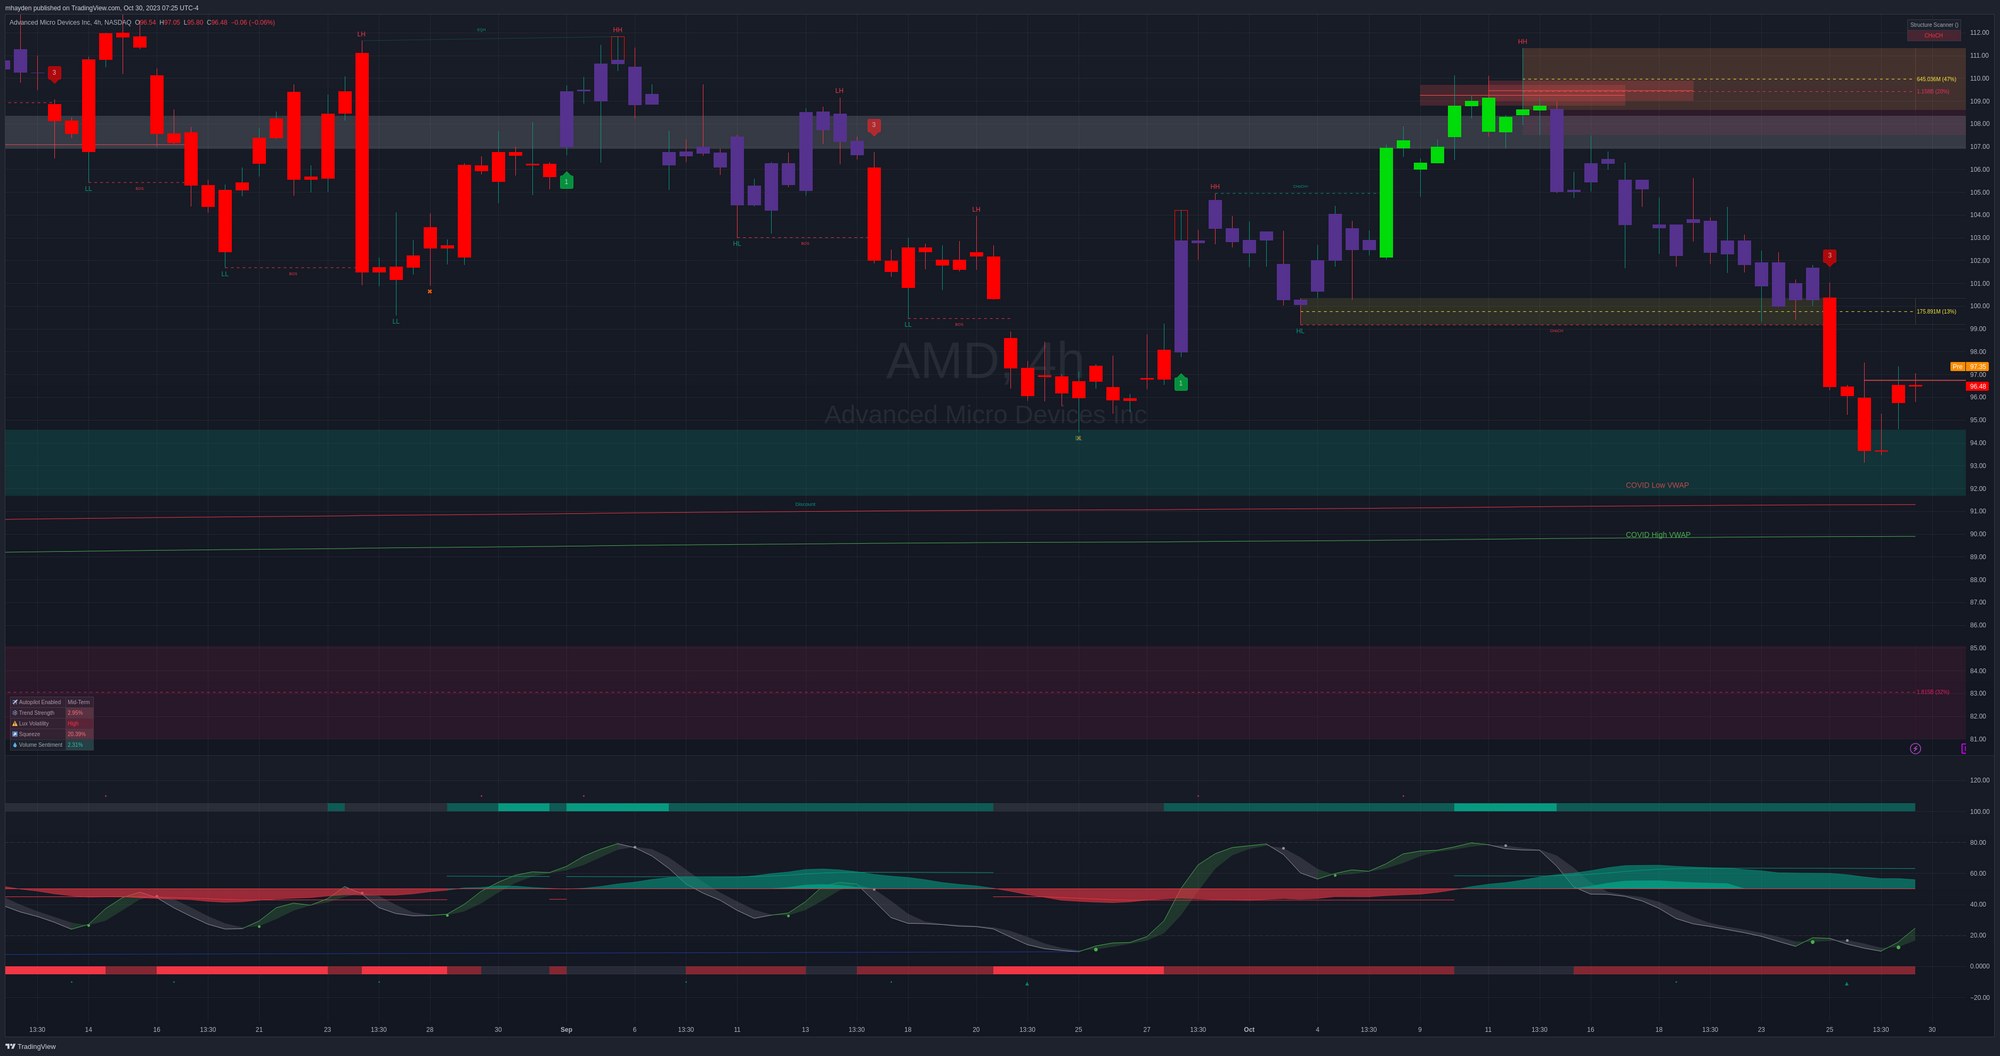
On the bearish side:
- AMD made a bearish fair value gap last week just above $96 that might become a resistance line
- Money flow is waning and we're in a bearish chart pattern with one bearish change of character so far (around $99.18)
- AMD has continued to make lower lows after some brief rallies
- The rest of the market looks like a downtrend inside a secular bull market and AMD is following it
Take a look at AMD's weekly since COVID in March 2020. We slashed through the VWAPs up from the COVID drop in 2022, bounced above, and now we look primed for a re-test of those levels.
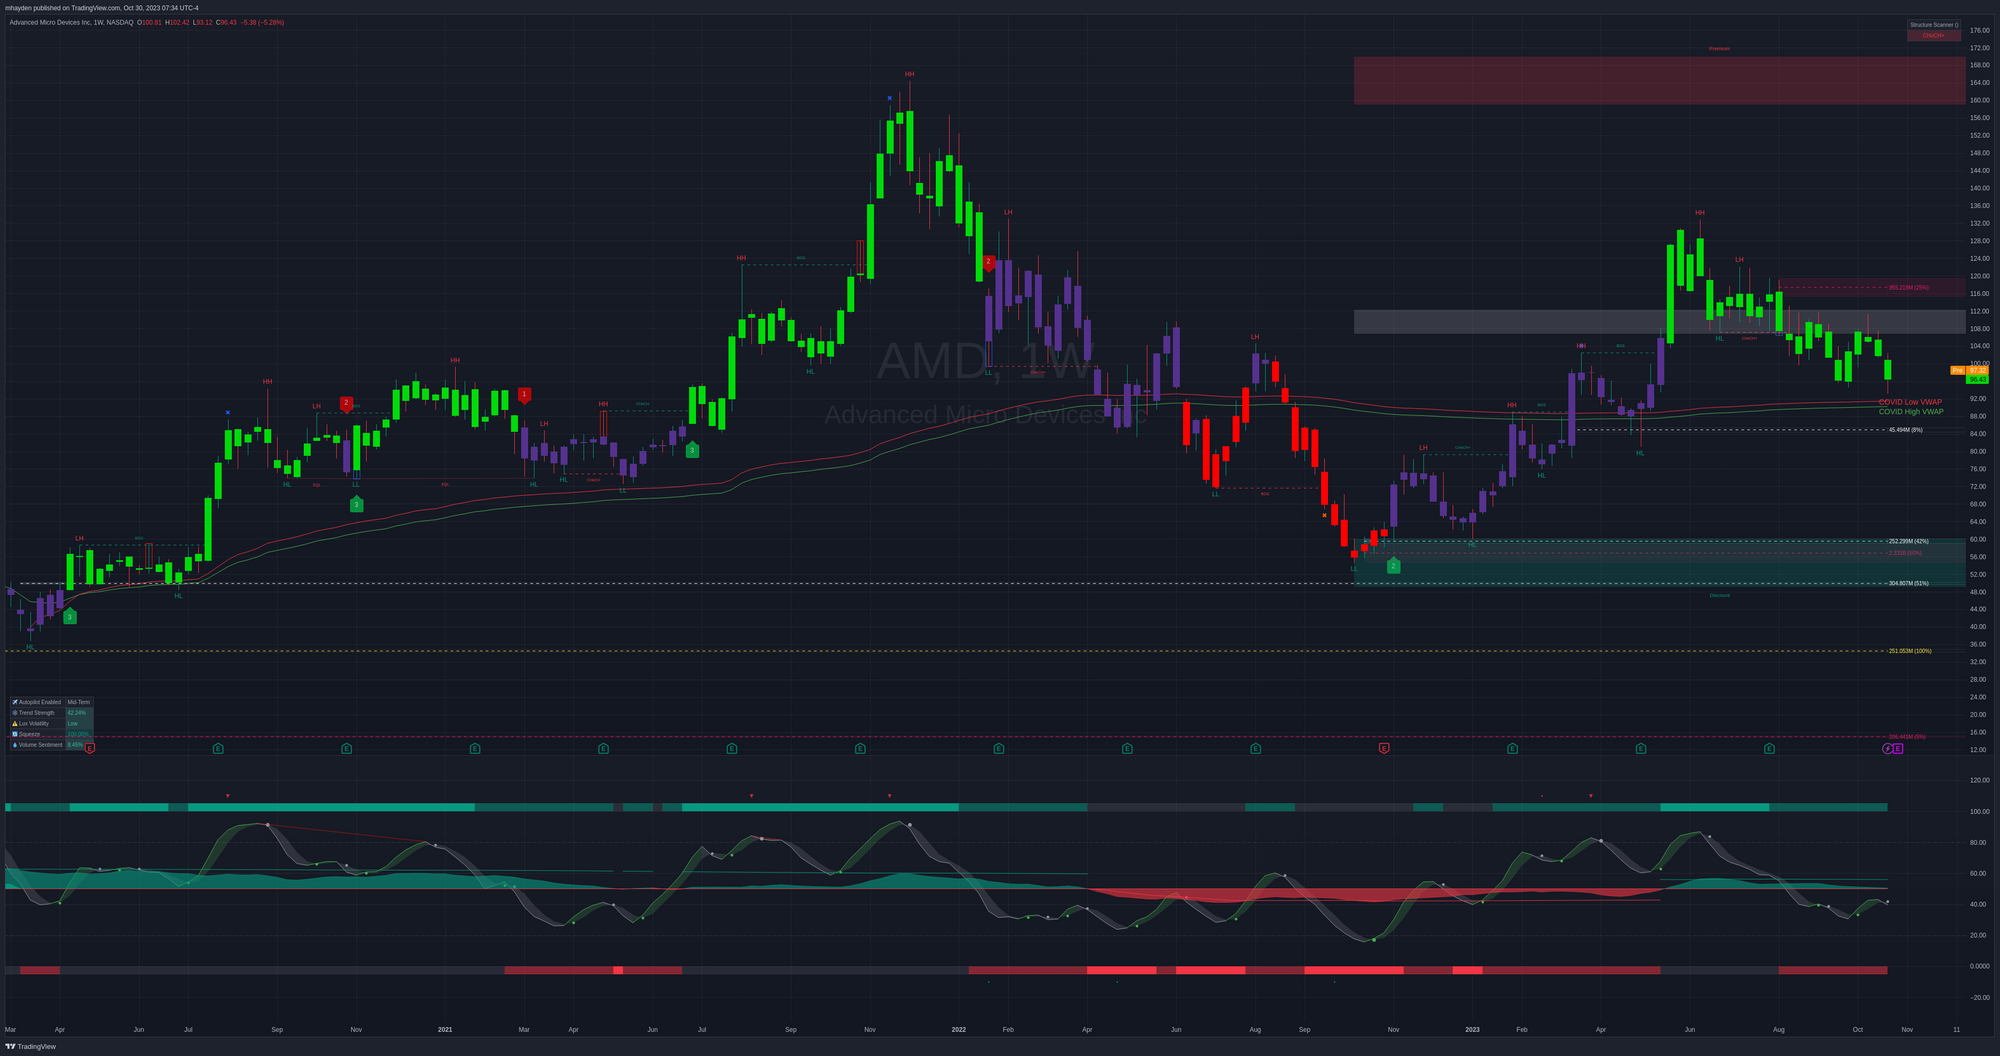
Thesis
My latest bullish bets are near that $85-$90 area. We have a lot of support stacked here from a discount zone to VWAP lines and the big order block from May's AI rally. Some argue that we will get back down to May's rally start since June's breakout was false. If that happens for AMD, we will see price action from $80-$85 at some point.
That growing $70 line on the vanna and gamma charts has me scratching a bit. They could be hedges, but they could be bets that we see AMD break through that May order block before it has a chance to rally.
Earnings will be interesting for sure. The market seems to be looking at companies to "fish or cut bait" with regards to AI. If companies don't have something substantial to show for all the AI hype, they risk some bearish moves.
As for my trades, my AMD shares remain above my cost basis, which is nice. However, they are down quite a bit from where I was assigned. I'll look to reduce my holdings after earnings as we head into the end of the year. I sold an $85 put for 12/15 that is looking quite good today.
I'm adjusting my trading strategies to more closely align with TastyTrade's strategies of 45 DTE delta-neutral trades. The directional risk lately on short term trades has eaten into my profits and the stress simply is not worth it.
Thanks for reading! Good luck today! 🍀
Discussion