Another look at NVDA on December 8

NVDA's whipsaw since the May gap up continues, but it's testing VWAP lines more aggressively. Is it preparing for a jump up or a ride down? 🤔

My last look at NVDA was back on Thanksgiving week and a lot has happened since then. Price has been coiled up a lot since July 2023. That suggests we're about to blast off in one direction or the other, but which is it? 🤔
All investments come with significant risks, including the loss of all capital. Please do your own research before investing, and never risk more than you are willing to lose. I hold no certifications or registrations with any financial entity.
It's data time. 🔎
Vanna
Our first stop today is the vanna charts from Volland. NVDA has responded really well to vanna levels this year.
I like NVDA's vanna curve for bullish trades overall, but I don't like to see this negative dip above and below price. That suggests we will have difficulty moving in either direction. At a very high level, the curve does look good with overall positive vanna on both sides of the current price.
We have two large positive vanna pillars on each end. One sits at $380 and the other is at $550. Both of these have been here since before earnings, but NVDA had a tremendous amount of positive vanna ahead of price before earnings.
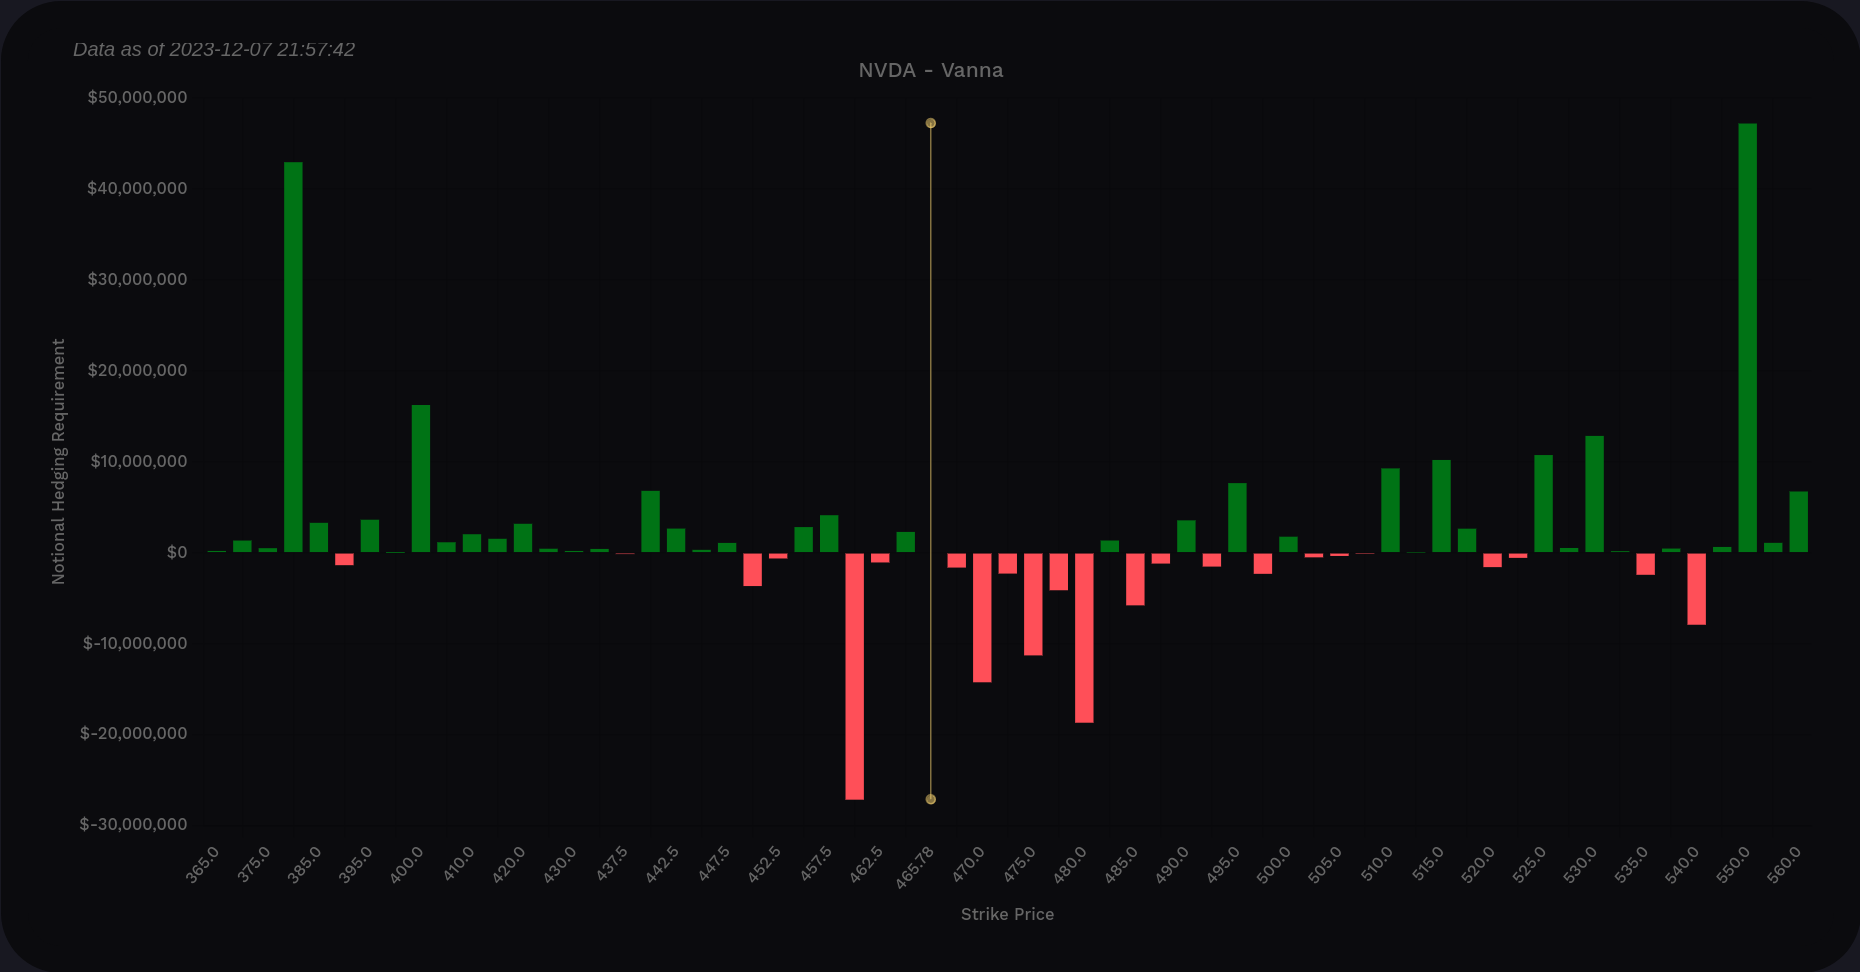
NVDA vanna across all expiration dates
If we head down, we first pick up some support around $400 and then a big wall of support at $380. This is also near the gap from 2023 that has yet to be filled. Traders might be betting on this gap being a support level for future price movement.
On the upside, there's a range of small positive gamma starting at $510 and it culminates in a massive bar at $550. This could be a good price target if IV remains calm and the market has plenty of liquidity. If you believe in Santa Claus rallies, than $510-$550 might be your target range.
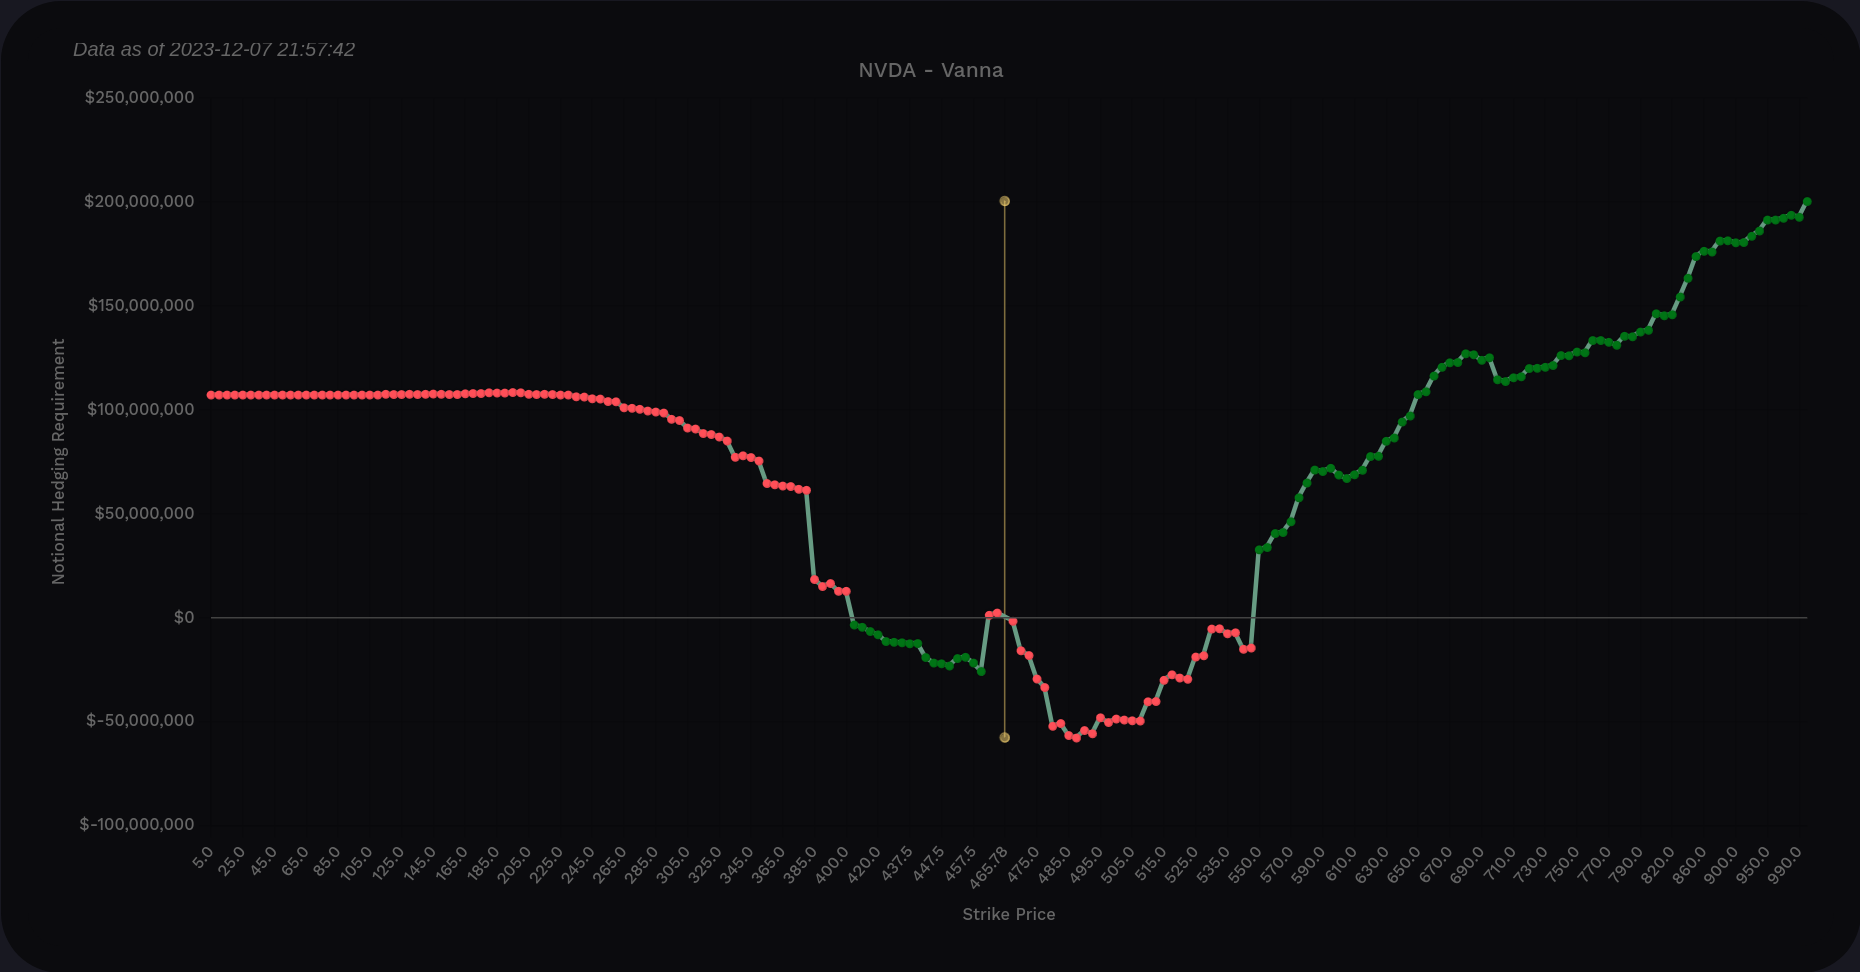
Most of my trades are through 1/19, so how does that data look? In short, it's much the same.
The $400 bar looks stronger relative to the $380 and the $550 is a little shorter. Perhaps a potential run to $550 might need to wait until after the 1/19 OPEX.
At this moment, I'm thinking of a $380/$550 range, but it feels like we're pinned into a more narrow range for a while. Let's see if we can find more data to correlate.
Gamma
Volland's delta-adjusted gamma (DAG) could give us more hints. NVDA's dealers will likely apply some buying pressure from $462.50 to $480 here, but it's mostly selling pressure outside of this range. $460 shows up as a big selling pressure wall and it's part of a selling range down to about $380 – the top of the gap.
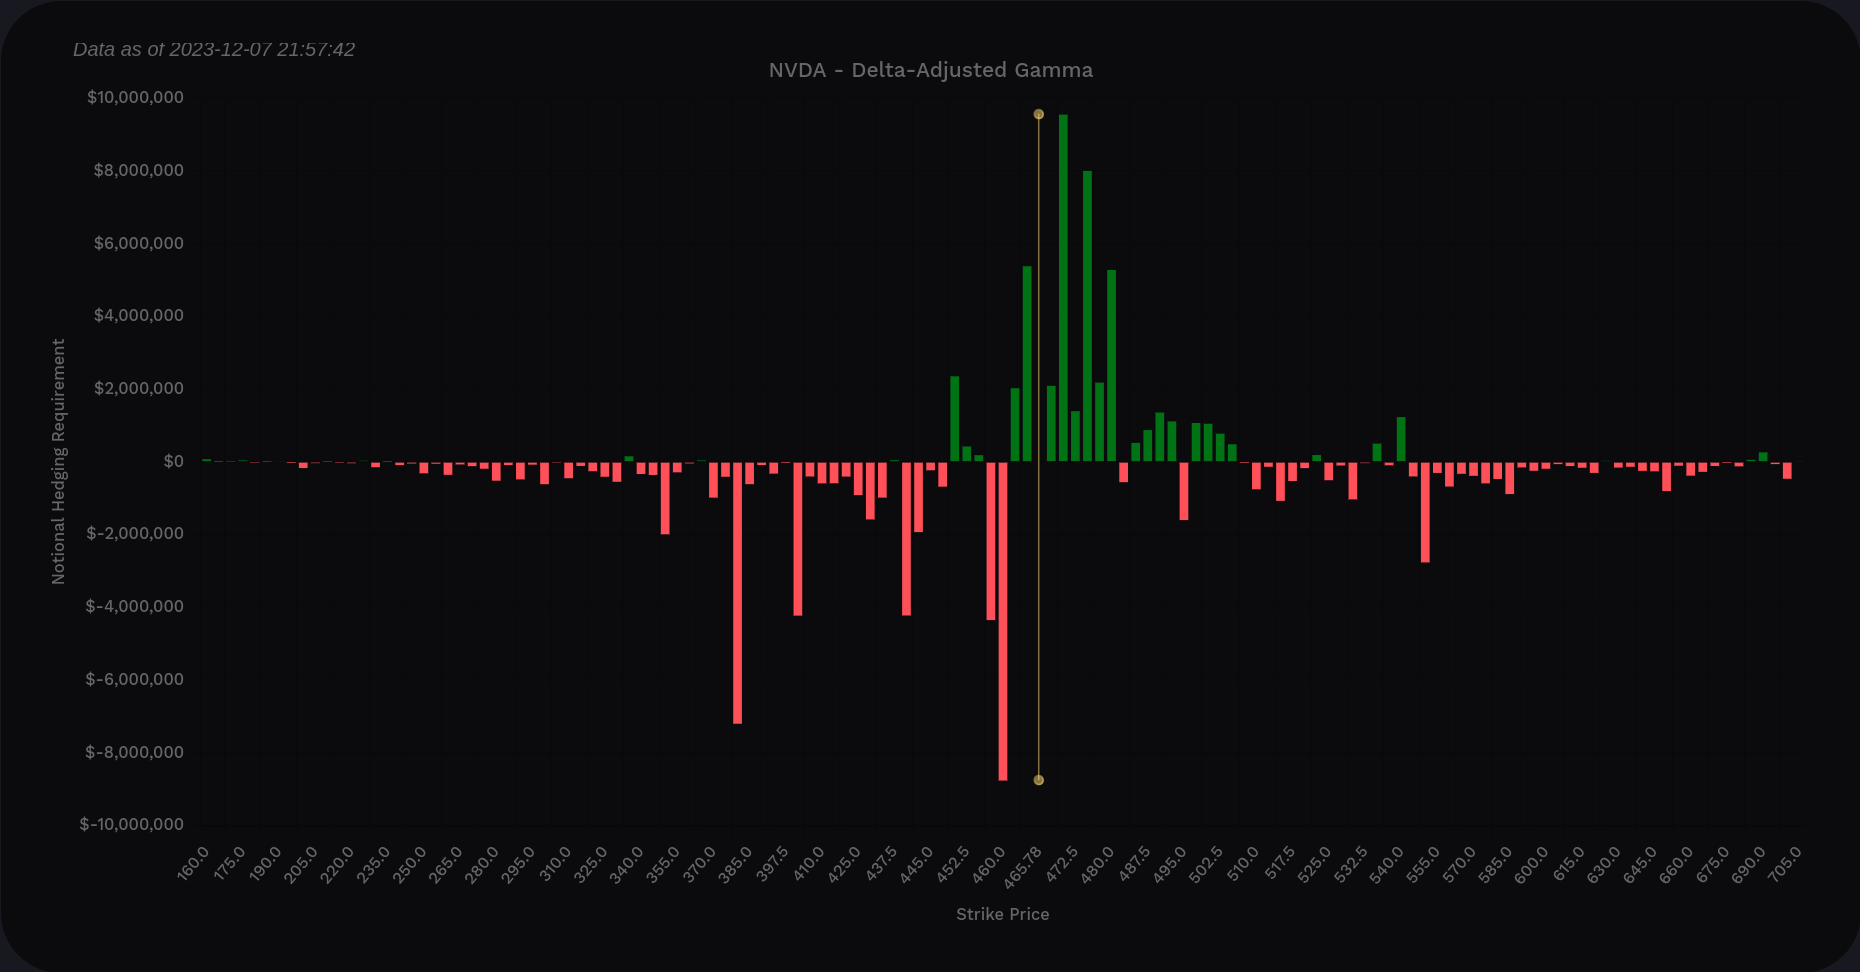
This confirms my thesis so far that NVDA is likely trapped in a little range for a while and that a move down might be accelerated by dealers due to the negative DAG below price and that huge $380 vanna level.
Institutional trades
It's nice to know where the traders with very deep pockets are making their bets. Volume Leaders makes this easier by telling you when trades were made, how big they were, and the price where they happened. We have to use everything else we know to guess which direction the trades were going.
If I ask for the biggest 10 trades of the biggest 100 trades on NVDA this year so far, here's what I get:
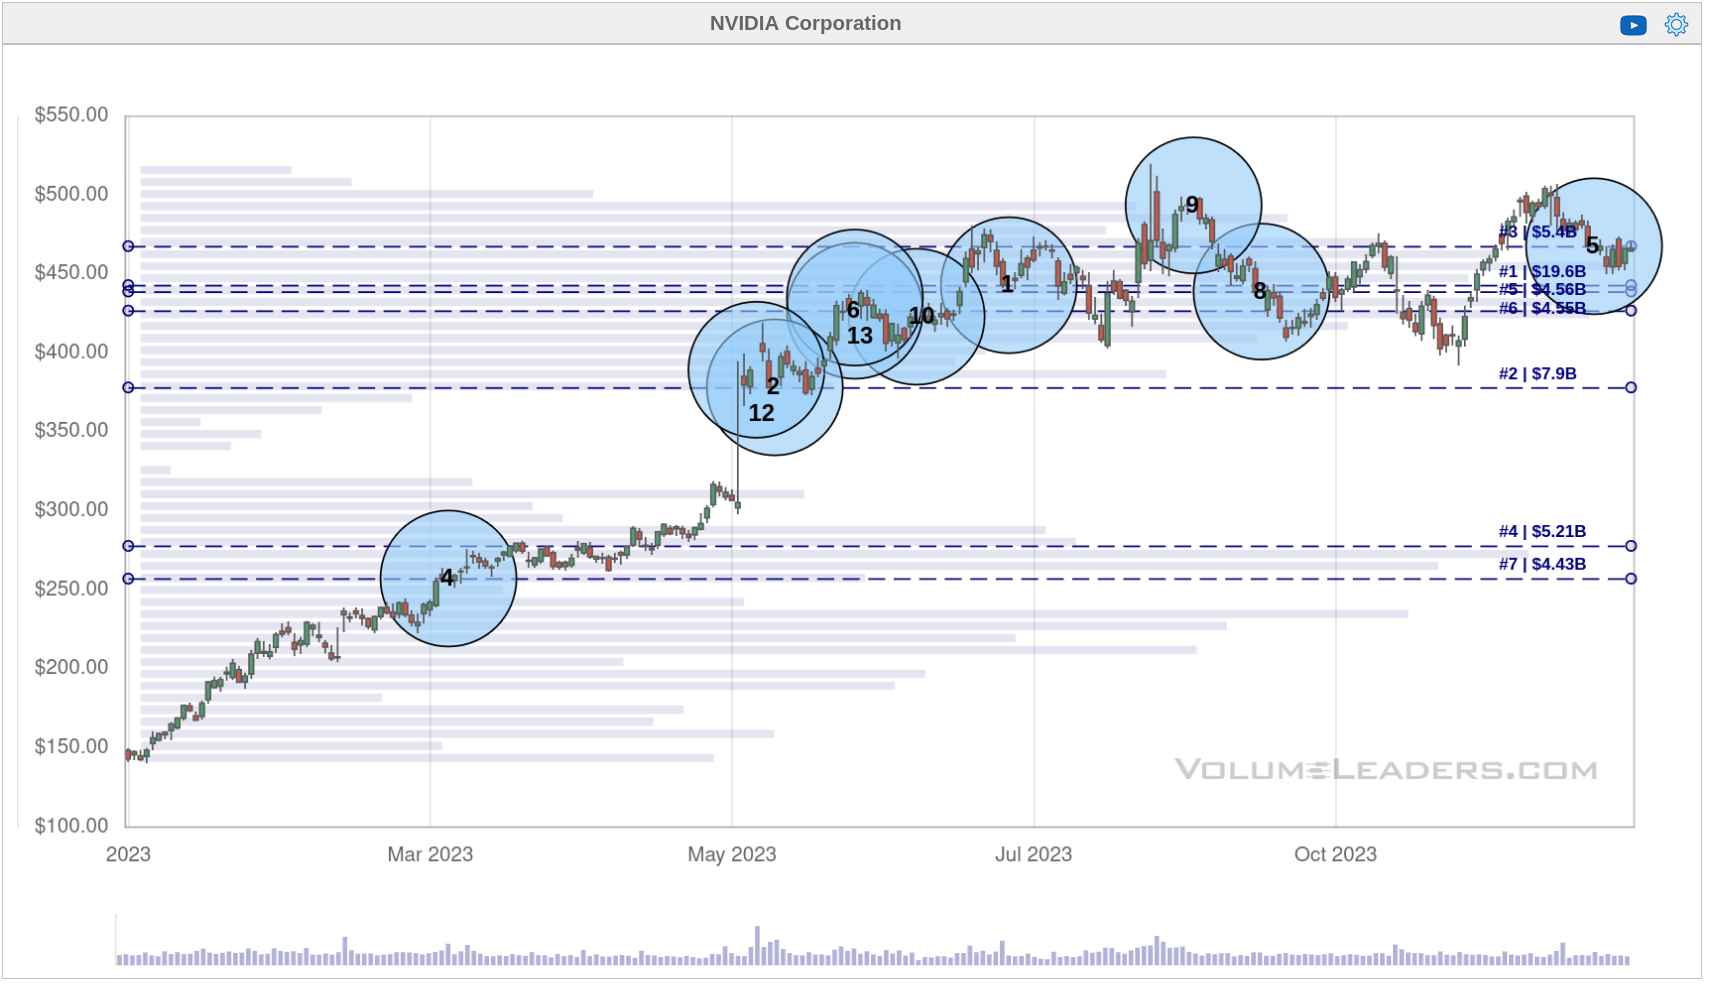
$378-$468 are really important levels on the chart since the largest trades happened in that range. Where have we seen $380 before? 😜 😜 😜 Our vanna and gamma charts are starting to line up well there.
What if we zoom in a bit to just the trades since July?

I'm looking for bases and tops here. That area around $440 seems like a strong base with a #1 and #8 trade on that level. That means these trades are the #1 biggest and #8 biggest trades for NVDA for all time! That's a big deal.
How about the top? $480-$500 seems to be where institutions are making big bets and price retreats after that. We got a #5 trade very recently just under $470 and now I'm wondering if that's a bullish or bearish bet. Gamma data suggests that's where the buying pressure from dealers disappears. This is a tough one to decide but if you worked for a massive institution and made the 5th biggest bet ever made on NVDA, where do you think price is going? 🤔
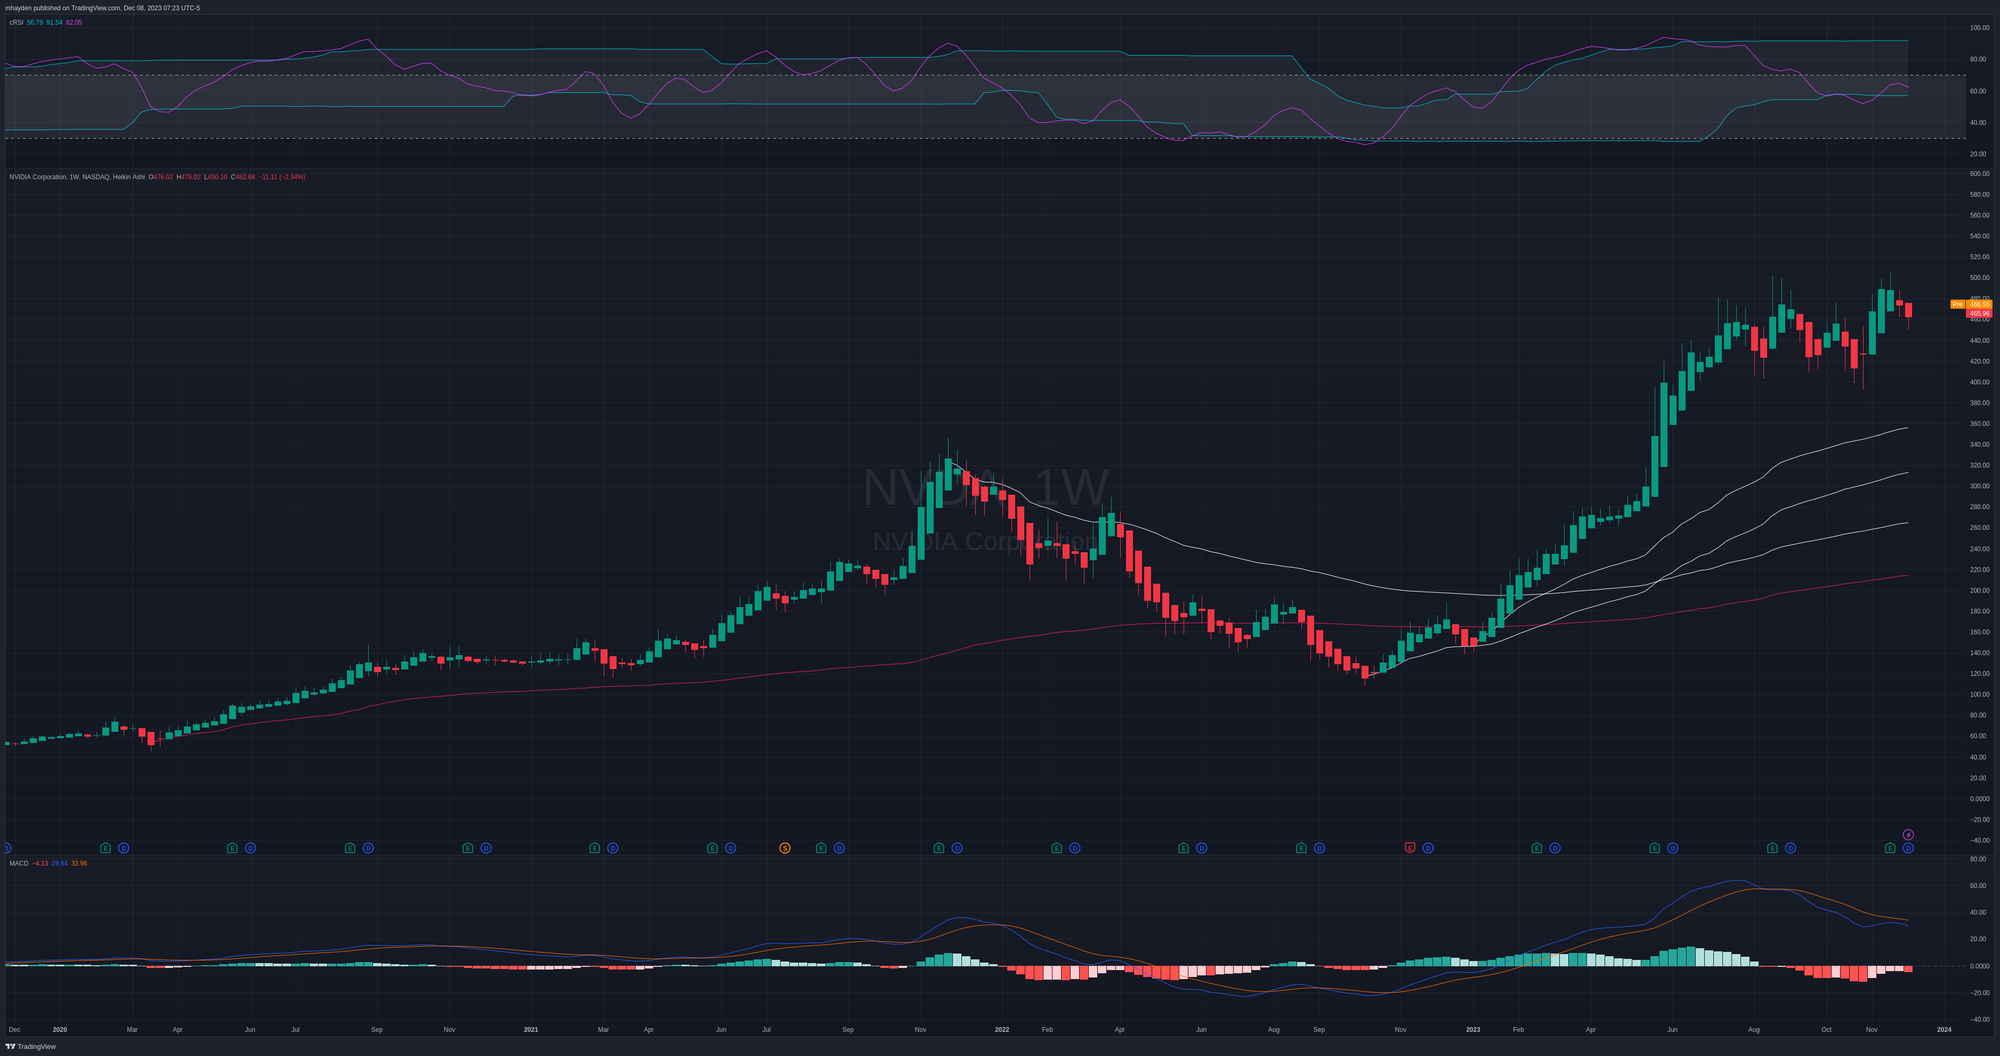
Chart
NVDA's weekly chart shows a bunch of consolidation candles. We're well above most of our VWAP lines, especially the COVID low VWAP which shows up just under $220.
RSI just made a lower high and it sits near the bottom of its channel. A fall through the channel could signal an aggressive move to the downside. MACD is well above zero but it has fallen far from its peak. The fast line is underneath the slow line (bearish), but there's plenty of indecision here.
If we zoom in a little to a daily chart since the gap up in May, add in some moving averages, and add a VWAP from the bottom of the gap, we see some interesting patterns:
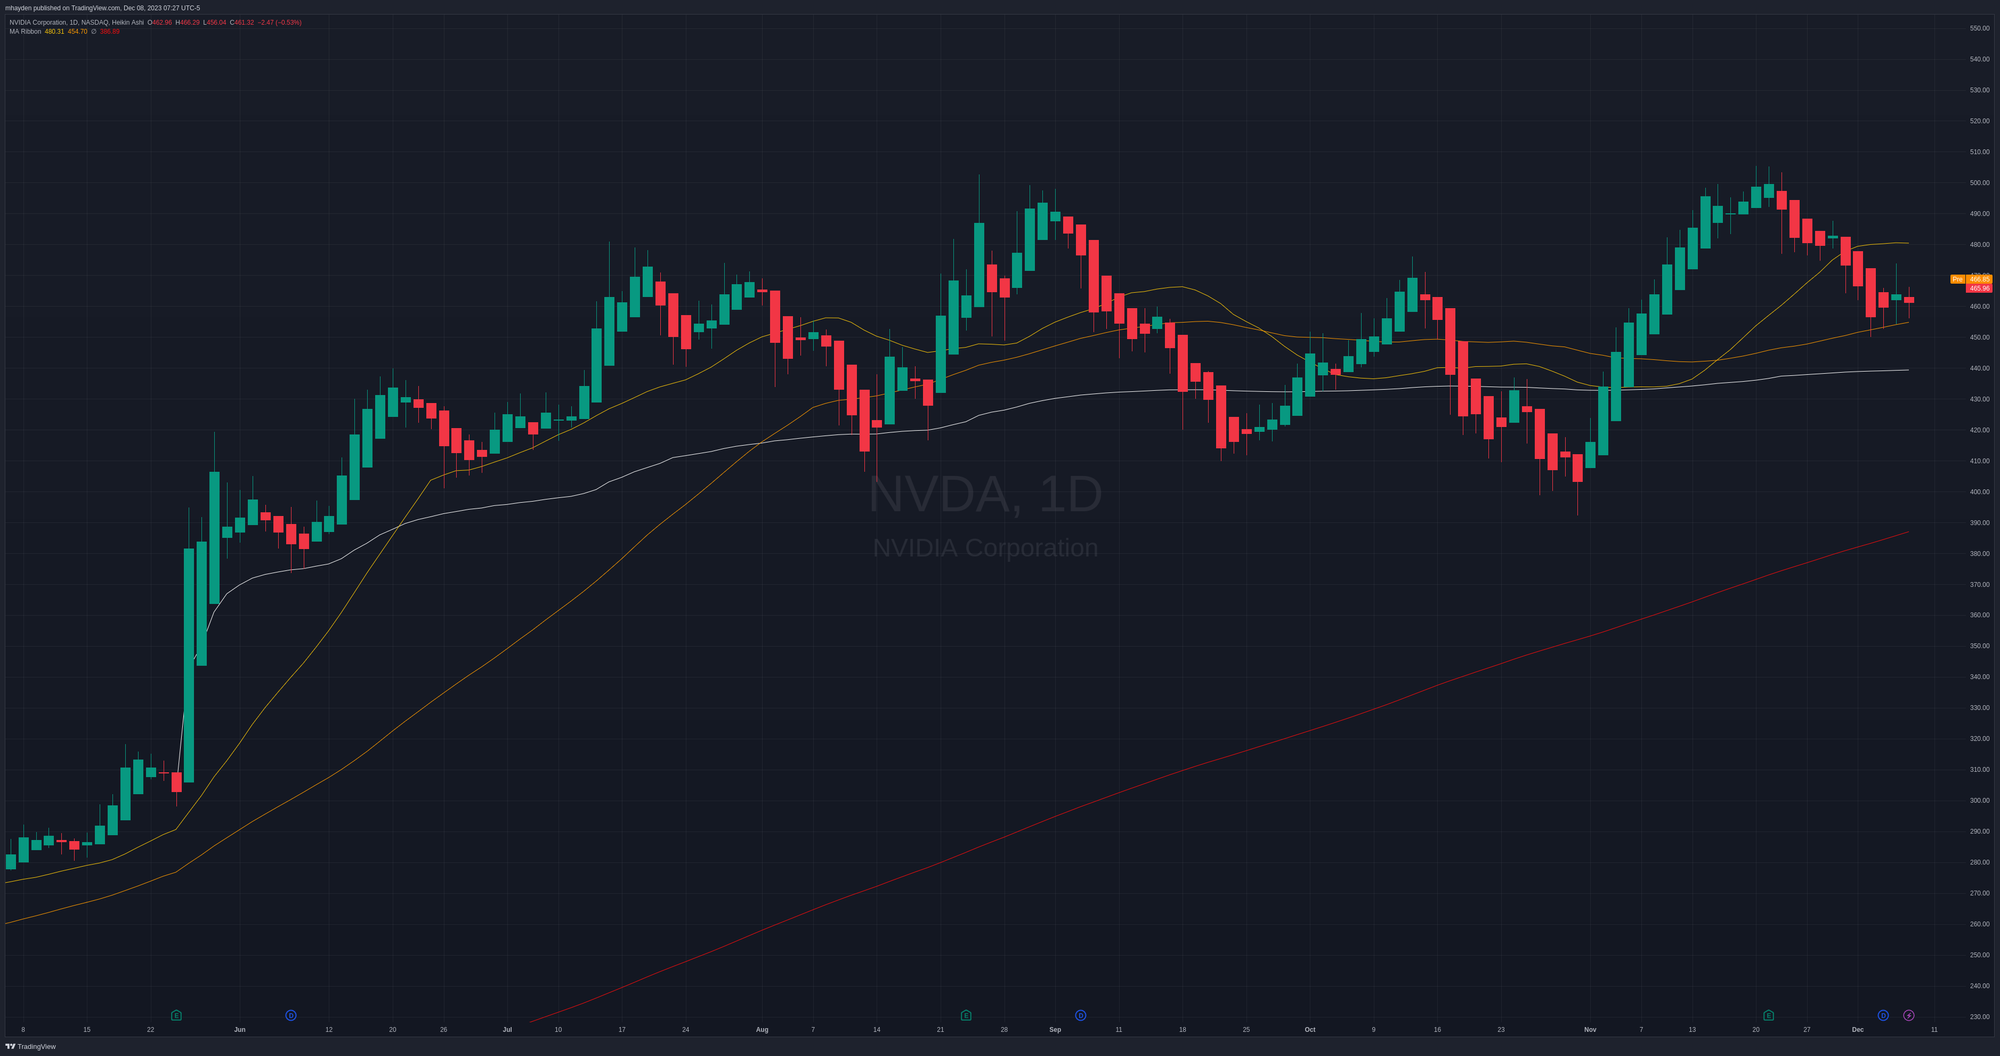
First, note the white VWAP line from the bottom of the May gap. How has NVDA interacted with it since then? We see three tests, each of which seem to get deeper each time. Are we headed for another test that might go deeper?
As for the moving averages, NVDA dipped under the 20 and is resting on the 50-day this morning. The 200-day appears just under $390 and this lines up with our vanna/gamma charts.
Thesis
NVDA has been coiling up since the big gap up and it's tested the VWAP more and more aggressively since then. What else do we know?
- It broke the 20-day moving average
- RSI is moving down to touch the bottom of the channel and MACD is weakening.
- Buying pressure from gamma disappears around $480 but vanna suggests a run to $510-$550 is possible if it can clear $480.
- We also know institutions are quite active at $440 and $490. $440 lines up with our VWAP from the May gap up.
I'm looking at $440 as our initial resistance level with the next one around $390-$400. If we head higher, $480 is a level that must be cleared to open the door to $510-$550.
I bailed early out of my NVDA short strangle where I rolled my puts over and over again. That was not a fun loss. Had I waited, I might actually have a gain right about now. Patience is key, but hindsight is also 20/20. 😉
At the moment, my only NVDA trade is a short put at $400 for 1/19. It's a very conservative play on a stock that loves to have wild swings. I made that bet because the strike sits in an important support zone and $400 is a big psychological level. The 200-day MA is also rising to that level now. I'll manage it when it reaches a 50% gain.
Good luck to everyone today and have a great weekend! 🍀 🌴
Discussion