Let's get back to MSFT

MSFT is on an incredible run, but does it have an end in sight? 🤔

I last wrote about MSFT back on November 3rd and my general thesis was "Oh, surely it can't go any higher. It's running too hot."
Boy, was I wrong. 🤦♂️
Let's get another look and see where we might be going.
All investments come with significant risks, including the loss of all capital. Please do your own research before investing, and never risk more than you are willing to lose. I hold no certifications or registrations with any financial entity.
It's nerdy data time! 🤓
Vanna
As usual, we will start here with a look at vanna across all expiration dates.
The overall curve has a nearly perfect positive shape with lots of positive vanna above the current price. A reduction in IV should drive price higher towards one of the larger positive vanna areas. However, if we see an abrupt climb in IV after the next CPI release, we could be in for a bearish slide. 🐻
If we do slide, we have some help on several $5 and $10 levels all the way down to $300. On the other hand, if we head up higher, we have strong vanna levels at $380, $390, and $400.
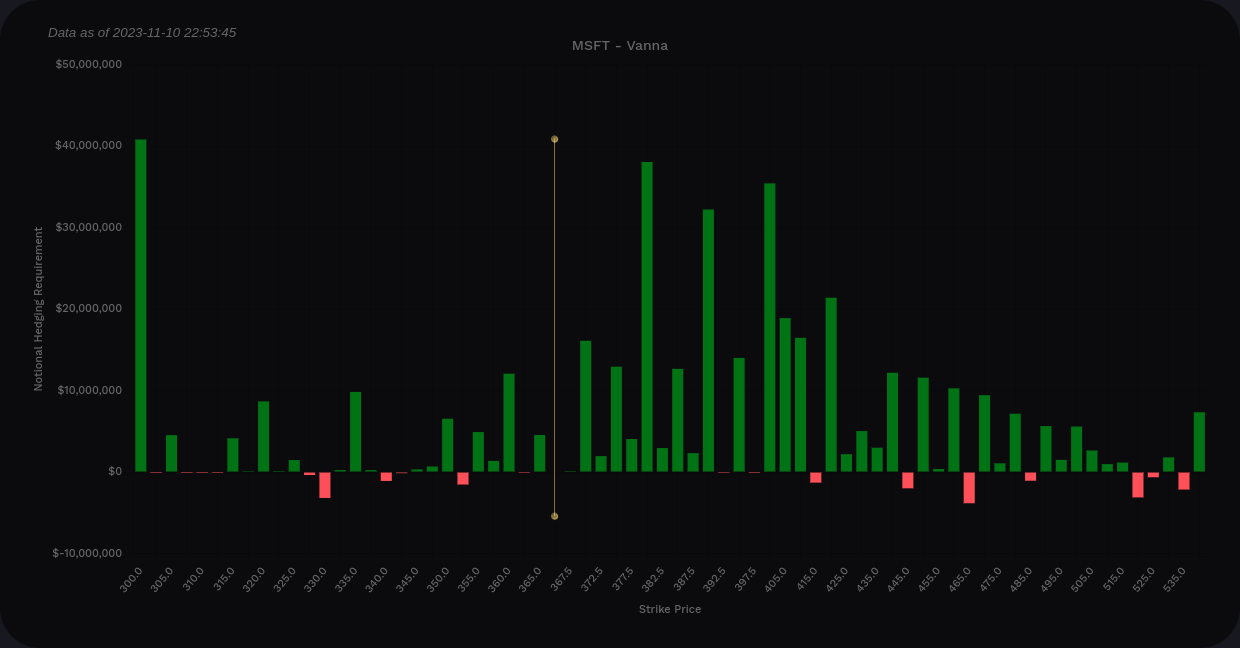
MSFT vanna from Volland across all expiration dates
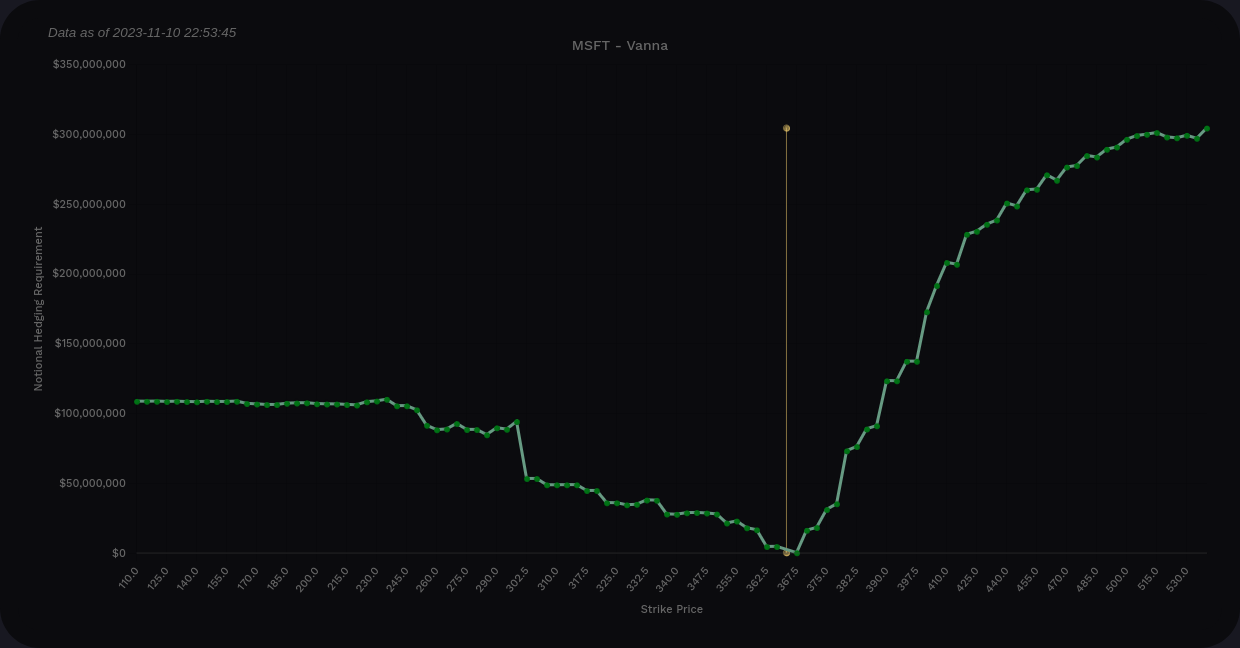
I'm trading a lot of 12/15 options right now, so my next question is around what happens as we head into that OPEX date. This expiration leans bullish, but liquidity is often low in late December.
We have a bullish curve again and almost all of the positive vanna is above the current price at $375 and $380. There is more positive vanna beyond that, but they're much lower.
MSFT vanna from Volland from now through 12/15 only
At the moment, I have a bullish outlook for MSFT to about $380 before 12/15 and possibly to $400 afterwards. That largely depends on where IV goes between now and the end of the year.
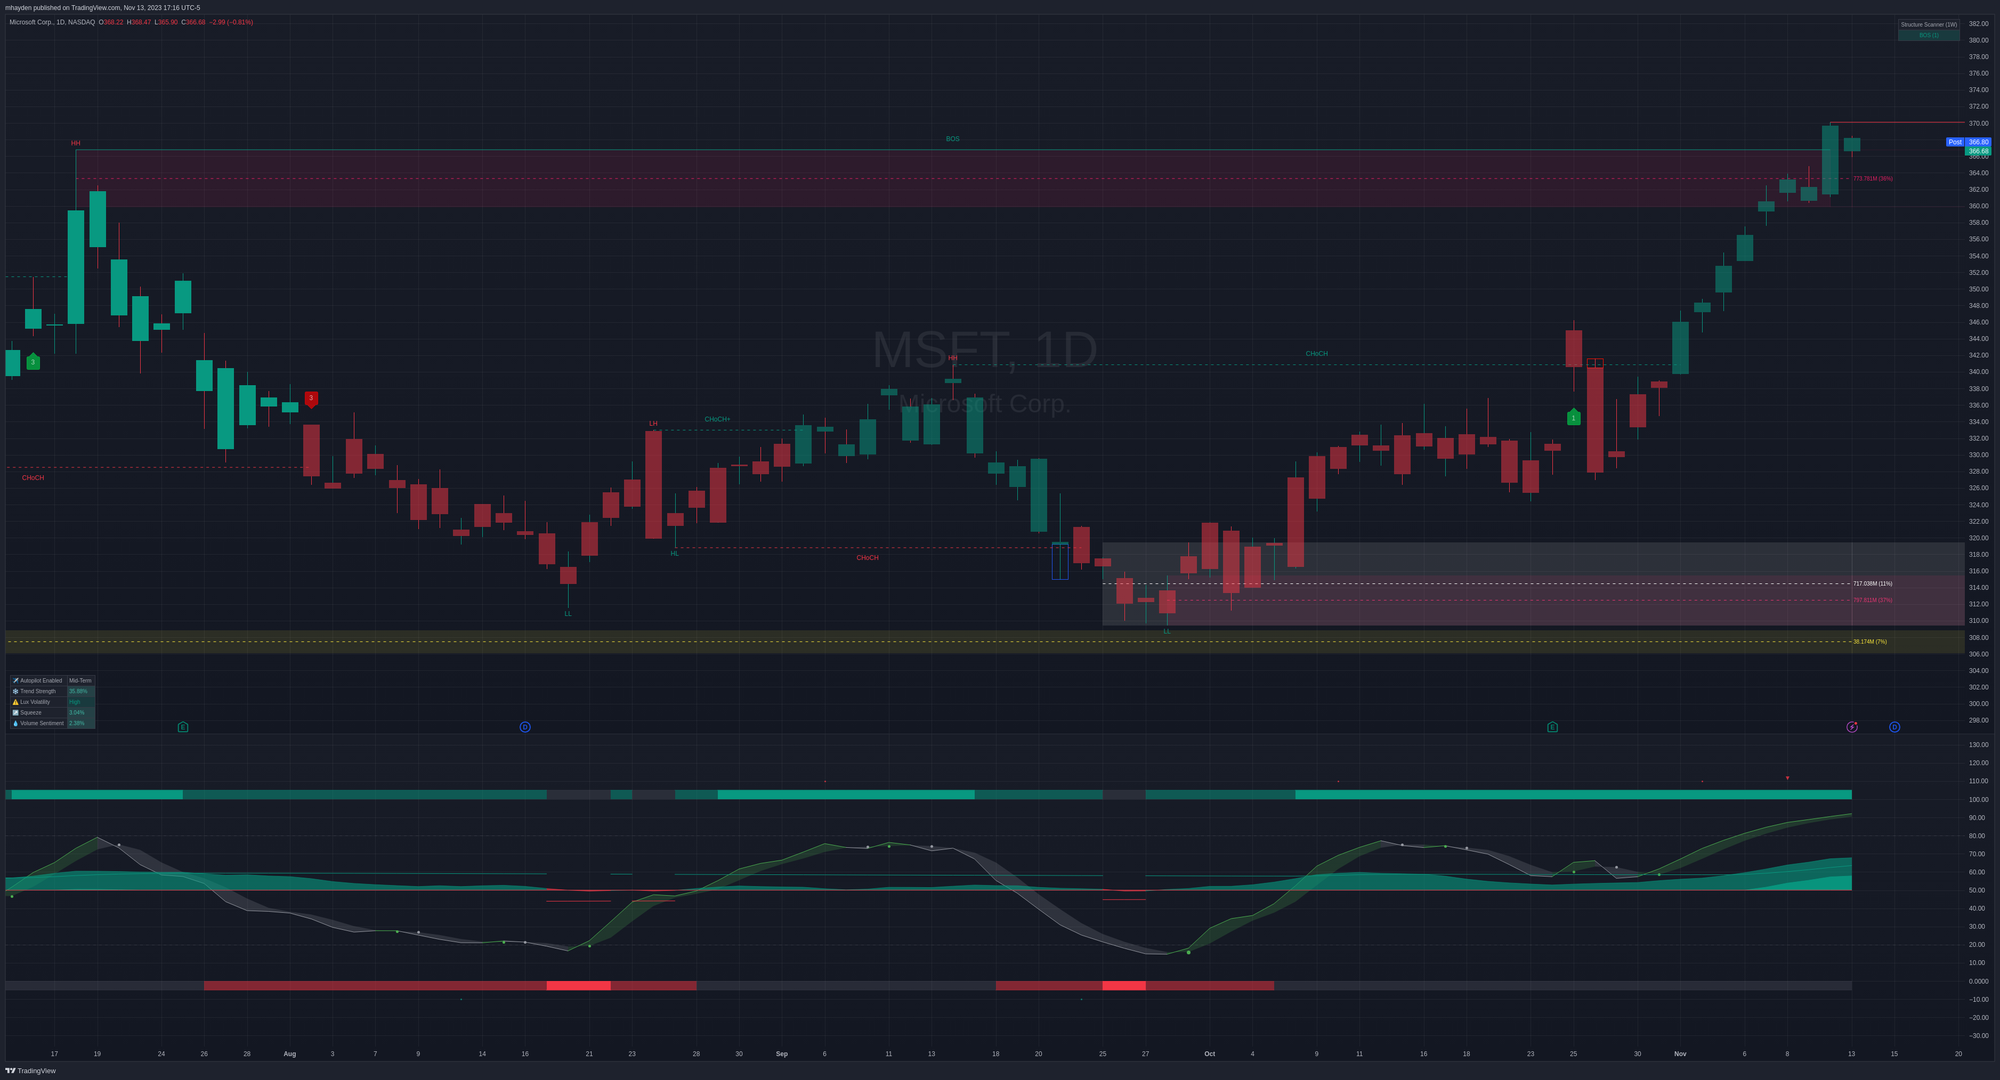
Chart
The weekly chart has a definite cup and handle look to it, albeit a shallow cup. The left side of the cup formed at the end of 2022 and the handle started forming in July 2023. We've now broken out to all time highs. 🚀
Our weekly market structure is a bullish BOS (break of structure) and that setup is a strong one. The oscillator shows positive money flow with a strong wave above the middle line. Today was a sluggish day across the board, so the last candle doesn't tell us too much. MSFT has its ex-div date on Wednesday and that could cause some weird moves this week.

The daily chart is similar, but today's price action left us with only a bullish CHoCH (change of character), which isn't as strong as the weekly chart shows. Money flow is very bullish and we've reached overflow levels (the light green part inside the money flow wave). This is another sign that MSFT is running too hot and is due for a correction.
However, there's nothing on the oscillator that indicates we're headed lower anytime soon and the LuxAlgo trend strength is over 35%. The volume sentiment is tilted 2.38% bullish as well.
Thesis
So we have an interesting situation here where MSFT is on an excellent run with a good market structure and plenty of positive vanna to become a magnet for price to move higher. On the flip side, it has been on an incredible run lately without a large amount of news.
MSFT and NVDA are making incredible moves lately while AAPL and AMZN stumble. Perhaps this is part of a larger shift. I'm not sure yet.
If someone forced me to make a bearish thesis on MSFT, it would be difficult. Sure, the recent moves have been incredible, but I can't find much to suggest it's coming to an end before $375 or $380. 🤷♂️
My MSFT short strangles and call credit spreads both look really terrible right now. The spread might come around if we get a correction soon but there's not much I can do with it today. I've been rolling my short put trade up in the short strangle to capture some more premium but I'm wondering if I'll end up inverted on this trade.
This just goes to show that stocks move in mysterious ways even if all of the overbought indicators look to be flashing red.
Good luck to everyone today. 🍀
Discussion