Trading PYPL

I surprised myself by making a PYPL trade yesterday. Let's break down the analysis that led to the trade and see where it goes. 🕷️

I've shied away from a trade on PayPal (PYPL) for a while now, but some things changed which made me re-evaluate my previous thoughts on it. I'll go through my thoughts here in the post, but first:
All investments come with significant risks, including the loss of all capital. Please do your own research before investing, and never risk more than you are willing to lose. I hold no certifications or registrations with any financial entity.
Let's get this Tuesday started! 🚀
Fundamentals
I'm definitely not a fundamental trader. You'll find me staring at charts much more often than quarterly earnings reports. 😉
However, PYPL had increasing earnings throughout most of last year with guidance increasing as well (except for a small Q2 2023 miss). They've guided down a bit for Q1 2024 and they took a hit for that during the last earnings call.
Outside of Q2 of 2023, net income has increased and margins have increased since Q2 2023. On a yearly view, PYPL has increasing revenue every year since 2019. 2022 was a rough one with a big nose dive in net margin. They've bounced back in 2023.
Enough about this. I want to talk about charts! 📈
Charts
A weekly chart since COVID is absolutely wild:
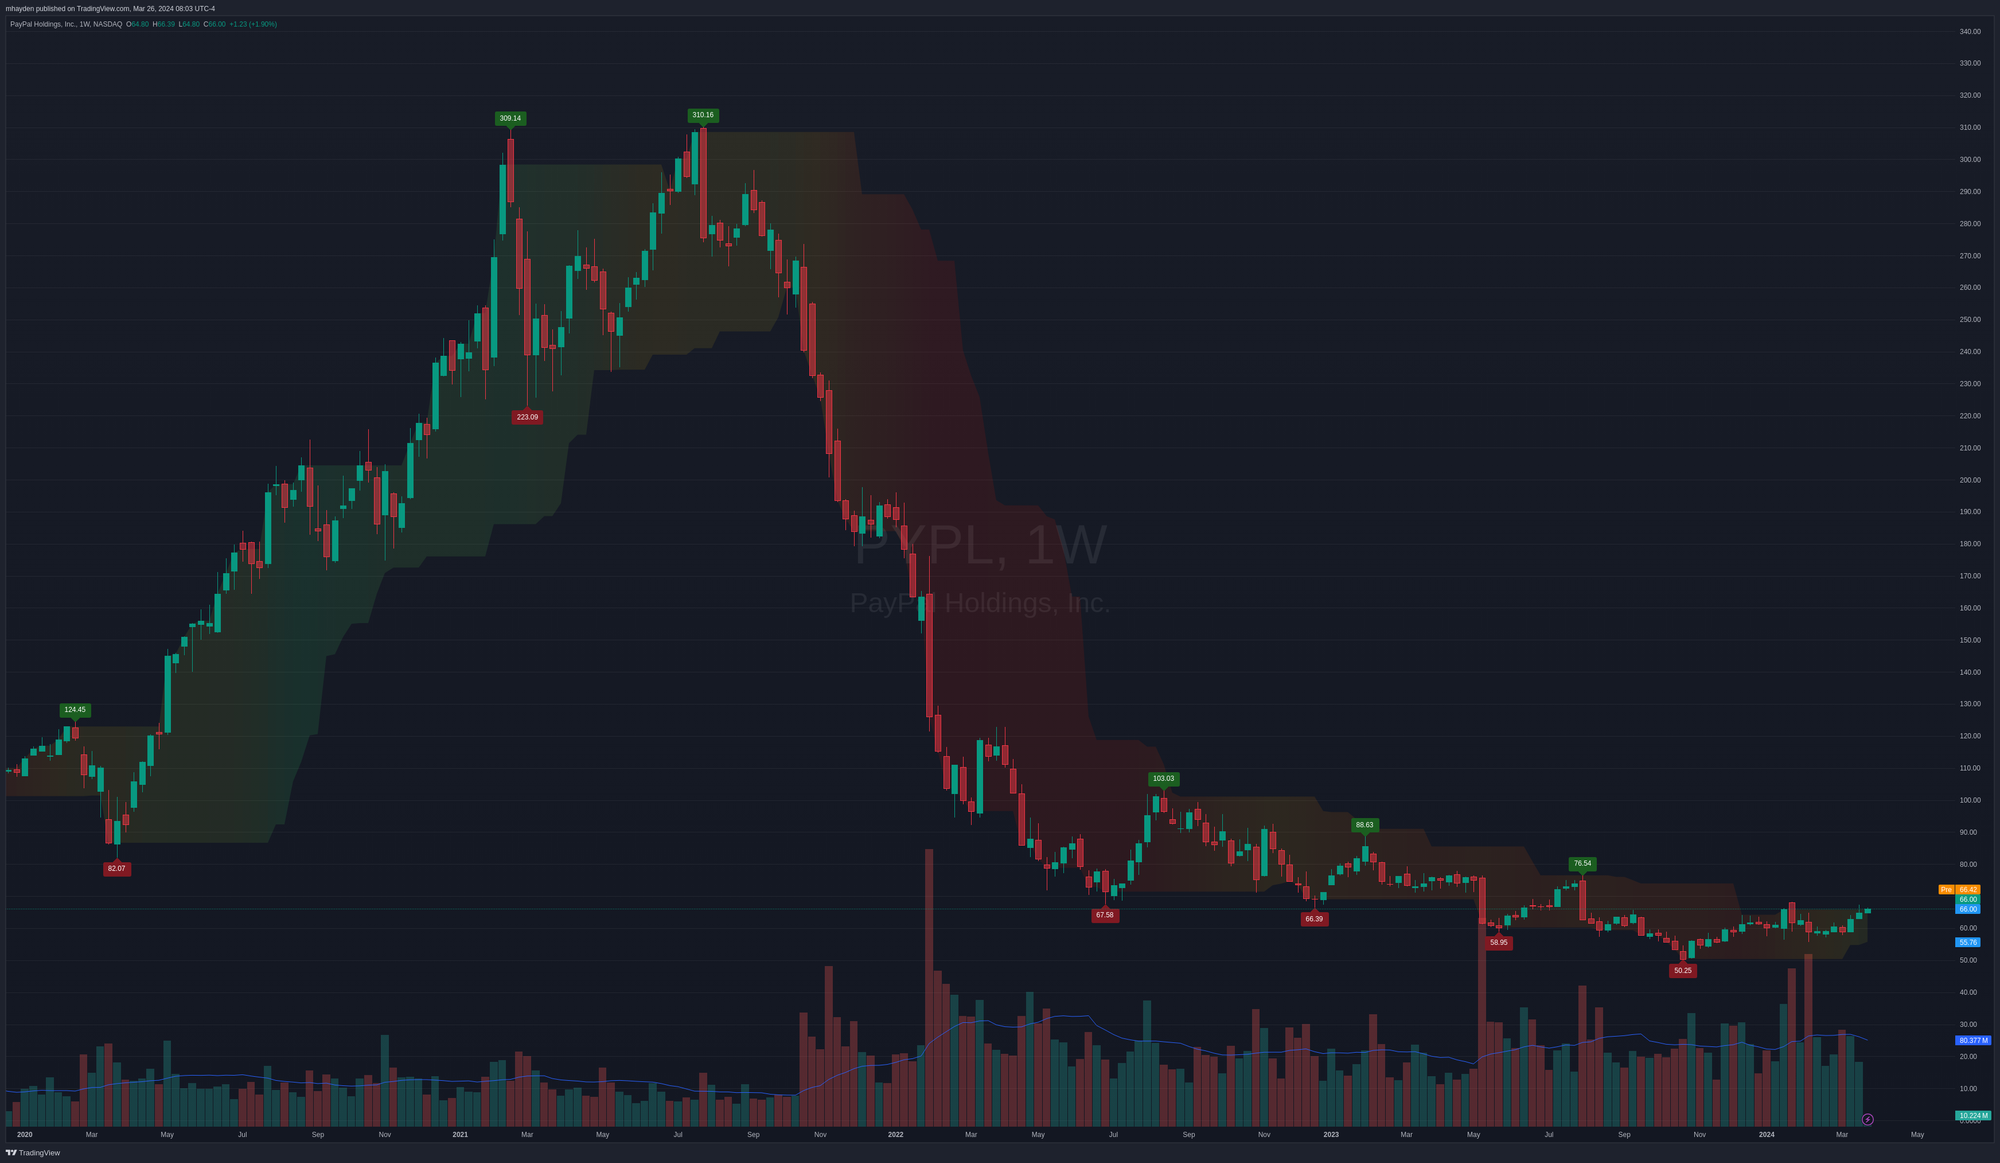
With everyone being at home and paying for nearly everything online, PYPL's valuation went through the roof in a frenzied run from $82 to over $300. 🤯
Things settled down in 2022 as people ventured out much more often and interest rate hikes crushed some of the pent up demand. PYPL settled into a slow grind downwards with lower lows and lower highs:
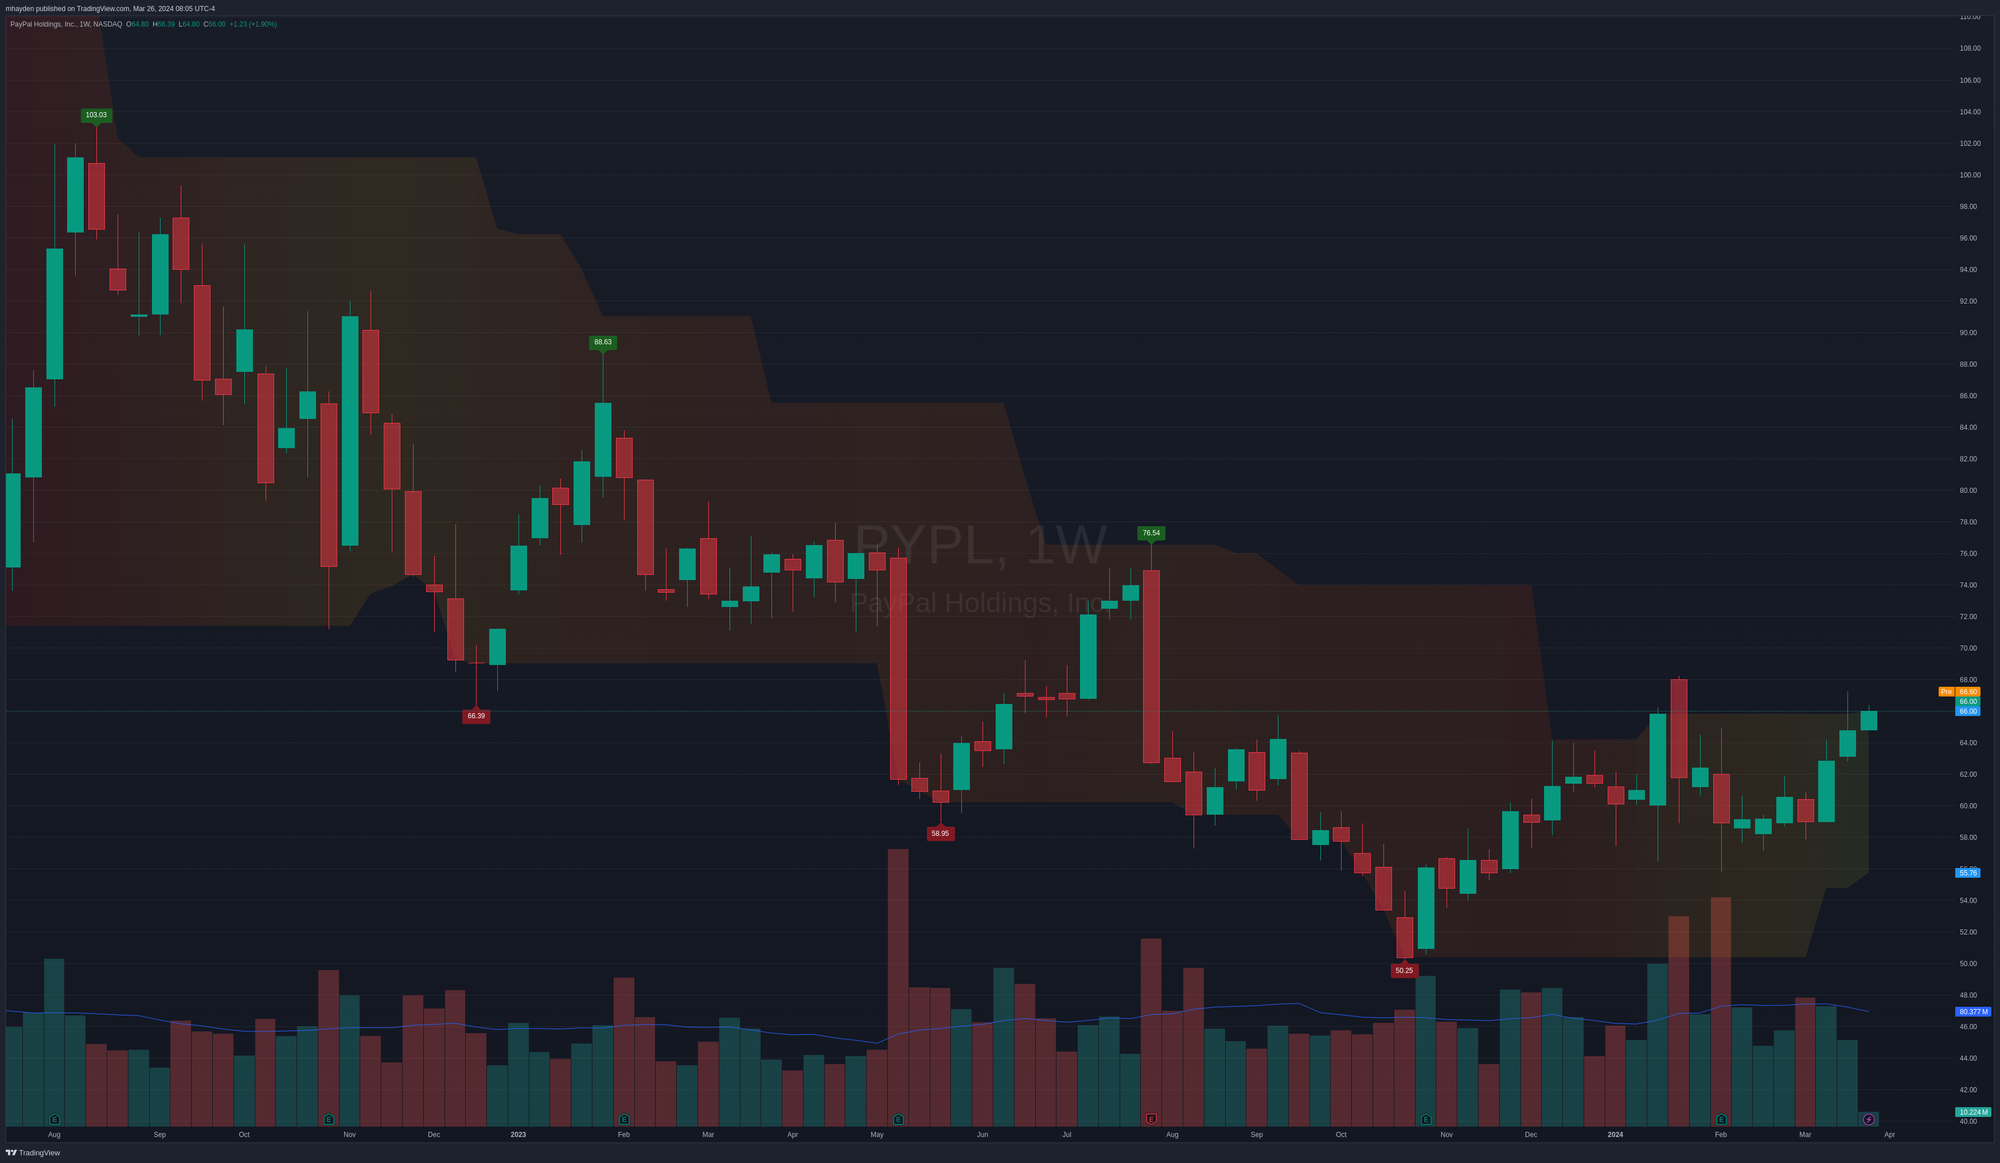
A change in the pattern emerged late in 2023 when the market turned. Sometimes marking up these charts helps, so let's drop to a daily and add some trend lines:
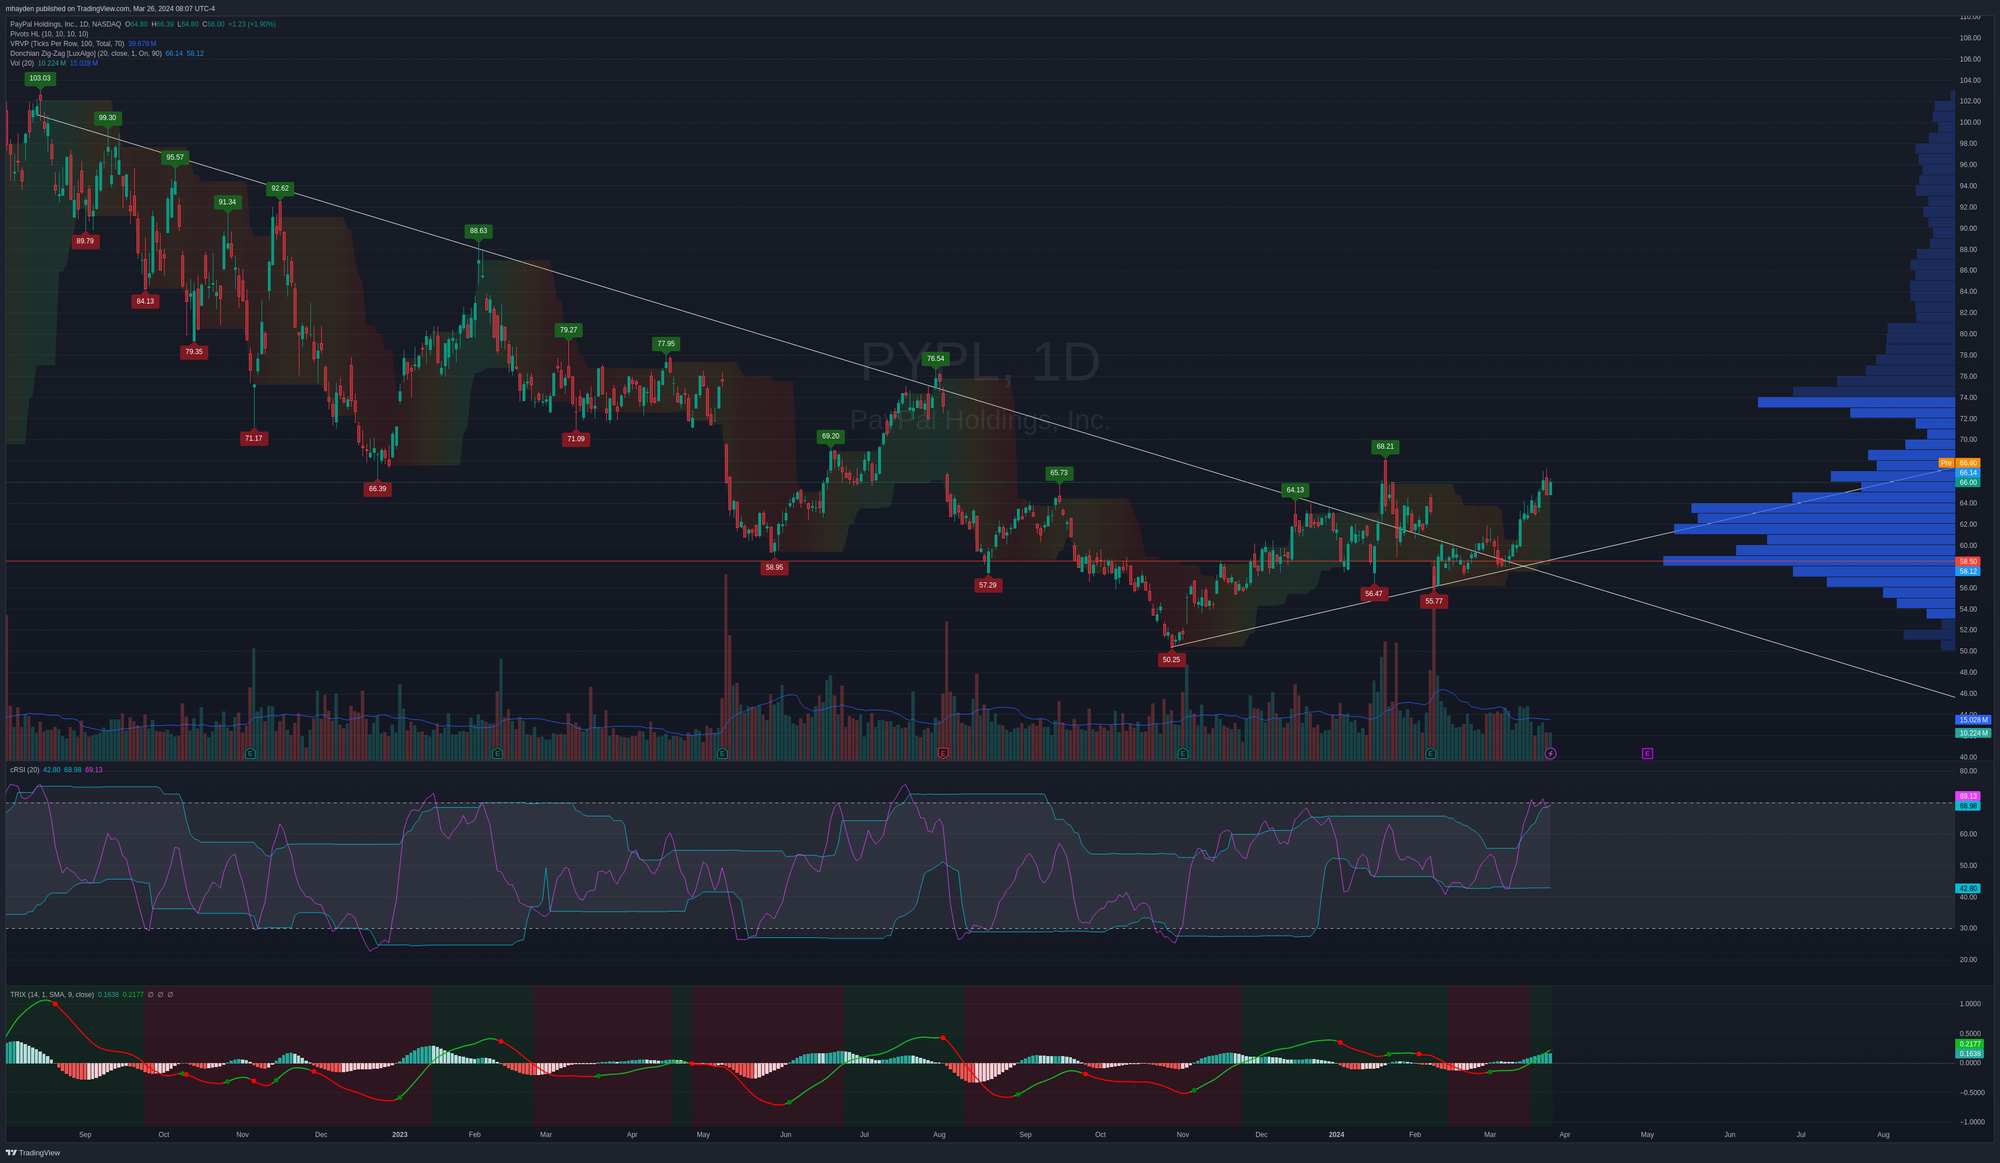
There are some things I really like to see here:
- We see trend lines crossing recently as price broke above a very long downward trend. After price broke through, it came down for a hard retest during the last earnings call and began to grind higher.
- The cRSI indicator shows that the price broke through the top of the RSI channel as PYPL broke the downward trend line.
- The TRIX indicator, a mix of moving average indicators, crossed the zero line and gradually gained strength.
- Our point of control on the volume by price indicator (blue bars at right) shows that the volume is concentrated around $58.50 with 70% of the volume between $73 and $54. This suggests we have a strong base with a potential to run into the low $70's.
It's not all perfect, though. There's a low volume area around $70-$72 that might be challenging for PYPL to push through. We might see a pull back down to test a high volume area followed by a move up. There's potential for that low volume area to cause move back down that begins a new downward trend.
Either way, PYPL is trading above a pretty good base and it's about $20 short of where it was trading prior to COVID.
Institutions
Volume Leaders shows large trades made on the market and via dark pools, but it doesn't tell you the direction of these trades. It's up to us to infer that after seeing the size, price, and time.
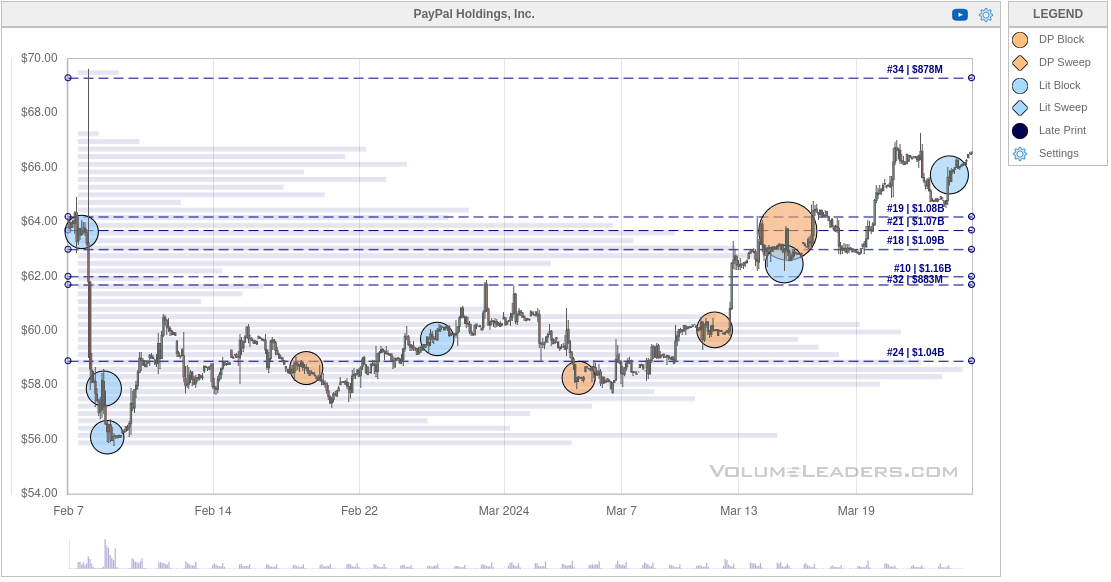
PYPL's chart here starts around earnings time. Price fell like a rock and then caught some institutional trades around $56. As PYPL wiggled around $56-58, institutions traded it via dark pool and lit exchange trades. An even numbered trade of 500,000 shares appeared on February 27th at $59.70 and I pay attention to these.
Price re-tested the $58 level and began moving higher. Then the big circle appeared at $63.56 on March 15th and it represented 2,052,800 shares being traded. That lines up with the last big level just before the earnings call. Another lit exchange trade appeared later and price kept moving through it.
I love these setups! Here's the gist:
- Price falls for some reason (news, earnings, etc)
- Consolidation occurs around a narrow range while institutions make trade (the more dark pool trades, the better)
- Institutions make a large trade as soon as we get a breakout from the consolidation (the 2M+ share trade on 3/15)
- More trades occur with price moving upwards through it
Here's another example of one of those from IWM that I posted yesterday:
Last time we hit here, we ran back down to $200-$202. Will this time be different? 🤔
— Major, the Theta Nerd (@thetanerdy) March 25, 2024
Saw a chart this morning showing short interest in small cap energy names is increasing. 🛢️ pic.twitter.com/tu7YY0IKuj
This is the original chart:
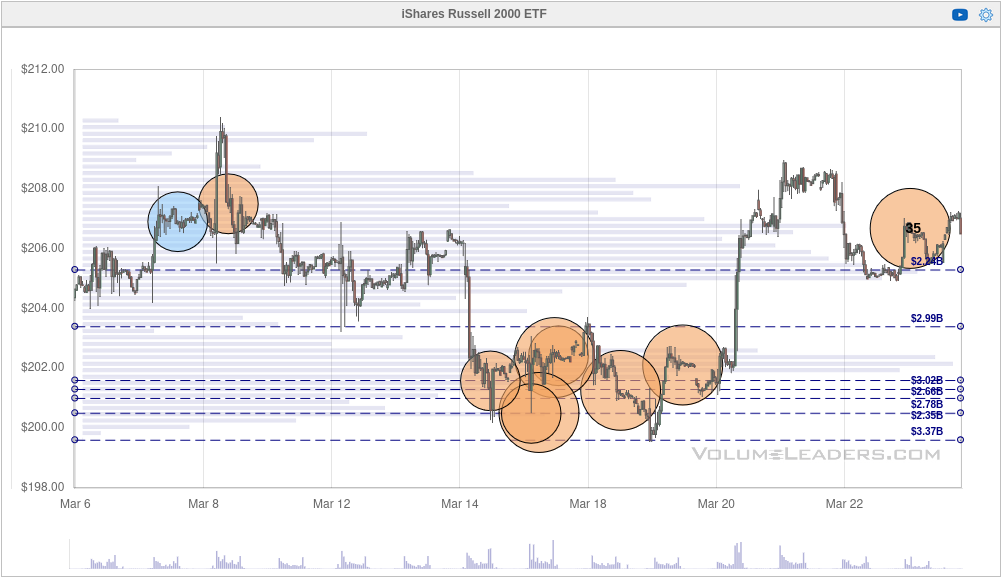
Look at how IWM's price fell off, consolidated with tons of dark pool trading, then blasted off once more. I'm increasingly enjoying trading these setups when I can find them. 🚀
Thesis
First off, I'm not a fan of PYPL. I avoid using them for my payments whenever possible. However, I'm just trading the chart in front of me today. I like the consolidation and institutional attention during that period and I like the breakout from the downward trend which includes a hard re-test.
I've started out with a short 5/17 $60 put for $1.83 credit:
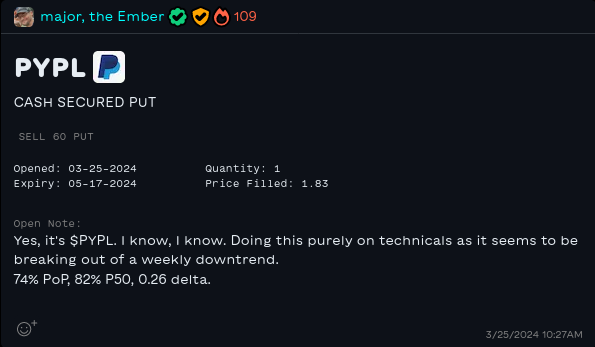
This uses just under $900 in buying power in my account and it has a 74% theoretical probability of profit. With 52 DTE, I have some time to be right in case this one turns against me. My breakeven sits at $58.17, so as long as PYPL clears that level, I'm due for some amount of profits. That breakeven is right around the hard retest level on the new upward trend line.
Good luck to all of you today! ☘️
🚨 Remember that this week is a short week since the market is closed on Friday. We get GDP numbers Thursday and Core PCE numbers Friday (while the market is closed!)
Discussion