UPS analysis for 3/28

UPS packaged up some interesting price action this week, but will it deliver on its new price trend? I'm shipping some new charts your way this morning. 📦

Happy Thursday! As a reminder, the market is closed tomorrow for Good Friday. Be sure to get your positions in order before the long weekend. I hope your weekend is great. 🌞
All investments come with significant risks, including the loss of all capital. Please do your own research before investing, and never risk more than you are willing to lose. I hold no certifications or registrations with any financial entity.
Today's post will focus on UPS and what the data suggests about the current price trend. Let's get to the data! 📈
Some news arrived this week
UPS CEO Carol Tomé mentioned that the current package delivery system – including the US Postal Service along with other carriers like UPS – has enough slack in the system and they won't restrict how many Amazon packages they accept. At the same time, she said it isn't the right time for a price war and that some UPS employees would be laid off.
$UPS asks: "What can brown do for you?"
— Major, the Theta Nerd (@thetanerdy) March 26, 2024
For starters, don't do this: 🤣 pic.twitter.com/wdeWaXyQdS
The market didn't like that and UPS sold off more than 8% in one day. It did that one day after I sold a put! 🤦♂️ (More on that later.)
Charts
Here's a broad look at UPS since the COVID lows on a weekly time frame:
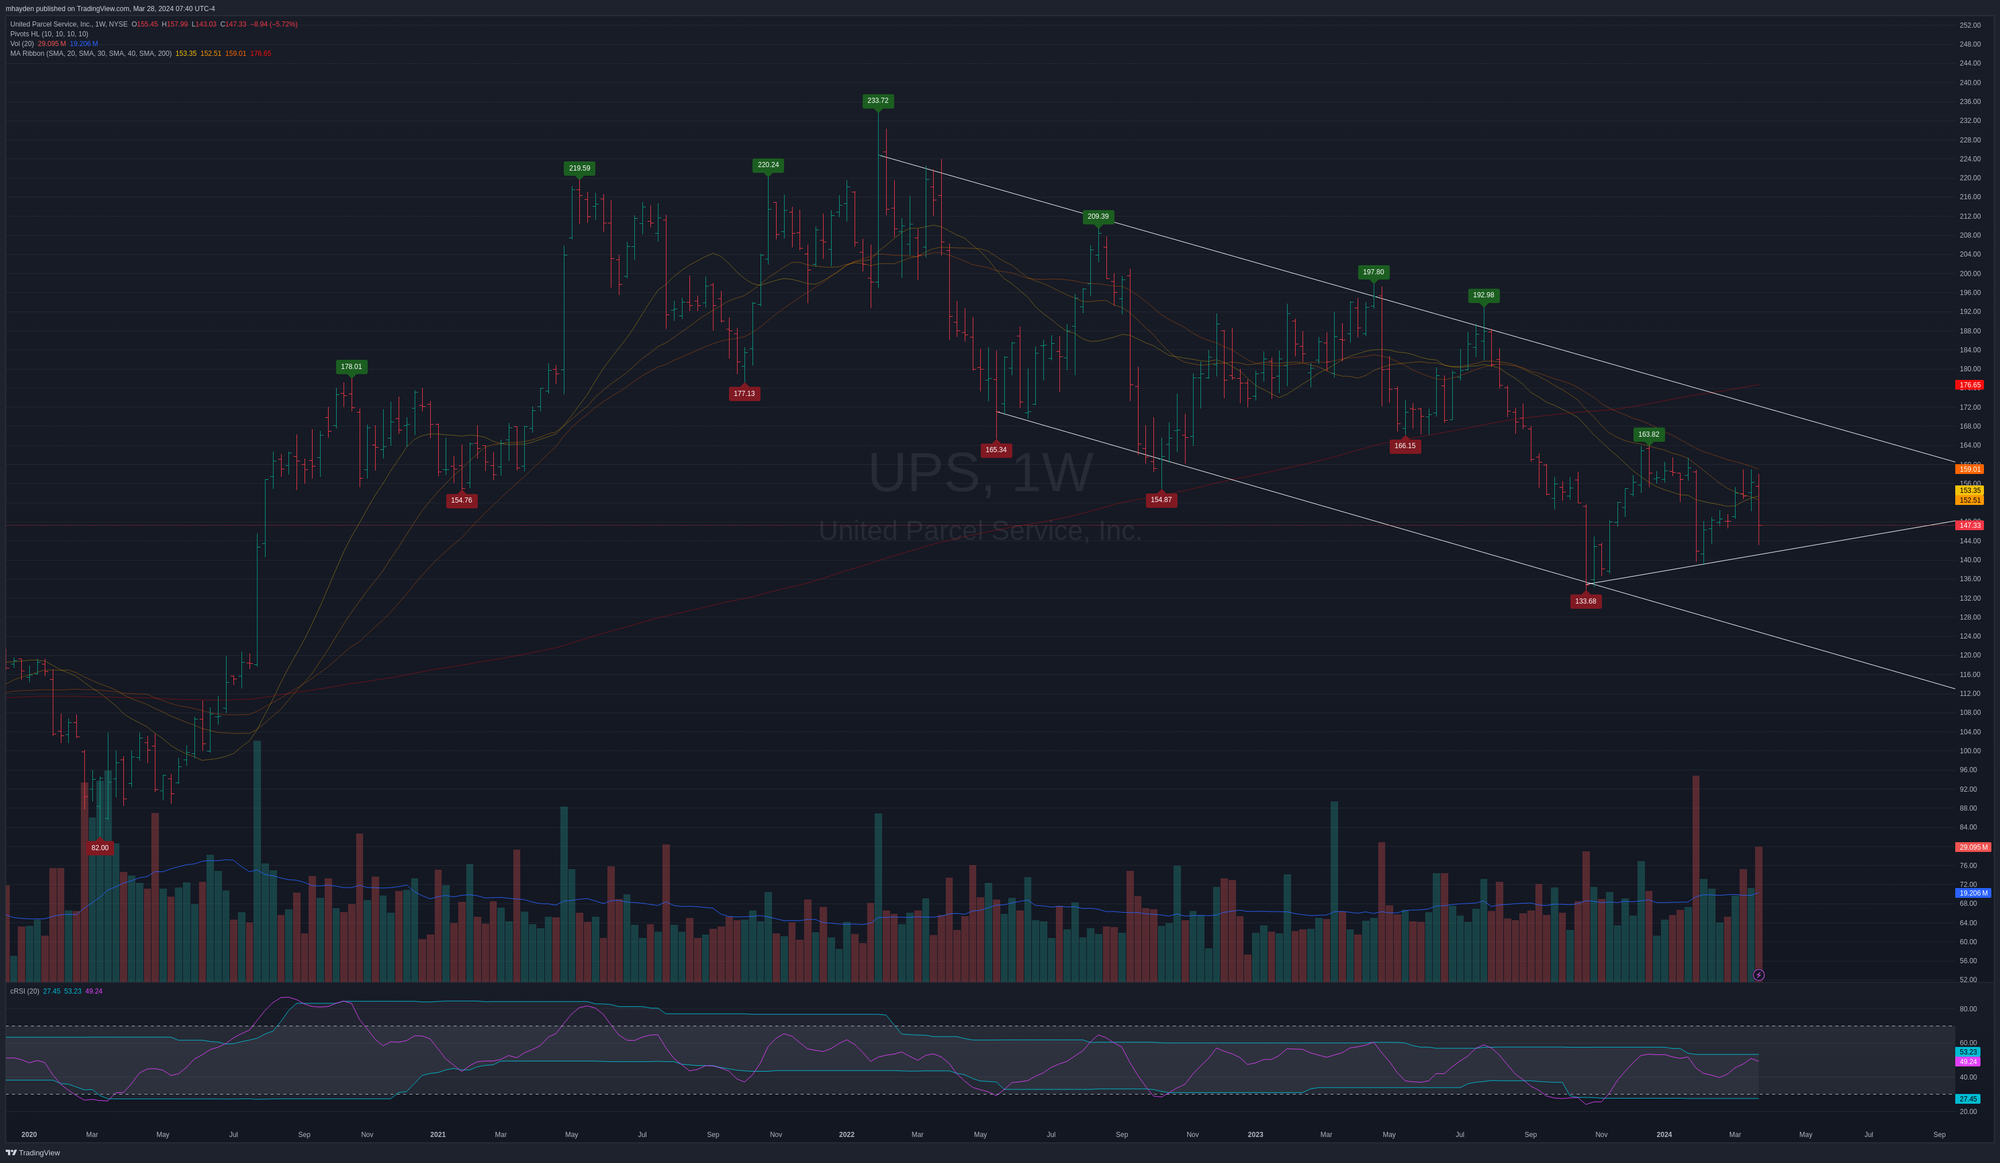
UPS soared through 2020 and 2021 and more and more people bought items online. Some of this was due to store closures and social distancing, but there was a high demand for durable goods during this time period as people couldn't enjoy entertainment outside their homes.
All of that peaked in early 2022 around $233 and UPS slid into a long downward channel that changed its plans around November 2023. That was part of the big bullish market shift that is still underway this week.
Let's zoom in a bit on a daily chart since last fall and review this new pattern:
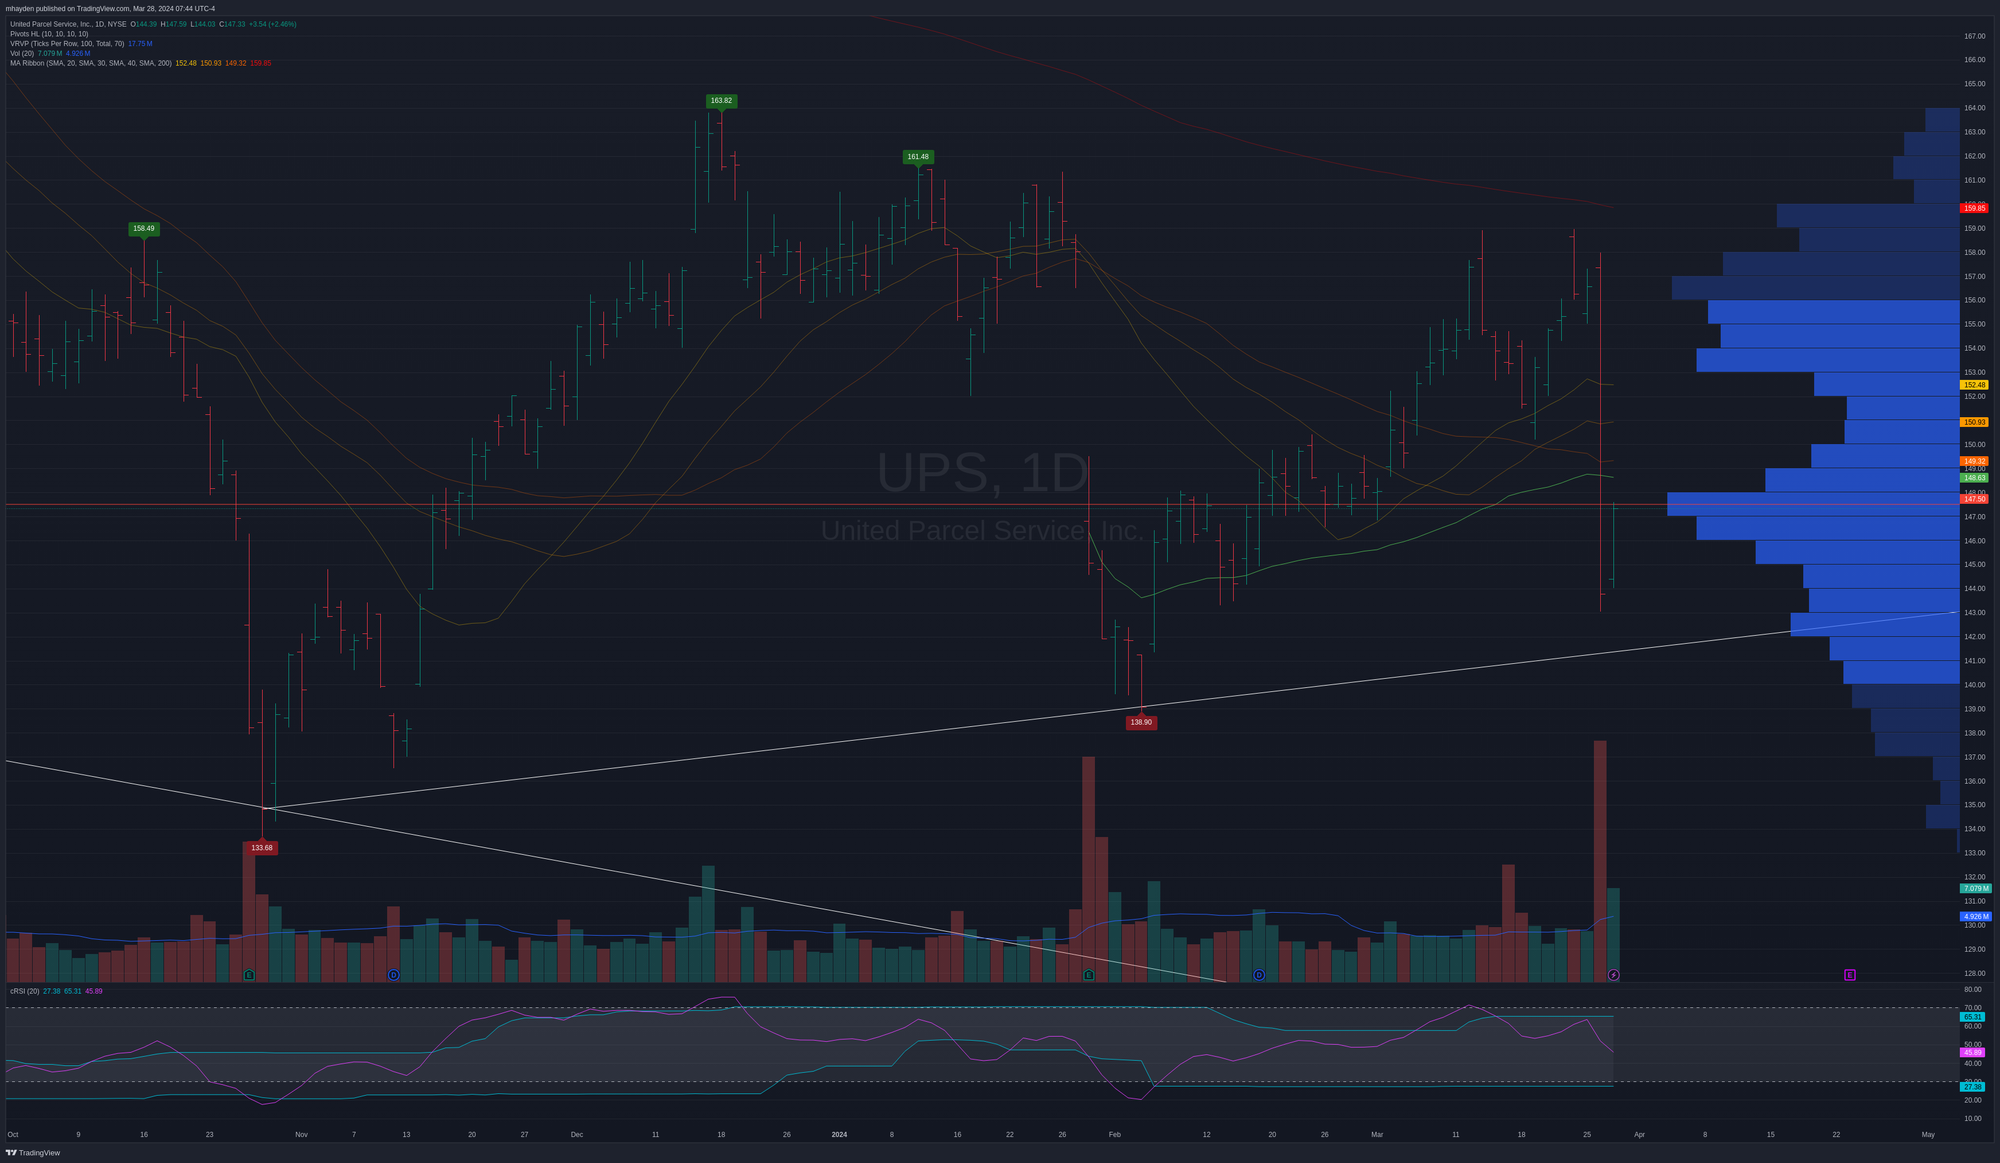
Our long term downward channel trend line is the white line at the bottom and the new trend is the white line tilting upwards and to the right. Let's make note of a few other items here in the chart:
- UPS had strong relative strength (see RSI indicator at the bottom) that broke out of the channel and made a higher high along with the price. This week's huge drop took the strength out of that rally in a snap, but we didn't lose our lower trend line.
- We're below the 200 day moving average today (faint red line at the top), but it is moving closer to the current price. The 20/30/40 day moving averages are now properly stacked in the right order (a bullish sign), but that big drop from this week sliced right through all three of them. 👀
- The highest volume area sits right around $147.50 since the fall 2023 lows. 70% of the volume sits between $140-$156 (lighter colored horizontal bars at the right).
- The light green line is the volume weighted average price (VWAP) since the earnings call in January. UPS was sitting well above it until the drop this week. I'd like to see it reclaim that level as soon as possible.
Overall, UPS changed its character from the old downward channel, but we're still in the channel right now. I'm very interested to see if UPS can continue grinding higher steadily and break through the top of that old channel.
Institutions
Volume Leaders identifies large trades made in the market, likely by institutional traders. As a reminder, it doesn't show directionality. However, we can infer what was happening based on time, size, and price.
Here's a look at UPS since the fall 2023 lows:
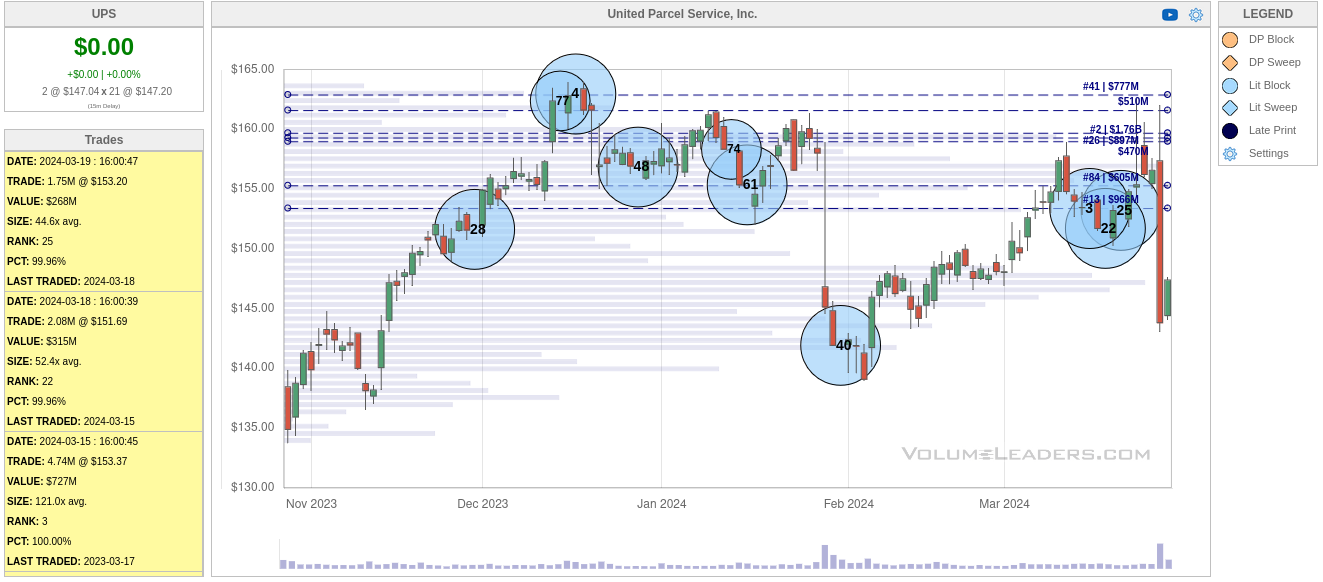
A #40 trade (40th biggest trade in UPS history) showed up at the lows after the earnings report and look where UPS's fall ended this week. An interesting coincidence. 🤔
$160-$165 looks like the top end right now, but I'm curious about the recent very large trades, especially a #3 trade, right around $153 before this week's drop.
Let's zoom in a little and look at UPS since the earnings call:
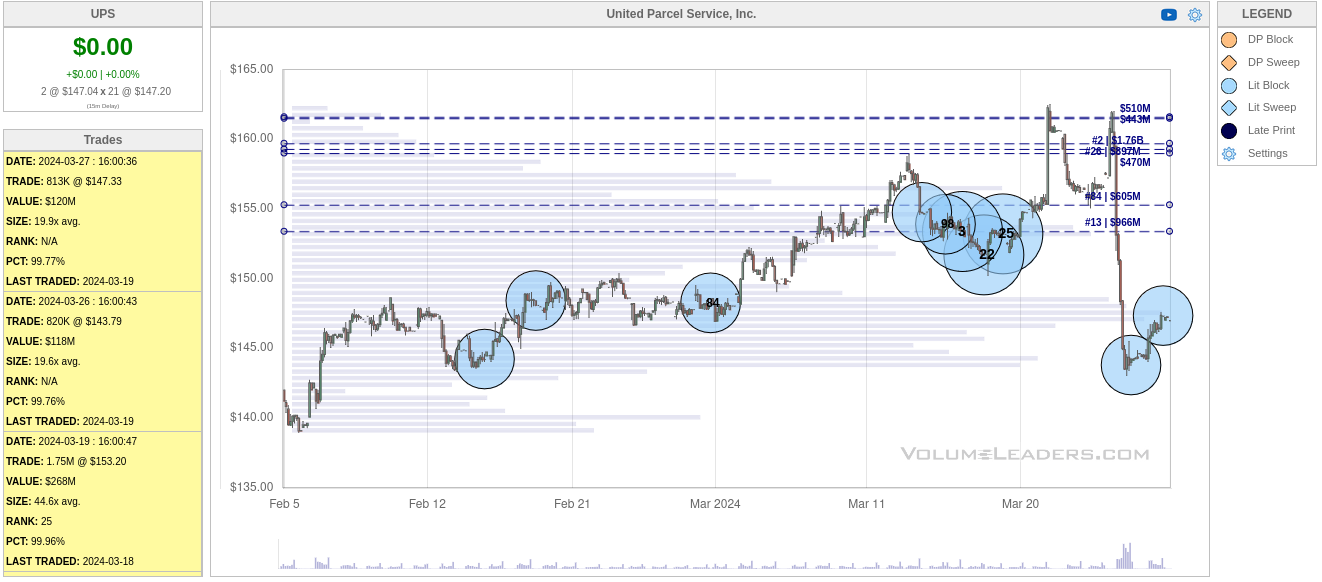
I like to see price trading up through some of these bigger trades and some of these are very large. The #3 trade around $153 is 4.7M shares. There are some trades nearby of 1-2M shares each.
This week's drop brought out two large trades right around that old #40 trade post earnings. Each of these are just over 800,000 shares and that fits the pattern I like to see where institutions "nibble" on a stock before doing a "full send" with a big trade. It looks like that's what they were doing recently until they got goosed with the CEO's comments this week.
I'm inferring that the trades in the low $140's are buys and I like to see that. I'd really like to see the left side of this chart repeat itself again where price grinds higher and institutions trade relatively small chunks before a big trade. This is my favorite institutional pattern by far.
Thesis
There's a lot to like about UPS stock right now. We have a small change in character, we have institutions buying dips (inferring again here), and I'm seeing my "nibble before full send" pattern once more. I also like the UPS business model of training drivers thoroughly and avoiding the use of local contractors (looking at you, FedEx) to handle last mile delivery.
However, there are some question marks. Sure, the shorter term moving averages finally turned bullish recently, but we're still sitting underneath the 200 day moving average. I'd like to see price reclaim that line along with the earnings VWAP.
As I mentioned earlier, I sold a UPS $145 put for 5/17 just last week. This week's drop around the comments from the CEO was a big surprised and my put looked terrible on Tuesday. The situation improved yesterday and I'm no longer "in the money", which is a great feeling.
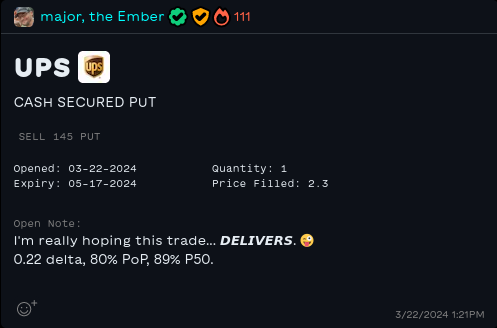
I went into this trade with some extra time on it and there are still 50 days left until expiration. This gives me a little more theta (money made from time decay on the option) and lets me weather some of these bumps along the road. My target here is 50% profit or management at the 21 DTE (21 days to expiration) mark. I always put on 50% good-to-close orders as soon as I make a trade. 😉
Good luck to everyone today and I hope you enjoy your weekend! 🌴 🍀
Discussion